CFA Institute

When the Equity Premium Fades, Alpha Shines

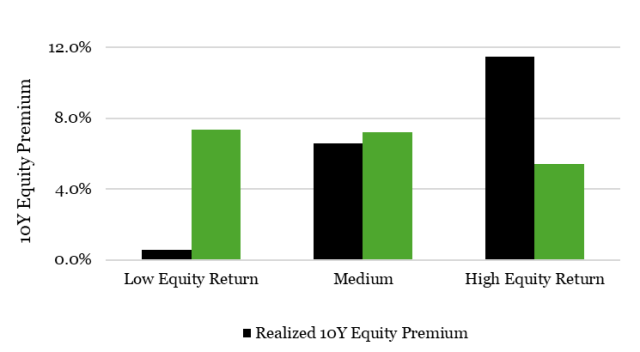
For more than a century, the equity risk premium (ERP) — the excess return from stocks over bonds or cash — has been the backbone of investing, delivering 5% to 6% annually above safer assets. But this era may be fading. With US valuations at historic highs, earnings growth slowing, and structural challenges mounting, the ERP could shrink to zero. In this new landscape, alpha — returns driven by skill and strategy — will become the primary source of performance. This blog examines why the ERP is declining, how alpha thrives in low-return environments, and most importantly how investors can adapt to a beta-constrained future. The Shrinking Equity Risk Premium Historically, US equities have returned 10% annually, fueled by expanding valuation multiples, robust earnings, favorable demographics, and US market dominance. From 1926 to 2024, the ERP averaged 6.2%, peaking at 10.6% from 2015 to 2024. Yet, history reveals a pattern of mean reversion: strong decades often precede weaker ones. After high-return periods, the subsequent decade’s ERP typically underperforms the long-term average by ~1%, while weak decades lead to returns ~1% above average (Figure 1). Figure 1 | Realized and subsequent US 10-year equity premiums Source: Robeco and Kenneth French Data library. US stock market returns 1926-2024. This graph is for illustrative purposes only. Today’s market conditions raise red flags. The cyclically adjusted price-to-earnings (CAPE) ratio hovers near historic highs, dividend yields are subdued, and real earnings growth faces headwinds from aging populations and rising costs. Leading asset managers, including AQR, Research Affiliates, Robeco, and Vanguard, project a near-zero US ERP for 2025 to 2029, with valuation-based models even warning of negative returns. In contrast, global markets –particularly Europe and emerging markets — offer a more attractive and still positive ERP, driven by higher valuations and growth potential. Alpha’s Rising Importance As beta weakens, alpha takes the spotlight. Factor premiums — returns from strategies like value, momentum, quality, and low volatility — perform robustly in low-return environments. Historical data (1926 to 2024) shows that when equity returns are high, factor alpha contributes 25% of total returns (3.9% of 15.4%). In weak markets, alpha’s share soars to 89% (4.9% of 5.5%), as factor premiums remain stable or rise (Figure 2). Figure 2 | Realized US Equity and Factor Premiums Source: Robeco and Kenneth French Data library. Sample US 1926-2024.This graph is for illustrative purposes only. Figure 2 demonstrates that factor premiums grow in importance as equity returns decline, boosting alpha’s role. Academic research reinforces this dynamic. Kosowski (2011) found that mutual funds generate +4.1% alpha during recessions, when markets are toughest, compared to -1.3% in expansions. Blitz (2023) shows that factor alphas increase when equity returns fall, making strategies like value and momentum critical in low-ERP environments. A broader historical perspective (1870 to 2024) by Baltussen, Swinkels, and van Vliet (2023) confirms that factor premiums thrive across market cycles, particularly during high-inflation or low-growth periods. Low-volatility stocks, for instance, outperform during market downturns, offering a defensive edge. This shift has profound implications. In a zero-ERP world, alpha isn’t just an enhancement; it is the dominant source of return. Active quantitative strategies, which systematically exploit factors like quality or low volatility, can deliver consistent outperformance when market beta falters. For investors accustomed to passive investing, this marks a paradigm shift toward skill-based approaches. Investing in a Low-ERP World A shrinking ERP requires investors to rethink their approach. Traditional market exposure, once the primary return driver, may no longer deliver. Instead, investors should prioritize alpha through systematic, evidence-based strategies: Factor Investing: Diversified exposure to factors like value, momentum, and low volatility can generate reliable alpha. Defensive equities, which tend to outperform in downturns, provide a cushion in volatile or sideways markets. Low-volatility strategies, for example, have historically delivered higher risk-adjusted returns during low-growth periods. Global Diversification: With Europe and emerging markets offering higher ERPs (still positive vs. the US’s near-zero), reallocating capital abroad can enhance returns. Small caps and equal-weighted strategies, often overlooked in favor of large-cap growth, also show promise due to their attractive valuations. Active Management: High-active-share or long-short strategies can capitalize on market inefficiencies, particularly in undervalued segments like small caps or low-volatility stocks. Active quant approaches, blending factor exposures with disciplined risk management, are well-suited to a low-ERP environment. A low-ERP world could reshape market dynamics. As investors chase alpha, capital may flow into factor-based strategies, potentially elevating valuations for these assets. The US’s market dominance, fueled by a high ERP over the past decade, may weaken as capital shifts to Europe, Asia, or small-cap markets. This could reverse the multi-decade trend toward passive investing, rewarding managers with proven alpha-generating skills. Moreover, a prolonged low-ERP environment may amplify the appeal of defensive strategies. Low-volatility and low-beta factors, which thrive in uncertainty, could attract significant inflows, offering stability in a market where positive returns are scarce. Investors who adapt early by embracing active quant strategies or diversifying globally stand to gain a competitive edge. Key Takeaway A declining ERP does not signal the end of investing; it demands a pivot to alpha-driven strategies. With US equity returns under pressure, systematic approaches like factor investing, defensive equities, and global diversification offer a path to resilient performance. In a zero-ERP world, alpha is not just a bonus; it’s the key to capital growth. As beta fades, alpha shines. For a deeper dive, read my full report. Pim van Vliet, PhD, is the author of High Returns from Low Risk: A Remarkable Stock Market Paradox, with Jan de Koning. Link to research papers by Pim van Vliet. References AQR. (2025). “2025 Capital market assumptions for major asset classes.” Available at www.aqr.com. Baltussen, G., Swinkels, L., & van Vliet, P. (2023). “Investing in deflation, inflation, and stagflation regimes,” Financial Analysts Journal, 79(3), 5–32. Blitz, D. (2023). “The cross-section of factor returns,” The Journal of Portfolio Management, 50(3), 74–89. Fandetti, M. (2024). “CAPE is high: Should you care?” Enterprising Investor. Available at www.cfainstitute.org. GMO. (2024). “Record highs…but we’re still excited.” Available at www.gmo.com. Kosowski, R. (2011).

When the Equity Premium Fades, Alpha Shines Read More »
Book Review: My Value Creation Journey

My Value Creation Journey: An Autobiography of My Work. Bartley J. Madden. ‎2023. Bartley J. Madden Foundation. My Value Creation Journey, by Bartley J. Madden, is a unique book that consists of a memoir, a primer on systems thinking and knowledge creation, and a call to reform the medical care system. Madden, a retired managing director of Credit Suisse HOLT and author of the 2020 book Value Creation Principles, spent more than three decades in finance. His early research produced the cash flow return on investment metric (CFROI), which is widely used in money management. Madden has now moved into the philanthropic world at the Bartley J. Madden Foundation. The book begins with Madden’s circuitous path to business and finance, which includes a degree in mechanical engineering, a brief foray into boxing, and a fortunate military deployment to Salt Lake City rather than Vietnam. After completing his military service, Madden earned an MBA from the University of California, Berkeley and began his finance career in 1969 in the investment research department at Continental Bank in Chicago. While there, he was introduced to a security analyst, Chuck Callard, with whom he would founded Callard, Madden & Associates six months later. The two of them went on to create the CFROI metric. My Value Creation Journey’s core focus is Madden’s quest to better understand knowledge-building proficiency. According to Madden, the key to value creation is knowledge building. Throughout the book, Madden emphasizes the role of systems thinking and the knowledge-building loop, which he finds useful in formulating economic/business problems and developing solutions. Madden depicts the knowledge-building loop as a circular diagram that includes systems thinking, asking better questions, and language. This approach allows the user to think creatively about a problem and formulate better solutions than those achieved through the more widely accepted linear thinking. Although language may seem like an odd part of knowledge building, Madden notes that language limits our perceptions. For example, he points out how the founders of Airbnb created a new industry by asking, “What is a hotel room?” Much of the book is devoted to how CEOs can use systems thinking to improve the performance of their businesses. These concepts, however, apply to all areas of life and business. For those in the investment business, recognizing companies led by leaders who foster a knowledge-building culture, such as Ken Iverson of Nucor, may be rewarded with market-beating returns. To illustrate the importance of CFROI, Madden reformulates the traditional life-cycle graph by linking the cost of capital to CFROI. The cycle begins with high innovation as the firm successfully commercializes its product and its economic returns exceed the cost of capital. Competitive fade occurs when competitors attempt to replicate or improve on the originator’s innovation. How quickly the competitive fade begins depends on the innovator’s competitive advantage. Firms then move to the mature stage, where they merely earn the cost of capital. Finally, business failure occurs when the firm can no longer earn the cost of capital. This pattern is inevitable unless management recognizes this pattern and seeks to reinvent itself. To illustrate these concepts, Madden presents several case studies of firms that extricated themselves from years of mature growth to enjoy value-enhancing returns. First, he presents a brief history of John Deere, the farm equipment maker, from 1960 to 2018. The company, which was founded in 1837 by blacksmith John Deere, spent some four decades, from 1960 to 2000, in the mature phase, with CFROI indicating that it was simply earning the cost of capital. Under the leadership of Robert Lane from 2000 to 2009 and Samuel Allen from 2010 to 2019, Deere embraced the digital world and transformed itself from a product-centric business focused on the firm’s products to a platform-centric business that helps farmers increase yield and reduce costs. These changes have allowed shareholders to enjoy a 20-fold increase in their stock price since 2000. Another case study examines Cummins, which designs, distributes, manufactures, and services diesel, electric, and hybrid powertrains and related components. From 1997 to 2003, Cummins was losing market share in the diesel engine market. In 2000, however, when Tim Solso became CEO, he successfully improved productivity and increased R&D expenditure. These changes allowed the firm to produce innovative diesel engines that met Environmental Protection Agency standards while maintaining fuel efficiency, giving the firm a competitive advantage over its peers. During Solso’s time as CEO, Cummins outperformed the S&P 500 Index approximately 10-fold. Madden points out that the naysayers believe Cummins will be overtaken by electric truck manufacturers, such as Tesla. He points out, however, that this conclusion springs from a flaw in linear thinking. Electric vehicles may be more environmentally friendly than diesel vehicles, but this ignores the environmental costs of electric generation, battery manufacturing, and the production of solar panels. One area where Madden hopes to use his knowledge-building approach to benefit society is reforming the Food and Drug Administration (FDA). Researchers at the Madden Center for Value Creation at Florida Atlantic University pursue many topics, including revising the FDA’s procedures. Madden has used his book Free to Choose Medicine: Better Drugs at Lower Cost and several articles to promote some of these ideas. He provides a detailed approach by which the FDA could change its procedures to allow potentially life-saving drugs to be administered to terminally ill patients. This would not be just a means of providing compassionate care. It would also facilitate collection of valuable information that might allow new drugs to receive full FDA approval sooner and provide a greater understanding of who would benefit most from the treatments. In summary, Madden has produced a book that challenges business leaders to think outside the box systematically. It is not a “how-to” book that provides detailed recipes for success. Instead, it provides a framework for thinking through difficult problems. Business leaders and investment professionals who can apply some of the concepts to their decision making will likely be rewarded. As the world continues to change, Madden’s insights

Book Review: My Value Creation Journey Read More »

Volatility Signals: Do Equities Forecast Bonds?

Surprise, surprise. Contrary to conventional wisdom, the bond market may be taking its risk cues from equities. At least, that appears to be the case when fluctuations in the two major volatility indices are compared. Equity investors often look to the CBOE Volatility Index (VIX) as a gauge of fear or future uncertainty in the stock market. Meanwhile, fixed-income investors rely on the Merrill Lynch Option Volatility Estimate (MOVE Index) to track expectations of future volatility in the bond market. But which market sets the tone for the other? Does one of these volatility measures lead the other, or are they simply reacting to distinct sources of risk within their own domains? Challenging Assumptions: Evidence That Equities Lead Bond To answer that question, we examined how the VIX and MOVE indices have interacted over time, using daily data going back to 2003. Our analysis revealed a surprising result: while fluctuations in the MOVE index do not predict movements in the VIX, changes in the VIX do help forecast future moves in the MOVE index. This flips conventional wisdom. Investors often assume that the bond market, with its sensitivity to interest rate expectations and macroeconomic signals, sets the tone for equities. But at least when it comes to market-implied future uncertainty, the relationship appears reversed: the bond market is taking its cues from stocks. To explore this, we looked at how the two indices behave together. Over the last 20 years, they’ve generally moved in tandem, particularly during periods of macroeconomic stress, with a 30-day rolling correlation that averaged around 0.59. But correlation isn’t causation. To test for a predictive relationship, we used Granger causality analysis, which helps determine whether one time series improves forecasts of another. In our case, the answer was clear: the VIX leads. Market Stress and Temporary Bond Leadership Interestingly, the pattern shifts during periods of elevated stress. When both the VIX and MOVE indices spike above their 75th percentile levels, indicating a high-volatility period, we observe a reversal: the MOVE index shows some predictive power over the VIX. In these moments, equities appear to take cues from bonds. While rare, this exception suggests that in times of acute uncertainty, the usual flow of information between markets can briefly reverse. One way to interpret these results is that because the MOVE index seems to take the lead during periods of extreme uncertainty, bond managers are more attune to huge macro shifts in the economy and capture big sentiment shifts better than equity managers (i.e., when we go from positive to negative momentum). Implications for Multi-Asset and Hedging Strategies These findings may have the most impact not for investors that invest solely in one asset, but more so for investors that are spread across various asset classes. The results highlight that for multi-asset managers, when it comes to assessing fear in the market, it may be best to pay attention to the bond market when big moves in fear or uncertainty become apparent. But when dealing with small movements in the perception of future uncertainty, the stock market may surprisingly be the better measure of risk to track. These results also have strong implications for investors who are not in the equity market or the debt market, yet use them to hedge risk. If a commodities trader is looking for early signs of big moves in the equity market or bond market to get out of commodities, they may want to shift their attention between the VIX and the MOVE indices as regimes move. These findings challenge a long-standing assumption: that the bond market always leads. At least when it comes to measuring future uncertainty, equities seem to set the tone, except, notably, in the most volatile moments, when bonds regain their influence. It appears that, in general, the bond market is looking more to the equity market for future assessments of risk rather than the other way around. These results merit further study, not just into which market is leading the other, but how this spillover of uncertainty travels between them. source

Volatility Signals: Do Equities Forecast Bonds? Read More »

Investment Returns Are NOT Random

There is notable disagreement among academics about how investment time horizon should affect portfolio allocations. In recent research released through CFA Institute Research Foundation, we explored this topic at length. We find that the assumption that returns are independent over time is inconsistent with historical evidence, both domestically and internationally across stocks, bonds, and alternatives. These findings suggest that investment professionals may need to re-think their portfolio optimization routines — including mean variance optimization (MVO) — which typically assume returns are random across time. This article is the first in a series of three. Here, we will provide context about how returns historically have evolved over time. In subsequent articles, we will describe what this means for equity portfolios and portfolios of real assets like commodities. Risk and Investment Horizon One commonly held belief among many investors and financial advisors is that the risk of certain asset classes, in particular equities, declines over longer investment periods, an effect commonly dubbed “time diversification.” Evidence provided to support this hypothesis is how the distribution of compounded returns tends to converge for longer investment horizons, as demonstrated in Exhibit 1, which is based on the returns of US equities from 1872 to 2023. Exhibit 1. The Distribution of Compounded Equity Returns by Investment Horizon 1872 to 2023. A key problem with this perspective is that investors should not focus on compounded returns. Rather, they should focus on compounded wealth. And compounded wealth tells a different story.  Using the same returns over the same period, Exhibit 2 includes how the distribution of wealth changes by investment horizon and there is clear evidence that it is diverging, not converging. Exhibit 2. The Distribution of Compounded Wealth by Investment Horizon for an Equity Investor 1872 to 2023. In reality, the risk of virtually all investments increases over time, when risk is defined as the increased dispersion in wealth. This perspective is consistent with options pricing models. While the risk of all investments is increasing, it is important to note that the rate of the increase could vary over time and this variance has important implications for investors with longer holding periods. If the relative risks of investments change by investment horizon, that would suggest some type of serial dependence is present, which means the returns evolve in a way that isn’t completely random. Previous research suggests that the return on an investment such as stocks is relatively random. This theory is perhaps best exemplified in Burton Malkiel’s book, A Random Walk Down Wall Street. But our research finds that autocorrelation exists.   In our paper, “Investment Horizon, Serial Correlation, and Better (Retirement) Portfolios,” we provide context around autocorrelation, or how past returns are related to future returns. We examine five US return series — bills, bonds, stocks, commodities, and inflation — using historical annual returns from 1872 to 2023, leveraging data from the Jordà-Schularick-Taylor (JST) dataset and the Bank of Canada. Exhibit 3 includes the coefficients from a series of ordinary least squares (OLS) regressions, where the dependent variable is the actual return for that calendar year, while the returns for the previous five calendar years are included as independent variables.  Historical returns for each asset class are re-centered, so they have an average return of zero and a standard deviation of one, to reduce any implications associated with historical differences in returns and risk levels. In other words, the regression is effectively based on the z-values of the historical time series returns. Negative coefficients are highlighted in blue, since this implies the risk of the asset declines over time because a positive return would be more likely to be followed by a negative return. Positive coefficients that are statistically significant, implying that the risk of the asset increases over time, are highlighted in red. Exhibit 3. Regression Coefficients for an Ordinary Least Squares (OLS) Regression, Where the Dependent Variable is the Current Calendar Year for the Asset Class 1872 to 2023. Back to Exhibit 1, there are several coefficients that are statistically significant, defined as a p value less than 0.05, which suggests the historical returns series is not truly independent across time.  Certain asset classes, such as bonds, have exhibited positive autocorrelation historically, while other asset classes, such as equities, have exhibited negative autocorrelation. This suggests that the longer-term risks of owning either asset could change due to the investment horizon. The relative risk of owning equities should decline compared to bonds, for example. Next, we look at how the risk of assets can change when considering inflation. For this analysis, we estimate the correlation between the cumulative growth in wealth and cumulative impact of inflation for different investment horizons for the same four asset classes. Exhibit 4. Historical Correlations in Wealth Growth for Various US Asset Classes by Investment Period 1872 to 2023. Inflation is often explicitly considered in certain types of optimizations (e.g., a “surplus” or liability-relative optimization). One potential issue when considering inflation, however, is that changes in the prices of goods or services do not necessarily move in sync with the changes in the financial markets. In other words, there could be lagged effects.  For example, while financial markets can experience sudden changes in value, inflation tends to take on more of a latent effect, where changes can be delayed and take years to manifest. Focusing on the correlation — or covariance — of inflation with a given asset class like equities over one-year periods may hide potential longer-term effects. The correlations of the four asset classes vary notably with inflation by different investment horizons. For example, a one-year investment horizon, which is a common time frame used for MVO assumptions, the correlations are relatively low for all asset classes, suggesting little potential hedging benefit. However, there are notable increases over a 10-year period that can at least be partially explained by positive drift for each asset. The correlation between commodities and inflation increases to 0.62, for example. The notable increase in correlations for bills and commodities is especially

Investment Returns Are NOT Random Read More »

ESG Fixed-Income Exposure: Index Providers Respond to Asset Manager Demand

What does the latest Index Industry Association (IIA) global membership survey reveal about current trends in indexes and benchmarks? Chief among the key data points is that the rapid expansion of environmental, social, and governance (ESG) indexes continues to gain momentum and diversify across asset classes. The 2022 survey found the number of ESG indexes grew by 55%, with fixed-income–focused ESG indexes and benchmarks taking the lead in driving that growth. The IIA has queried its members for the last six years to better understand how the landscape of indexes and benchmarks is evolving. Our annual global benchmark surveys gather member data about the indexes administered across identified asset classes and geographies — global, the Americas, Europe, and Asia. IIA members now administer over three million indexes, with equity indexes comprising 76% of the global total. With only about 11,000 global exchange traded products (ETPs), benchmarking is still the primary use case of indexes today. The IIA’s most recent global asset managers report revealed increased demand for ESG fixed-income indexes, and index providers have responded. The number of ESG fixed-income indexes has increased 95.8% and for the first time surpassed the number of ESG equity indexes, despite the latter growing by 24.2%. There are now more than 50,000 ESG benchmarks worldwide. Growth of Global ESG Indexes Among the various index categories, global ESG fixed income grew the fastest, expanding by 122.5%. European fixed-income ESG saw the second largest percentage increase, at 92.5%. This spike tracks with findings from our previous report: Asset managers indicated that fixed income is now the fastest-growing ESG asset class. Indeed, 76% of asset managers implemented ESG criteria within fixed income this year, up from 42% in last year’s survey. This has been an ongoing trend in recent years. As investors gain access to new and better data, there is a greater push to define ESG in fixed income. The growth rate of fixed-income indexes outpaced that of their equity counterparts for the third straight year, increasing by 4.5% compared with 4.3%. Within the non-ESG fixed-income category, municipal bond indexes grew by 10.9%, while the distribution across other categories remained stable. Growth of Global Fixed-Income and Equity Indexes Why is all this important to investors? The research and development that go into benchmarks and indexes eventually find their way back to the end investor. This year’s results highlight a chain reaction: With better ESG data, index providers create better benchmarks to track the market. This gives asset managers the tools to create better investable products. In turn, investors have more confidence that their investments are meeting their expectations. Our findings also revealed a larger misperception about equity indexes. Contrary to popular belief, the Americas does not dominate the total number of equity indexes. The region actually has the smallest percentage of equity indexes across the three geographies surveyed. But our survey does show that the Americas is leading the way in creating new fixed-income indexes. The market has the largest percentage of fixed-income indexes, with more securitized benchmarks and high-yield and municipal bond indexes than all the other regions. This development notwithstanding, the distribution of indexes across regions has remained stable and consistent over the last several years. Whether these trends gather increased momentum or start to tail off will be something we will be watching in the year ahead. If you liked this post, don’t forget to subscribe to the Enterprising Investor All posts are the opinion of the author. As such, they should not be construed as investment advice, nor do the opinions expressed necessarily reflect the views of CFA Institute or the author’s employer. Image credit: ©Getty Images/ champc Professional Learning for CFA Institute Members CFA Institute members are empowered to self-determine and self-report professional learning (PL) credits earned, including content on Enterprising Investor. Members can record credits easily using their online PL tracker. source

ESG Fixed-Income Exposure: Index Providers Respond to Asset Manager Demand Read More »

Sustainability Reporting: Navigating Assurance Practices

Sustainability metrics and disclosures have attracted significant attention globally. Yet, assurance practices vary in the amount of work performed and investors may be lulled into a false sense of security by the word “assurance.” The voluntary nature of sustainability reporting has led to fragmented practices and concerns about greenwashing, prompting recent regulatory actions such as the European Union (EU) Corporate Sustainability Reporting Directive (CSRD) and the climate-related disclosure rule for U.S. Securities and Exchange Commission (SEC) registrants. Investors and other stakeholders increasingly rely on sustainability information for decision-making given the rise of environmental, social, and governance (ESG) considerations. Naturally, this has increased demand for external assurance, even in the absence of regulatory requirements. For instance, the Center for Audit Quality noted that in 2021, 320 of the S&P 500 companies voluntarily purchased assurance services for some of their sustainability information. However, these assurance practices vary in the level of assurance provided. The two common levels are “limited” and “reasonable.” So, what do they cover, and what sets them apart? Assurance of Sustainability Reports: What is Covered? Sustainability reports cover a wide range of topics, from environmental impacts to employee diversity, to governance oversight. They often communicate trends and key takeaways in the form of figures and tables. Notably, sustainability assurance engagements do not automatically cover all the information disclosed in a sustainability report. To understand what is assured within a sustainability report, one must refer to the accompanying assurance report. The assurance report may be included in the sustainability report, or it may be available through referenced links (e.g., on the company’s website). The assurance report should explicitly identify what is subject to assurance. For instance, the assurance report for the 2023 Sustainability Report of Siemens Healthineers states: “We have performed a limited assurance engagement on the disclosures marked with the [check mark] symbol (hereafter the “disclosures”) in the Sustainability Report of Siemens Healthineers AG.” But the assurance statements for Coca-Cola’s 2022 Business and Sustainability Report have appendices listing the indicators that were subject to assurance. The assurance report should also disclose the criteria against which the sustainability information is evaluated. For Siemens Healthineers, the criteria are the Global Reporting Initiative standards. For Coca-Cola, the criteria are also listed in the appendices and include company-specific manuals. Particularly in cases like the Coca-Cola example, investors are encouraged to go to the appendices and determine whether the chosen criteria seem reasonable given company-specific business operations. In the absence of specific regulatory requirements, companies can opt for either limited or reasonable assurance services. Limited assurance and reasonable assurance represent different levels of confidence in the accuracy of reported information. What is Reasonable Assurance? Reasonable assurance is akin to what most investors may be familiar with from financial audits. It provides the highest level of assurance. The assurance provider reduces the risk that the sustainability information is materially misstated to a predefined acceptably low level, though never to zero. Importantly, despite being the highest form of assurance service offered, reasonable assurance does not provide absolute certainty. The assurance provider does not guarantee that all possible errors or fraud indicators are detected. Because the assurance engagement provides only “reasonable” assurance, the procedures are performed on a test basis. This means that the assurance provider draws samples and uses analytics to identify specific transactions or estimates that warrant further testing. Testing may involve tracing evidence to supporting documents, confirming information with third parties or legal providers, consulting specialists to verify the reasonableness of assumptions made in estimates or calculations, and conducting on-site testing. It also includes gaining an in-depth understanding of the processes used by management to prepare the disclosures and testing the accuracy of data processed by information technology systems and manual spreadsheets. Finally, the assurance provider will evaluate whether the procedures identified any errors or misstatements. To determine whether management needs to correct these errors or misstatements before the publication of the sustainability report, the assurance provider uses a predefined materiality threshold, which may or may not be disclosed in the assurance report. If the total effect of the identified errors or misstatements is below the predefined materiality threshold, the assurance provider can sign off without additional disclosure about the identified issues because they are deemed less than material. The conclusion in a reasonable assurance engagement report is expressed in a positive form, as exemplified by the 2022/2023 ESG Report of GUESS: “Our responsibility is to express an opinion on Management’s Assertion based on our examination. […] We believe that the evidence we obtained is sufficient and appropriate to provide a reasonable basis for our opinion. […] In our opinion, Management’s Assertion related to the Key ESG Metrics and Disclosures as of and for the year ended January 29, 2022, and January 28, 2023, is fairly stated, in all material respects.” Depending on the assurance standard used, the assurance provider will likely use the term “examination” or “audit” to describe the reasonable assurance engagement. What is Limited Assurance? In a limited assurance engagement, the assurance provider still aims to perform procedures that reduce the risk that the sustainability information is materially misstated. However, the accepted level of risk of material misstatement is higher compared to reasonable assurance engagements. The procedures performed are limited in nature compared to those in reasonable assurance engagements. For instance, in the 2022 Greenhouse Gas (GHG) Emissions Assurance Statement of Coca-Cola, the assurance provider states: “The procedures we performed were based on our professional judgment. Our review consisted principally of applying analytical procedures, making inquiries of persons responsible for the subject matter, obtaining an understanding of the data management systems and processes used to generate, aggregate, and report the Subject Matter [i.e., selected GHG emission indicators] and performing such other procedures as we considered necessary in the circumstances.” The conclusion in a limited assurance engagement report is expressed in a negative form. In the case of Coca-Cola, it reads: “Our responsibility is to express a conclusion on the Subject Matter [i.e., selected GHG emission indicators] based on our review.

Sustainability Reporting: Navigating Assurance Practices Read More »

The Nuts and Bolts of Private Commercial Real Estate (CRE) Investing

A CRE Investing Primer Real estate investing means different things to different people. It can be shorthand for buying a rental property — taking out a mortgage, finding a renter, and hoping to clear the monthly cost while the asset appreciates. It can also mean buying shares in a public real estate investing trust (REIT), the kind that has been around for decades and is accessible through most brokerage accounts. But real estate as an asset class is much more diverse than that. Broadly speaking, commercial real estate (CRE) may refer to many different types of property, investment theses, and risk/return profiles. Fintech-enabled investing has made private-market CRE as accessible as stocks and index funds, albeit at a higher minimum investment. Indeed, private-market CRE investing and REITs also both offer the benefit of (divisible) passive investing — no “tenants and toilets” as they say. What Is CRE Investing? CRE is any real estate investment or transaction undertaken by a professional investor. The term “commercial” can also denote multi-tenant, including multifamily. Because of CRE properties’ size and operational complexity, CRE transactions tend to involve multiple parties and offer alpha opportunities. In principle, two factors drive CRE returns: rent and appreciation. Hence, CRE is one of the few asset classes that can deliver both solid cash flow and solid total return potential. Following the JOBS Act of 2012, CRE syndication developed with various platforms providing a nexus between real estate investment firms, or sponsors, and networks of individual investors. These investors could passively invest in CRE with substantially lower, divisible barriers to entry. Access to private CRE investing has thus expanded dramatically over the past decade. This CRE series for Enterprising Investor is written for the individual investor who may be, for the first time, participating in private CRE as a passive LP investor through an online platform. So, what are the potential benefits of private-market CRE investing relative to other forms of real estate investing? Information asymmetry, geographic barriers to entry, and other private market inefficiencies give sponsors/CRE operators more opportunity to enter or exit a given investment at a favorable moment on favorable terms. Common Types of CRE Investments The four main CRE sectors, or sub-asset classes, are Multifamily, Office, Retail, and Industrial. A variety of other sub-asset classes, such as lodging, self-storage, data centers, and more exotic variants (e.g., communication towers) are CRE’s “niche” sectors. Of course, as time progresses, real estate operators innovate and expectations from tenants evolve. Macroeconomic shocks such as the COVID-19 pandemic create new demands on the built environment. As such, the lines between CRE property types may blur, and new sub-asset classes like medical office buildings (MOB) may emerge. On an institutional scale, certain properties may be mixed use, comprising any combination of residential/office, lodging, and retail. Because the investment thesis tends to be straightforward, and the underlying function is so essential, Multifamily tends to dominate online CRE investing platforms. CRE transactions involve debt — which is analogous to a mortgage for a single-family property — as well as equity, which is analogous to the owned portion of a home that grows in value as the asset appreciates. Due to the size and complexity of CRE transactions, there is often a middle layer of financing: subordinated (mezzanine debt), preferred equity, or both. The capital stack is the combination of financing instruments for any one CRE transaction. CRE investors may participate anywhere in the capital stack and tend to access such opportunities through online platforms, with common equity positions the most prevalent. In general, the more senior the position on the capital stack — debt, for example — the less risk and return potential. Debt-based CRE investments tend to mean less risk because of payment priority, contractually obligated rates of return, and shorter terms. The more junior the position in the capital stack — equity, for example — the more risk and return potential. How to Evaluate CRE Investment Opportunities The position in the capital stack and the investment style are important parameters in judging the risk/return profile of a given CRE investment. There are four main investment styles with specific risk/return profiles: Core are stabilized, cash-flowing properties that are more than 90% leased and generally operating optimally at top-of-market rates. Such properties do not require significant upgrades and tend to be located in primary markets with strong fundamentals. Most returns come from cash flow rather than value appreciation, so Core is among the least risky CRE investment styles. As such, Core investments tend to have longer hold periods and capitalize on the bond-like operational cash flow. Assets are generally conservatively levered, yielding the lowest total return potential, with a 5% to 8% internal rate of return (IRR) range netted out to passive LP investors. Core Plus are usually in primary and secondary markets and are near-stabilization in terms of leasing, at or near market rates. To increase occupancy, tenant quality, and rates, Core Plus properties may require light capital expenditure. The strategy is riskier than Core since operational cash flow is more volatile, but it is still a relatively stable and predictable strategy, yielding a total return in the 8% to 12% IRR range. Value Add are located in primary, secondary, and tertiary markets, and expanding to such niche asset classes as hotels, health care properties, etc. These properties often lease at large discounts to market rates, providing a mark-to-market opportunity to reset rents during re-leasing. Major upgrades to both interior and common areas — capital expenditures — may be needed to compete for renters/tenants, drive rents to market rates, and achieve market occupancy. Value Add relies less on generating steady operational cash flows and more on property appreciation as a key total return driver. Total returns tend to fall in the 10% to 18% IRR range. Opportunistic occupies the opposite end of the spectrum from Core. Property appreciation rather than operational cash flow drives performance. Often associated with ground-up development, substantial redevelopment, or a complete repositioning of a property, these opportunities are often highly levered

The Nuts and Bolts of Private Commercial Real Estate (CRE) Investing Read More »

Vanguard’s Former OCIO Clients Must Stand Their Ground

“Those who stand for nothing fall for anything.” Alexander Hamilton, first US Secretary of the Treasury In Act 1, Scene 2 of William Shakespeare’s play, Julius Caesar, a soothsayer warned Caesar to, “Beware the Ides of March.” But Caesar failed to heed this advice, and he was assassinated on March 15th in the year BCE 44. More than 400 years after Shakespeare penned this phrase, people still associate the Ides of March with impending doom. Vanguard’s former OCIO clients would be wise to follow this tradition. Trustees Are no Longer Protected by the Spirit of Jack Bogle On March 15, Mercer, a division of Marsh McLennan, completed its acquisition of Vanguard’s outsourced chief investment officer (OCIO) business. Most of the Vanguard clients who are moving over to Mercer are large institutions including endowments, foundations, and nonprofits. The transaction seemed odd to me, given that Mercer’s traditional investment consulting and OCIO services have a penchant for active managers and alternative investments. My fear is that Vanguard’s propensity for low-cost index funds over higher-fee active funds and expensive alternative investments will not survive in its OCIO practice under Mercer. In a  June 4 interview with Pensions & Investments (P&I), Mercer’s US CIO Olaolu Aganga noted that Vanguard’s OCIO clients will have access to the full spectrum of passive and active strategies on Mercer’s platform, including alternative investments. In her interview with P&I, she stressed Mercer’s breadth and depth of offerings in the form of fund of funds including real estate, private credit, infrastructure, private equity and secondaries, as well as co-investments and venture capital. The problem I have with this is that there is a preponderance of evidence – which many investors continue to reject – that very few active managers are capable of consistently outperforming inexpensive index funds. There is similar evidence that alternative investments do not add value to institutional portfolios. It especially concerned me when Aganga called out hedge funds specifically as another opportunity now opened to Vanguard OCIO clients, despite the overwhelming evidence that hedge funds are not beneficial for most institutional investors. Adding to my concern is the fact that, in my experience, when OCIOs and investment consultants present trustees with “new opportunities,” they routinely frame them in a way that overstates the benefits, understates the risks, discounts the skills required to succeed, and all but ignore incrementally higher costs. A Brief History of Vanguard Index Funds In 1976, Jack Bogle, founder of the Vanguard Group, launched the Vanguard 500 Index Fund. Unlike every other mutual fund at the time, the fund’s objective was to simply replicate the performance of the S&P 500 index. This was a highly unconventional approach, even though it conformed with well-established mathematical principles and supporting evidence that most active managers are unlikely to outperform a comparable index. In fact, only a few years earlier, Eugene Fama published a groundbreaking paper on the efficient market hypothesis (EMH). Fama presented a compelling case that securities prices incorporate all publicly available information, thus preventing investors from identifying and profiting from mispriced securities. This implied that investing in low-cost funds was the most sensible approach for nearly all investors. The Vanguard Group was the first to commercialize the index fund on a large scale. Starting with only $11 million in 1976, the fund grew rapidly. Over time, its performance validated the EMH: most actively managed funds failed to keep pace with the Vanguard 500 Index Fund. Building on its success, Vanguard soon applied the indexing philosophy in other securities markets including fixed income, international equity, and real estate investment trusts (REITs). Results were predictably similar. Something Old and Something New: The Outsourced Chief Investment Officer “Financial operations do not lend themselves to innovation. What is recurrently so described is, without exception, a small variation on an established design, one that owes its distinctive character to the aforementioned brevity of financial memory. The world of finance hails the invention of the wheel over and over again, often in a slightly more unstable version.” John Kenneth Galbraith, financial historian In the early 2000s, a new investment advisory model took the institutional investment plan market by storm. The model, referred to as an OCIO, was, in the words of John Kenneth Galbraith, “a small variation on an established design.” The variation was the creation of complex portfolios that relied heavily on active managers and allocations to alternative investments, such as private equity, hedge funds, and venture capital. The rationale for this approach was based largely on the exceptional performance of the Yale University Endowment. OCIOs argued that replicating Yale’s allocation would likely produce similar results. The “established design” was simply the concept of discretionary management. Prior to the emergence of OCIOs, institutional investment plan trustees relied primarily on non-discretionary advice offered by investment consulting firms. The reintroduction of discretionary management seemed like a novelty only because few trustees recalled that consulting firms persuaded them to abandon it in the 1970s and 1980s. At the time, consulting firms were hired to provide independent performance reporting, and their reports revealed that discretionary advisory services offered by bank asset management departments failed to provide sufficient value to justify the higher fees. Despite the history, many trustees bought into the OCIO concept because they believed that the higher fees were justified by the superior, Yale-like strategies that OCIOs offered. Few trustees understood that the real secret of Yale’s success was not simply a function of a blunt asset allocation strategy. Instead, it was the presence of a unique investment ecosystem that combined excellence in governance, people management, mentorship, and access. The essential replication of this ecosystem was conveniently absent from OCIO sales pitches. Over the last 24 years, assets under management (AUM) of OCIOs increased from almost nothing to nearly $2 trillion at the end of 2023. As is always the case, rapid growth attracted many new market entrants. Investment teams at large endowments left to launch new firms such as Investure, Global Endowment Management, Morgan Creek, and others. Investment consulting firms

Vanguard’s Former OCIO Clients Must Stand Their Ground Read More »

Equity Income Investing Redux

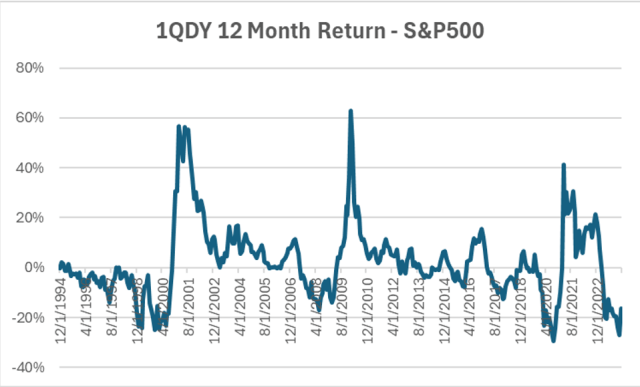
The last 12 months have been difficult for equity income investors. The top 20% of dividend-paying stocks in the S&P 500 Index have returned 13.5% in the 12 months through March. That compares to a 29.9% return for the broader S&P 500. My message to equity income investors is: hang in there. High-yielding stocks are positioned to perform better over the next year. History, inherent biases, mean reversion, and the current market backdrop point to a comeback. Figure 1: Top Quintile of Dividend Yield As of 03/31/24; Note: 1QDY or Top Quintile of Dividend Yield. Source: S&P, Bloomberg & Wealth Enhancement Group Over the long term, buying high-yielding stocks has been a sound strategy. During the past 30 years, the highest quintile of dividend-paying stocks in the S&P 500 (20%, or 100 equities) has outperformed. From December 31, 1994, through March 31, 2024, stocks in the top quintile returned 11.9% per year. Over the same period, the S&P 500 returned 10.4% per year. That is a 1.5% premium for high-yielding stocks. While the top quintile of dividend-paying stocks is more volatile than the broader S&P 500, it has a similar Sharpe Ratio and, by design, it has a much higher dividend yield. An equity income strategy is often categorized as a value strategy because it tends to favor lower price-to-book stocks. The top dividend-paying stocks have also outperformed the Russell 1000 Value Index over the 1994 to 2024 period. Volatility in the top-yielding stocks is, not surprisingly, higher since this assumes a one-factor model. Adding a metric for dividend growth to avoid distressed companies at risk of cutting their dividend would be beneficial, but the focus of this piece is just yield. Figure 2: Top Quintile of Dividend Yield, With Equally Weighted Stocks A sector-neutral strategy has also outperformed the S&P500 and Russell 1000 Value indices over the past 20 years, but to a smaller degree. Understandably, some sectors perform better with this strategy than others, depending in part on the level of high-yielding stocks in the sector. For example, the industrial and financial sectors perform well in a sector-neutral strategy, while the consumer discretionary and technology sectors do not. Why Have High-Yielding Stocks Outperformed? There may be a few reasons for the historical outperformance of high-yielding stocks. First, behavioral economists have shown many investors who want a source of income prefer automatic dividends, rather than home-made dividends achieved by selling a holding. Second, Benjamin Graham pointed out that paying dividends disciplines company management to generate attractive returns while allocating capital wisely. In other words, management agency costs are lowered.  Third, unqualified dividends have a higher tax rate than capital gains and therefore should theoretically be associated with higher returns to compensate equity holders.  Finally, we would suggest that many investors who focus on a stock’s exciting  growth story and pay little attention to dull dividends paid through profits and cashflow are likely manifesting a narrow framing bias. To wit, price targets are routinely made by assigning a multiple to earnings. These targets cite growth with faint consideration to return on capital, which is an equally important ingredient to valuation multiples. Naturally, an all-encompassing discounted cash flow model or a dividend discount model valuation is best. The outlook for dividend-paying stocks is favorable. Just using a reversion to the mean framework points to upside. Over the last 30 calendar years, the correlation of the one-year forward return to the previous year has been -0.3 for the highest quintile of dividend-paying stocks in the S&P 500. A Mechanical Reversion to the Mean Exercise Knowing that 2023’s return was 6.9%, the 30-year average return was 11.9%, and the 30-year correlation was -0.3, we can naively forecast a 2024 return of 13.5% [-0.3 (6.9%-11.9%) + 11.9%]. A return closer to the mean. A similar calculation can be done for the S&P 500 to project a 10.0% 2024 return.  This mechanical reversion to the mean exercise points to high-yielding stocks outperforming this year. However, it is very important to consider which average to revert toward. Two key fundamental metrics are return on assets (ROA) and earnings growth. Over the last 30 years, the top quintile of dividend paying stocks in the S&P 500 averaged a 4.4% ROA and had an 8.1% one-year forward earnings-per-share (EPS) growth estimate. Currently, their ROA is 3.6%. After bottoming a year ago at 2.5%, one-year forward EPS growth is now projected to be 11.9%. With ROA just below average and expected EPS growth above average, underlying fundamentals are now close to normal, which points to the 30-year mean return of 11.9% as a reasonable bogey for reversion. Going a step further to calibrate the outlook for dividend stocks, we can model returns against several variables. Two of the better factors to forecast one-year forward returns of the top quintile dividend stocks in the S&P 500 are dividend yield and year-over-year CPI (consumer price index). The former series is a valuation yardstick and the latter is a rough proxy for rates. Both metrics are correlated to one-year forward dividend returns.  Currently, the dividend yield of the top quintile of dividend-paying stocks is at its 20-year average, while YoY CPI is above average and has been declining (see Figure 2).  If the consensus expectation that YoY CPI will continue to decline over the next year is correct, dividend-paying stocks will benefit. Figure 3: Dividend Yield, CPI, and 12-Month Returns As of 03/31/24; Note: 1QDY or Top Quintile of Dividend Yield. Source: S&P, Bloomberg & Wealth Enhancement Group While equity income investors have had a rough patch, it has been brief in the context of the historical performance of dividend-paying stocks. I will repeat my message to investors seeking equity income: hang in there. History, inherent biases, mean reversion, and the current market backdrop point to a comeback. If you liked this post, don’t forget to subscribe to Enterprising Investor. All posts are the opinion of the author. As such, they should not be construed as investment advice, nor do the opinions expressed necessarily reflect the views of CFA Institute or the author’s

Equity Income Investing Redux Read More »

Cochrane and Coleman: The Fiscal Theory of the Price Level and Inflation Episodes

“The current inflation episode is just the kind of event that the fiscal theory of the price level can easily describe. It’s simple. The US government printed up about $3 trillion of money and sent people checks. It borrowed an additional $2 trillion of money and sent people more checks.” — John H. Cochrane, Senior Fellow, Hoover Institution, Stanford University “The fiscal theory, I think, is the right way to approach monetary issues and inflation. I don’t think it’s well accepted. It’s not what central bankers or a lot of academic economists adhere to . . . It’s also a heretical view. It happens to be the right one. But it’s still an uphill battle.” — Thomas S. Coleman, Senior Lecturer, Harris School of Public Policy, University of Chicago John H. Cochrane submitted his book about the fiscal theory of the price level (FTPL) to the publisher, Princeton University Press, early last year. Up to that point, despite massive fiscal and monetary stimulus in response to the global financial crisis (GFC) and more recently amid the COVID-19 pandemic, inflation had remained at or near historical lows for the better part of a generation. This all seemed to fly in the face of the conventional understanding of both inflation and monetary policy. Viewed from a classical or monetarist perspective, real interest rates stuck at zero and quantitative easing (QE) stimulus should have had some effect: Whether hyperinflation or a deflationary spiral, theory dictated extreme consequences. Yet there weren’t any — no deflation spiral or a rerun of the epic stagflation of the late 1970s and early 1980s. Modern monetary theory (MMT) was on the ascent. Inflation hawks perhaps had sounded too many false alarms to be taken seriously. Indeed, in the opening months of 2021, inflation fears had come to be seen as almost anachronistic, the relic of an earlier and increasingly irrelevant era. “Well, inflation seems stuck at 2%,” Cochrane recalled writing in the initial introduction to his book. “And for 30 years, nobody has really cared about it. Maybe someday somebody will care about this book.” Of course, several months later, inflation soared to 40-year highs and stayed there. And for those looking to understand the resurgent and unfamiliar phenomenon, the FTPL model became critical. “I’ll just say I got the opportunity to revise that introduction,” Cochrane remarked. In May 2022, Cochrane and Thomas S. Coleman, co-author of Puzzles of Inflation, Money, and Debt: Applying the Fiscal Theory of the Price Level from the CFA Institute Research Foundation, spoke with Rhodri Preece, CFA, and Olivier Fines, CFA, who are, respectively, senior head of research and head of advocacy and capital markets policy research for Europe, the Middle East, and Africa (EMEA) at CFA Institute. The lines of inquiry, informed by insights from “Covid-19, One Year Later: Capital Markets Entering Uncharted Waters” and “Money in Covid Times: A Primer on Central Bank Response Measures to COVID-19,” zeroed in on the dynamics and rationale of the FTPL theory as well as the associated implications for the inflation outlook, fiscal and monetary policy, and the markets in general. In this first excerpt in the multi-part FTPL series, the conversation centers around the nature of inflation and how the FTPL can explain both the current late-pandemic inflationary environment and its non-inflationary post-GFC predecessor as well as other historical episodes. What follows is an edited and condensed transcript from our discussion. Olivier Fines, CFA: The Bank of England has indicated that they wouldn’t be surprised if inflation reached 10% before the end of the year. So, inflation is a global phenomenon, or at least a Western one. What are the fundamental aspects of the fiscal theory of the price level and how does it explain the current rate of inflation? John H. Cochrane: It is a simple and intuitive idea. Inflation breaks out when there is more overall government debt than people think the government will repay by its future excess of taxes over spending. If people see that the debt is not going to get repaid, that means it will either be defaulted on or inflated away in the future. They try to get rid of the government debt now. And the only way to get rid of government debt is to spend it, to try to trade it for goods and services. But it’s a hot potato. There’s so much of it around; we can’t get collectively rid of it. All we can do is drive up prices. First, we try to buy assets. The asset prices go up. Then, feeling wealthier, we try to buy goods and services. The goods and services prices go up until the real value of the debt — the amount of debt divided by the price level is its real value — is back to equal what people think the government will be able to pay off. That’s the fiscal theory of the price level in a nutshell. It’s still too much money chasing too few goods. But money includes all nominal government debt, not just money itself. The current inflation episode is just the kind of event that the fiscal theory of the price level can easily describe. It’s simple. The US government printed up about $3 trillion of money and sent people checks. It borrowed an additional $2 trillion of money and sent people more checks. That’s a big increase in the amount of government debt. Now, that doesn’t have to be inflationary if everybody understands this is borrowing that will be repaid. We’re going to send people checks, but by the way, there’s going to be either higher taxes or lower spending coming soon to repay that debt. Then people are happy to hold the debt as an investment vehicle. We can talk about government borrowing crowding out investment, and other smaller issues, but borrowing by itself isn’t instantly inflationary. Sending people checks is a particularly powerful way of getting them to spend the new debt rather than hold it as savings. Milton Friedman

Cochrane and Coleman: The Fiscal Theory of the Price Level and Inflation Episodes Read More »