CFA Institute

Commodities for the Long Run?

If you focus only on returns and covariances over a one-year investment horizon, you may conclude that commodities have no place in an investment portfolio. The efficiency of commodities improves dramatically over longer investment horizons, however, especially when using expected returns and maintaining historical serial dependencies. We’ll demonstrate how allocations to commodities can change across investment horizon, especially when considering inflation. Our analysis suggests that investment professionals may need to take a more nuanced view of certain investments, especially real assets like commodities, when building portfolios. This is the third in a series of posts about our CFA Institute Research Foundation paper. First, we demonstrated that serial correlation is present in various asset classes historically. Second, we discussed how the risk of equities can change according to investment horizon. Historical Inefficiency of Commodities Real assets such as commodities are often viewed as being inefficient within a larger opportunity set of choices and therefore commonly receive little (or no) allocation in common portfolio optimization routines like mean variance optimization (MVO). The historical inefficiency of commodities is documented in Exhibit 1, which includes the historical annualized returns for US cash, US bonds, US equities, and commodities from 1870 to 2023. The primary returns for US cash, US bonds, and US equities were obtained from the Jordà-Schularick-Taylor (JST) Macrohistory Database from 1872 (the earliest year the complete dataset is available) to 2020 (the last year available). We used the Ibbotson SBBI series for returns thereafter. The commodity return series uses returns from Bank of Canada Commodity Price Index (BCPI) from 1872 to 1969 and the S&P GSCI Index from 1970 to 2023. The BCPI is a chain Fisher price index of the spot or transaction prices in US dollars of 26 commodities produced in Canada and sold in world markets. The GSCI — the first major investable commodity index — is broad-based and production weighted to represent the global commodity market beta. We selected the GSCI due to its long history, similar component weights to the BCPI, and the fact that there are several publicly available investment products that can be used to roughly track its performance. These include the iShares exchange traded fund (ETF) GSG, which has an inception date of July 10, 2006. We used the two commodity index proxies primarily because of data availability (e.g., returns going back to 1872) and familiarity. The results from the analysis should be viewed with these limitations in mind. Exhibit 1. Historical Standard Deviation and Geometric Returns for Asset Classes: 1872-2023. Source: Jordà-Schularick-Taylor (JST) Macrohistory Database. Bank of Canada. Morningstar Direct. Authors’ calculations. Commodities appear to be incredibly inefficient when compared to bills, bonds, and equities. For example, commodities have a lower return than bills or bonds, but significantly more risk. Alternatively, commodities have the same approximate annual standard deviation as equities, but the return is approximately 600 basis points (bps) lower. Based entirely on these values, allocations to commodities would be low in most optimization frameworks. What this perspective ignores, though, is the potential long-term benefits of owning commodities, especially during periods of higher inflation. Exhibit 2 includes information about the average returns for bills, bonds, equities, and commodities, during different inflationary environments. Exhibit 2. Average Return for Asset Classes in Different Inflationary Environments: 1872-2023. Source: Jordà-Schularick-Taylor (JST) Macrohistory Database. Bank of Canada. Morningstar Direct. Authors’ calculations. Data as of December 31, 2023. We can see that while commodities have had low returns when inflation is low, they have outperformed dramatically when inflation is high. The correlation of commodities to inflation increases notably over longer investment horizons, increasing from approximately 0.2 for one-year periods to 0.6 for 10-year periods. In contrast, the correlation of equities to inflation is only approximately -0.1 for one-year periods and approximately 0.2 for 10-year periods. In other words, focusing on the longer-term benefits of owning commodities and explicitly considering inflation could dramatically change the perceived efficiency in a portfolio optimization routine. Listen to my conversation with Mike Wallberg, CFA: Allocating to Commodities While inflation can be explicitly considered in certain types of optimizations, such as “surplus” or liability-relative optimizations, one potential issue with these models is that changes in the prices of goods or services do not necessarily move in sync with the changes in financial markets. There could be lagged effects. For example, while financial markets can experience sudden changes in value, inflation tends to take on more of a latent effect: changes can be delayed and take years to manifest. Focusing on the correlation (or covariance) of inflation with a given asset class like equities over one-year periods (e.g., calendar years) may hide potential longer-term benefits. To determine how optimal allocations to commodities would have varied by investment horizon, we performed a series of portfolio optimizations for one- to 10-year investment horizons, in one-year increments. Optimal allocations were determined using a Constant Relative Risk Aversion (CRRA), which adjusts for risk the cumulative growth in wealth over a given investment horizon. Optimal allocations corresponding to equity allocations from 5% to 100%, in 5% increments, were determined based on target risk aversion levels. We included four asset classes in the portfolio optimizations: bills, bonds, equities, and commodities. Exhibit 3 includes the optimal allocations to commodities for each of the scenarios considered. Exhibit 3. Optimal Allocation to Commodities by Wealth Definition, Equity Risk Target, and Investment Period: 1872-2023. The allocation to commodities remained at approximately zero for virtually all equity allocation targets when wealth was defined in nominal returns (Panel A). On the other hand, when wealth was defined in real terms (i.e., including inflation), the allocations proved to be relatively significant over longer investment periods (Panel B). That was especially true for investors targeting moderately conservative portfolios (e.g., ~40% equity allocations), where optimal allocations to commodities would be roughly 20%. In other words, the perceived historical benefits of allocating to commodities have varied significantly depending on the definition of wealth (nominal versus real) and the assumed investment period (e.g., moving from one year to 10 years).  Forward-looking expectations for

Commodities for the Long Run? Read More »

Book Review: Poor Charlie’s Almanack

Poor Charlie’s Almanack: The Essential Wit and Wisdom of Charles T. Munger. 2023. Edited by Peter D. Kaufman. Stripe Press. There is no shortage of advice to improve our diets. There is an “expert” for every taste: from doctors and dieticians to members of Congress (who in 2011 defined pizza as a vegetable) and social media influencers. Food companies add their own voices. The cornucopia of competing guidance overwhelms, but common sense and wisdom from our elders can guide us to the best choices. There is no shortage of guidance to improve our investment returns, either. The late Charlie Munger —longtime vice chair of Berkshire Hathaway — offers his own recipe for investment success, and it is very much like the dietary common sense that informed mealtimes a few decades ago. In Poor Charlie’s Almanack: The Essential Wit and Wisdom of Charles T. Munger, Munger dishes out folksy wisdom about values and valuation accumulated over almost a century. His examples are punctuated with memorable phrases, such as the utility of “a one-legged man in an a**-kicking contest” and a man who owns only a hammer and to whom every problem looks like a nail. While Munger, who died 28 November 2023, knew the ingredients for success, he was quick to dismiss the physics envy and false precision of financial experts, as well as the efficient market hypothesis, which supposes the immediate incorporation of new information into the market prices of securities. How, after all, can we explain his and Berkshire partner Warren Buffett’s incredible and enduring investment success if the market is perfectly efficient or if success requires ever-increasing computing power? (Astute readers will recognize, however, that Berkshire uses leverage and has investment tools unavailable to most investors; it can purchase companies outright, and its fortress balance sheet allows bespoke and profitable transactions with companies in difficulty — for example, Salomon Brothers and Goldman Sachs). Poor Charlie’s Almanack, first published in 2005, is a reissue with a new foreword by Stripe, Inc., (and Stripe Press) founder John Collison. Following the original three forewords by Buffett, Munger, and almanac compiler Peter D. Kaufman, the book features three introductory chapters — a “portrait” of Munger’s life, recollections and anecdotes from his children, and a summary of his “approach to life, learning, and decision-making” — followed by 11 talks given between 1986 and 2005. Munger’s final talk is substantially revised and expanded from three speeches given between 1992 and 1995 and serves as a bookend to the third introductory chapter. Either of the bookend chapters could serve on its own as a comprehensive exposition, but the book is strengthened through repetition of Munger’s lessons and wit. The chronological arrangement of the talks also gives readers insight into the evolution of his wisdom (the wit is there from the start). The almanac is less textbook and more a series of warm fireside chats, and as with the yarns of our elders, the repetition can draw a groan but also ensures that the lessons endure. Most talks are followed by a short reflection by Munger and some featured highlights from audience question-and-answer (Q&A) sessions. For example, an attendee asks how to copy the Berkshire model of success. Munger’s response underscores the value of wisdom rather than formulas or shortcuts. First, Munger and Buffett’s system is not a secret formula but, rather, a latticework of mental models that challenges assumptions and assesses downside risks from a variety of perspectives. Second, they focus on areas where they have a competitive advantage or at least areas where they are not at a disadvantage (hence Berkshire’s traditional reluctance to invest in technology stocks — businesses they claim not to understand well). In one of many analogies from his wide range of interests, Munger draws on the card game bridge to demonstrate the importance of using all available models and the importance of model interaction. Successful players communicate the strengths and weaknesses of their hands through strategic bidding and then leverage that information through finesse and skillful card play. Investors who have attended one of Berkshire Hathaway’s convention and annual meeting weekends may know already of the link between Munger’s passion for bridge and the breadth of Berkshire’s investment holdings. Convention floor attendees may have kicked (while wearing Justin Brands boots) the tires of a Dairy Queen ice cream cart or a NetJets plane or a Burlington Northern and Santa Fe Railway car and then witnessed Munger and Buffett drop in for a hand at a side-area duplicate bridge match. At the arena next door, Munger’s and Buffett’s market insight would have been on lively display at the annual meeting’s Q&A session. Poor Charlie’s Almanack weaves the temporal wisdom of successive annual meetings — at which, questions often focus on current market events — into a comprehensive and equally lively set of life lessons and investment guidance, producing a philosophical companion to the live experience of a Berkshire annual meeting. The multiple models approach includes management of downside risks, for which Munger quotes the algebraist Carl Jacobi (“invert, always invert”) and provides practical examples in the methodology used by Charles Darwin as he developed On the Origin of Species. Additional lessons are drawn from an eclectic list of tutors: Demosthenes, Jack Welch, George Bernard Shaw, B. F. Skinner, and, of course, Ben Franklin. Munger was also fond of the term “lollapalooza,” by which he meant the synergistic interaction of multiple biases or effects or models. It is unclear whether he knew the musician Perry Farrell, who more recently popularized the term. Criticisms of the book are few. Munger’s style can seem outdated; he draws mostly on male examples and uses such phrases as “the manly art of wagering.” But given that he lived to the age of 99, readers may overlook this drawback to focus on his wisdom. Still, some of Munger’s examples age better than others. As expected, Demosthenes and Franklin age well. (It is unclear whether Munger knew either of them.) Jack Welch, the former CEO of

Book Review: Poor Charlie’s Almanack Read More »

From Darwin to Wall Street: A Rebuttal

This article is a rebuttal to Drew Estes’s “From Darwin to Wall Street: Harnessing Evolutionary Theory for Smarter Investments.” In his post, Estes argues that economics should borrow ideas from evolutionary biology rather than physics. Like Estes, I challenge the philosophical core upon which finance is based. But I make an argument for building investment processes on a theistic worldview. Estes asserts: “A product, whether a good or a service, is a firm’s DNA, and products comprise many sub-units, or “premes.” The preme is the gene of commerce. They are the “units of heredity” differentiating product-lines. Accordingly, premes are the primary “replicators” of commerce, and firms, like organisms, are merely their “survival machines.” [1] Conclusions drawn from Estes’s article are eminently reasonable within the naturalist worldview. If existence led to essence, then insights from evolutionary theory within investments may prove useful. But what if essence led to existence?[2] The problem within finance is its philosophical core; that is, the worldview upon which our analytical frameworks are based. Naturalism, the philosophical foundation of evolutionary theory, is in direct conflict with theist-based worldviews. If you start from a different philosophical foundation you will end with a substantially different investment process. For more details, see Financial Fruit Based on Philosophical Roots: A Christian Perspective. [3] Here, a brief sketch is made between the investment implications of two different philosophical foundations — naturalism and theism. Estes laments, “No other science is so thoroughly ignored by its practitioners. … Economics should instead borrow ideas from evolutionary biology.” This departure from science may more reasonably be the result of wholesale adoption of evolutionary theory. Alvin Plantinga notes, “Scholarship and science are not neutral, but are deeply involved in the struggle between Christian theism, perennial naturalism, and creative anti-realism.”[4] C. S. Lewis notes, “Men became scientific because they expected law in nature, and they expected law in nature because they believed in a lawgiver.”[5] There are rational justifications for building investment processes on a theistic worldview. The emergence of numerous funds focused on biblically responsible investing (BRI) would be unwarranted within naturalism. If Christian theism is true, then BRI-based funds are not only warranted but are likely to be beneficial. Naturalism, Theism, and Finance Plantinga argues, “there is superficial conflict but deep concord between science and theistic religion, but concord and deep conflict between science and naturalism.”[6] Thus, there are reasons that investment processes built on components of naturalism, such as evolutionary biology, will not perform well. For example, naturalism denies the concept of biblical sin, a key aspect of Christian theism. Naturalism is defined as “the philosophical belief that everything arises from natural properties and causes, and supernatural or spiritual explanations are excluded or discounted.”[7] From a naturalist worldview, some form of evolutionary theory is logical. Theistic-based worldviews depict humans as more than simply sensate animals.[8] Financial decisions are not reduced to simply advancing my own narcissistic goals regardless of who may be hurt. Ideals exist that are foundational to investment-related decisions. Scientific activities usually focus on that which is repeatable but is not applicable in finance. According to Michael Ruse, science “deals only with the natural, the repeatable, that which is governed by law.”[9] This definition is too limiting as it rules out finance. According to John C. Lennox, science is a “method of inference to the best explanation.”[10] Investment management is a challenging field of study as it suffers from performativity among other things. Performativity implies beliefs about financial prices that change financial prices. Further, understanding what it means to be human is critical. The reality of human depravity, including our own, aids in developing appropriate financial guardrails. Two Economic Frameworks Theistic worldviews have essence preceding existence: “In the beginning, God created the heavens and the earth.”[11] Naturalist worldviews have existence preceding essence. “I am an infinitesimal speck of carbon-based dust born in a time and place not of my choosing here for an incredible brief amount of time before my atoms are scattered back into the cosmos.”[12] Modern economic analysis has moved away from a normative approach (what ought to be) to a positive approach (what is).[13] Modern economic analysis is positivist in flavor and fits well within naturalism. Theism-based economic analysis is normative in flavor and in direct contradiction to naturalism. Since economic thought first became formalized over two centuries ago, there have been essentially two different views about wealth. One view, first defined by Adam Smith and Jean-Baptiste Say, is that wealth is primarily metaphysical — the result of ideas, imagination, innovation, and individual creativity — and is therefore, relatively speaking, unlimited, susceptible to great growth and development. The other view about wealth, espoused by Thomas Malthus and Karl Marx, contends that wealth is essentially and primarily physical, and therefore ultimately finite. The modern presentation of this view argues that since usable energy is steadily diminishing into entropy, all wealth is really cost to be shared more equitably.”[14] Note modern economic theory is founded upon the doctrine of scarcity. The biblically-based approach is founded upon the doctrine of abundance coupled with a stewardship mandate. Products or People When applying evolutionary theory to commerce, it is understandable that the center of analysis rests on physical items. Estes asserts, “Products, in other words, are like DNA. They are complex structures of subunits called premes, and premes, like genes within DNA, battle for inclusion in products. A preme is any attribute impacting a product’s value proposition. It can be as minor as employees saying, ‘My pleasure,’ at Chick-fil-A or as major as iOS for Apple products.”[15] When applying a theistic worldview to commerce, it is expected that the center of analysis rests on the metaphysical, primarily people. For example, Chick-fil-A’s corporate purpose is as follows: “To glorify God by being a faithful steward of all that is entrusted to us. To have a positive influence on all who come in contact with Chick-fil-A.”[16] Similarly, from Apple’s website: “Apple conducts business ethically, honestly, and in full compliance with the law. We believe that how

From Darwin to Wall Street: A Rebuttal Read More »

Times Change: The Era of the Private Equity Denominator Effect

After private equity’s extraordinary performance in 2021, private market valuations decoupled from those of both public equities and bonds in 2022. This led many institutional investors to end up over-allocated to private markets. This is the so-called denominator effect, whereby private asset allocations exceed the percentage threshold established in an allocation policy and must be corrected. The simultaneous negative cash flow cycle has reduced anticipated liquidity that latent paper portfolio losses in traditional assets have already compressed. This makes portfolio adjustment decisions even more challenging. Last year’s data show that the rebound in equity prices and the pause in interest rate hikes have provided some relief, but they have not solved the private market liquidity issue or addressed the denominator effect’s implications. Liquidity needs have led to a significant increase in 2023 limited partner (LP)-led secondary sales, according to recent Lazard research. The economic paradigm may have changed and will remain uncertain. Given the potential for higher-for-longer interest rates, NAV staleness, and a negative cash flow cycle, the denominator effect may become more systematic in LP portfolios and force LPs to make more frequent allocation and liquidity decisions. So, what are some traditional strategies for addressing the denominator effect in private equities, and are there other, more innovative and efficient risk-transfer approaches available today? The Current PE Denominator Effect While 2021 was a year of extraordinary PE outperformance, 2022 was the real outlier as private markets showed unprecedented relative performance/valuation divergence from their public counterparts. A reverse divergence followed in 2023, with the highest negative return difference ever recorded, but it did not offset the current denominator effects. According to Cliffwater research, PE returned 54% in 2021, compared with 42% for public equities. The following year, PE generated 21%, outperforming stocks by 36 percentage points. In 2023, however, PE returned only 0.8% compared with 17.5% for equities. Impact of the Denominator Effect For investors building up an allocation in PE who have not yet reached their target, the denominator effect, albeit painful from the standpoint of negative performance overall, could accelerate the optimal portfolio construction process. For the (many) other investors with a near-to-optimal allocation, and a related overcommitment strategy, the emergence of the denominator effect traditionally implies the following: Consequence  Negative Impact  Reduced allocations to current andpossibly future vintages  1. Lower future returns2. Out-of-balance vintage diversification  Smoothed compounding effect ofPE returns amid curtailed reinvestment 1. Lower returns  Latent/potential negative risk premium ofthe PE portfolio since NAV staleness, which protected the downside, may limit the “upside elasticity”that accompanies any market rebound. 1. Compromised risk diversification2. Suboptimal asset allocation dynamics 3. Potential impact on future return targets  Crystallization of losses 1. Lower current returns 2. Unbalanced vintage diversification  Tackling the Denominator Effect  Investors counter the denominator effect with various portfolio rebalancing strategies based on their specific targets, constraints, and obligations. Traditionally, they either wait or sell the assets in the secondary market. Recently introduced collateralized fund obligations (CFOs) have given investors an additional, if more complex, tool for taking on the denominator effect.  1. The Wait-and-See Strategy Investors with well-informed boards and flexible governance could rebalance their overall portfolio allocation with this technique. Often, the wait-and-see strategy involves adopting wider target allocation bands and reducing future commitments to private funds. The former make market volatility more tolerable and reduce the need for automatic, policy-driven adjustments. Of course, the wait-and-see strategy assumes that market valuations will mean revert and within a given time frame. Cash flow simulations under different scenarios and examinations of how various commitment pacing strategies can, in theory, navigate different market conditions.  In practice, commitment pacing strategies are inherently rigid. Why? Because no change would be valid for stipulated commitments, legacy portfolio NAVs, and future cash flows thereof. Funding risk is a function of market risk, but private market participants have neglected this for two reasons: because of the secular abundance of liquidity and the cash flow–based valuation perspective, which has limited structural sensitivity to market risk. Internal rates of return (IRRs) and multiples can’t be compared with time-weighted traditional asset returns. Moreover, NAVs have historically carried uneven information about market risk since they are non-systematically marked to market across all funds. What does this mean? It indicates an unmeasured/implicit possibility that the existing stock of private asset investments is overvalued and that a negative risk premium could result with private asset valuations rebounding less acutely than those of public assets.  According to Cliffwater commentary and analysis, data show that private equity delivered a significant negative risk premium in 2023.  As of June 2022, the annual outperformance of PE vs. public stocks was worth 5.6 percentage points (11.4% – 5.8%), with excess performance of 12% and 36% for 2021 and 2022, respectively. The public markets rebounded through June 2023 by 17.5% compared with private equity’s 0.8%. As a consequence, the reported long-term trends are adjusted to 11% for PE and 6.2% for the public markets, and to 4.8% for the derived outperformance. Compared with the 17.5% of public stocks, there is a negative risk premium impact of 16.7% on the value of balance sheet assets for which long-term outperformance data do not matter. The allocation strategy is long term, but an actual PE portfolio’s valuation is not. Its true economics are a function of its actual liquidation and turnover terms.  Patience may be neither mandatory nor beneficial. Whether to hold on to private assets should always be considered from the expected risk premium perspective. Notably, the consequent reduction in future commitments, associated with negative cash flow cycles, may further reduce the benefits of return compounding for private assets. 2. The Secondary Sale Strategy Investors may tap into secondary market liquidity by selling their private market stakes through LP-led secondaries, or an LP can sell its fund interests to another LP. Although this provided investors with liquidity and cash in hand, which is critical because of reduced fund distributions, in 2022, LPs could only sell their PE assets at an average of 81% of NAV, according to Jefferies. By selling in the

Times Change: The Era of the Private Equity Denominator Effect Read More »

The FX Global Code: Why Now Is the Time

Not for syndication. This article cannot be republished without the express permission of RBC Global Asset Management Inc. What if I told you that the largest, most liquid market in the world is also one of the least understood? Its $2.1 trillion daily spot turnover dwarfs that of bonds or equities, and all its transactions are conducted over the counter (OTC). The market also connects thousands of participants in 52 different jurisdictions and facilitates a further $5 trillion daily in forwards, swaps, and options, in addition to spot transactions. I am talking, of course, about the highly fragmented foreign exchange (FX) market. Such a large and interconnected market should operate in an open, liquid, fair, robust, and transparent manner. Since the global financial crisis (GFC), the FX market’s daily turnover has approximately doubled. That has raised expectations regarding transparency and liquidity and has necessitated increased oversight. I have had a front-row seat to the FX market’s evolution over the last 20 years and recall all too well how it often made headlines for all the wrong reasons as information imbalances between dealers and clients led to abuses. “Suspicion of Forex Gouging Spreads,” the Wall Street Journal blared in February 2011: “Some of the largest investment firms in the U.S. have been overcharged by banks for currency trades, bank insiders and others claim, broadening the scope of alleged abuses in pockets of the $4 trillion foreign-exchange market.” In response to such excesses, G10 central bank governors launched a global initiative to establish the FX Global Code (“the Code”) in May 2015. Over the next several years, representatives from 16 central banks, in collaboration with private market participants from both the buy-side and sell-side, drafted a comprehensive document. RBC Global Asset Management (RBC GAM) participated in one of the working groups. The final 70-plus-page document, published in 2018, went beyond ethics to embody industry best practices. Organized around six leading principles, the Code outlined what market participants expected from themselves and each other: Ethics: “To behave in an ethical and professional manner to promote the fairness and integrity of the FX market.” Governance: “To have a sound and effective governance framework to provide for clear responsibility for and comprehensive oversight of their FX market activity, and to promote responsible engagement in the FX market.” Execution: “To exercise care when negotiating and executing transactions.” Information Sharing: “To be clear and accurate in their communications and to protect confidential information.” Risk Management and Compliance: “To promote and maintain a robust control and compliance environment to effectively identify, manage, and report on the risks associated with their engagement in the FX market.” Confirmation and Settlement Processes: “To put in place robust, efficient, transparent, and risk-mitigating post-trade processes to promote the predictable, smooth, and timely settlement of transactions in the FX market.” The Code is not part of regulatory frameworks in most jurisdictions, so adherence to it is voluntary and signifies the participant’s commitment to good governance and good practices as well as promoting fair, transparent, liquid, and robust markets. The Code is meant to apply to all wholesale FX market participants — both buy- and sell-side as well as trading venues and other entities that provide brokerage and execution services. The Code allows for proportional implementation, however, as specific circumstances and variations in business activities may dictate. This acknowledges that dealers’ activities are inherently different from those of asset managers, corporations, or central banks, and not every principle applies to every participant. For example, as an asset manager, RBC GAM doesn’t make markets for clients and doesn’t conduct any proprietary trading on behalf of the firm, so many of the sell-side rules don’t apply to us. Determining which principles apply is the first step before a market participant can confirm adherence to the Code. As a living document, the Code is maintained and updated to reflect market changes, which is a key objective of the Global Foreign Exchange Committee (GFXC). The GFXC website is an excellent resource for information and tools to facilitate adoption. The original 2018 version of the Code was updated in 2021, and with each triennial revision, participants are expected to re-affirm their commitment to the latest document. In the four years since the Code’s release, most sell-side FX market participants have signed on. Buy-side adoption, however, has been slow to follow. Limited resources, that FX constitutes a small part of their business, the Code’s voluntary nature, and the perception that it’s a “sell-side thing” are among the reasons cited for the poor buy-side uptake. Having worked as a portfolio manager for more than 20 years, I find this perplexing. We have relied on our in-house FX desk for execution for more than 25 years at RBC GAM. Based on our experience, we believe that as an ecosystem, the FX market requires all participants to know, follow, enforce, and uphold the principles. We care about best execution in FX just as we do in fixed income and equities: It’s an important part of our governance framework. So, how has adhering to the Code helped us? It has become a training and education tool for new members of our FX, trade support, and operations teams and is part of our onboarding materials. It has prompted a review of our policies and an in-depth discussion about the Code’s applicability, which has strengthened our understanding of how the market functions as well as its best practices. It has empowered our trading staff to demand best execution practices, and all our counterparties must sign the Code. It has enabled us to continuously improve our policies and procedures. Each update has removed ambiguity. It has increased our confidence in our internal policies and procedures and highlighted the strength of our governance framework to clients. As corporations and asset managers look to demonstrate their commitment to environmental, social, and governance (ESG) values, they should embrace an opportunity for a thorough review of the governance framework supporting their FX business. Signing the Code has also benefitted our clients.

The FX Global Code: Why Now Is the Time Read More »

The FX Swap Market: Growing in the Shadows

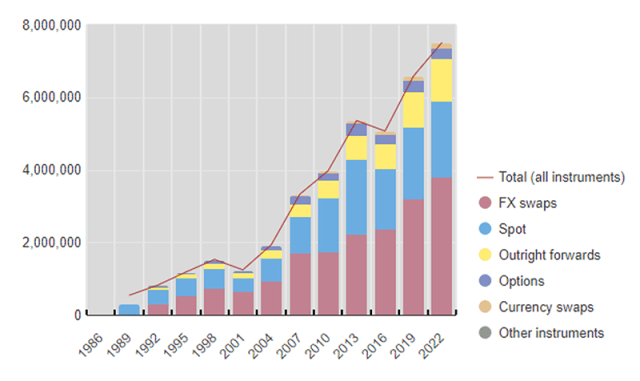
Introduction The foreign exchange (FX) swap market generates almost $4 trillion in new contracts on any given day. To put that in perspective, imagine global equities had a daily trading volume of 12 billion. Such an enormous market ought to be both transparent and well regulated. Yet the rapidly expanding FX swap market is neither; it is instead exceedingly opaque with many key statistics hard or impossible to find. Global Foreign Exchange Market Turnover: Instruments Source: “Triennial Central Bank Survey of Foreign Exchange and Over-the-Counter (OTC) Derivatives Markets in 2022,” Bank for International Settlements (BIS) How Do FX Swaps Work? FX swaps are derivatives through which counterparties exchange two currencies. One party borrows a currency and simultaneously lends another currency. The amount a party must later repay is fixed at the start of the contract, and the counterparty repayment obligation serves as the transaction’s collateral. FX swaps thus are an easy way for a party to quickly obtain dollar or FX funds. FX Swaps: How They Work On balance, the currency gap is fully hedged by the off-balance FX swap. One counterparty obtains more lending in a foreign currency without an increase on its balance sheet. Though an FX swap in theory implies that the counterparties transact with each other, in fact, banks are the main intermediaries. When they receive a request from a client to hedge an exposure, banks source the funds through matched-book or reserve draining intermediation. In the former, the banks finance expanded FX lending by increasing their repo borrowing and other liabilities. The main drawback of such an approach is that it grows the bank’s balance sheet, which impacts its leverage ratio or liquidity coverage ratio. Since the global financial crisis (GFC), these Basel III ratios are binding and costly. Through reserve draining intermediation, banks can finance the dollar lending and thus reduce their excess reserve balance with the US Federal Reserve. This way the size of the balance sheet stays the same, and the bank avoids any potential Basel III regulatory implications. But there is more to the FX swap market: Banks also conduct FX arbitrage and market making, so the real FX swap market resembles the following chart. Banks treat the three different positions — hedging, arbitrage, and market making — as fungible and just manage the overall currency exposure for all their activities. FX Swaps: How They Work with Arbitrage and Market Making A Growing Market Why is the FX swap market expanding at such a rapid clip? Profitability is one key factor. Banks lend dollars through FX derivatives that pay a dollar basis premium. This is what the banks make on top of what they would accrue simply by lending on the money market. The dollar basis premium has been very lucrative, especially for banks with abundant dollar funding. At the same time, by turning to FX swaps, these banks are accommodating their clients’ hedging requirements without affecting their Basel III ratios. Technology is another often-overlooked contributor to the growing market. FX swaps are short-term instruments, with more than 90% maturing in under three months. Rolling the spot positions to the nearest date can impose an administrative burden. Technology can automate many of these tasks and add other functionalities, such as automatic hedging and collateral management. Innovation is also disrupting how FX swaps are intermediated. Phone usage is declining, while electronic intermediation is expanding. Such a large and lucrative market ought to be fiercely competitive. Yet US banks dominate, with the top 25 accounting for more than 80% of the positions. What explains this preeminence? Up to 90% of FX swaps involve the US dollar in one leg. For example, a Dutch pension fund conducting a euro-to-yen FX swap would first swap euros into dollars and then dollars into yen. Opaque and Fragile The main risk posed by the FX swap market is the dollar squeeze. In this scenario, those entities without access to Fed dollars acquire large, short-term payment obligations. When the market functions smoothly, these FX swaps can be rolled over. But amid increased market volatility, dollar funding may dry up, leaving non-US banks and entities to scramble to find dollars to make good on their commitments. Ultimately, during the GFC and the COVID-19 pandemic, the Fed countered a dollar squeeze by providing swap lines to other central banks, funneling the needed dollars directly to them. However, these lines came with incomplete information given the market’s opacity. In fact, Dodd-Frank legislation exempted FX forwards and swaps from mandated clearing, so the market has no central clearinghouse. Even without a legal obligation, about half the FX turnover was settled by the largest global FX settlement system, CLS, in 2022. By using CLS, banks mitigate their settlement risk. This system has held up during periods of severe financial distress, and more counterparties are choosing to settle with CLS. Still, the other half of the market remains over the counter (OTC) and unaccounted for. Which begs the question: what happens during the next period of market turmoil? How many dollars should the Fed provide? To which countries? The FX swap market also suffers from a lack of price efficiency. Despite the enormous volumes traded, there is clear evidence of window dressing: As each month and quarter ends, intermediation spreads spike. In “FX Spot and Swap Market Liquidity Spillovers,” Ingomar Krohn and Vladyslav Sushko find that prices are not only distorted, but liquidity is also impaired. When globally systemically important banks (G-SIBs) periodically pull out of the swap market to avoid increasing the so-called complexity component, it leads to higher capital requirements. But reducing regulatory exposure does not reduce risk exposure. When banks intermediate in FX swaps, it affects their intraday liquidity and intra-bank credit and ultimately changes their asset composition changes. That’s why the FX swap market needs both regulatory management and effective risk management. What’s Next? Technology and increased settlement through CLS may help make the FX swap market more transparent and price efficient, but they are no substitute for what’s

The FX Swap Market: Growing in the Shadows Read More »

How Goals-Based Portfolio Theory Came to Be

The following is excerpted from Goals-Based Portfolio Theory by Franklin J. Parker, CFA, published this year by Wiley. “I’ve heard people compare knowledge of a topic to a tree. If you don’t fully get it, it’s like a tree in your head with no trunk — when you learn something new about the topic there’s nothing for it to hang onto, so it just falls away.” —Tim Urban When presented a choice between multiple possibilities, which one should you choose? This simple question has perplexed many a human being. Modern economics found its beginning with an attempt to answer this basic question. The wealthy class of Europe had quite a bit of time on their hands, and, as it turned out, they enjoyed gambling on games of chance. The Renaissance had shifted the traditional view of these games — rather than simply accept randomness, some of these aristocrats began to analyze the games mathematically in an attempt to understand their randomness. It was not through any pure mathematical interest, of course, but rather an attempt to gain an edge over their fellow gamblers and thereby collect more winnings! The thinking of the time coalesced around a central idea: expected value theory. Expected value theory stated that a gambler should expect to collect winnings according to the summed product of the gains or losses and the probabilities of those outcomes (i.e., Σi pi vi , where p is the probability of gaining/losing v, and i is the index of possible outcomes). If, for example, you win $1 every time a six-sided die rolls an even number, and you lose $1 when it rolls odd, then the expected value of the game is 1 / 2 x $1 + 1 / 2 x (–$1) = $0. In 1738, Daniel Bernoulli challenged that idea. As a thought experiment he proposed a game: a player is given an initial pot of $2, and a coin is flipped repeatedly. For every heads, the player doubles their money and the game continues until the coin lands on tails. When tails comes up, the player collects winnings of $2n, where n is the number of times the coin was flipped, and the game is over. Bernoulli’s question is, how much should you pay to play this game? Expected value theory fails us here because the payoff of the game is infinite! Clearly no one would pay an infinite amount of money to play the game, but why? Bernoulli’s answer is our first glimpse of a marginal theory of utility — a theory that would come to support all modern economics: “Thus it becomes evident that no valid measurement of the value of a risk can be obtained without consideration being given to its utility, that is to say, the utility of whatever gain accrues to the individual or, conversely, how much profit is required to yield a given utility. However it hardly seems plausible to make any precise generalizations since the utility of an item may change with circumstances. Thus, though a poor man generally obtains more utility than does a rich man from an equal gain, it is nevertheless conceivable, for example, that a rich prisoner who possesses two thousand ducats but needs two thousand ducats more to repurchase his freedom, will place a higher value on a gain of two thousand ducats than does another man who has less money than he.” The idea that humans do not value changes in wealth linearly, but rather find less value in the next ducat than they found in the first, launched the entirety of modern economics. Bernoulli went on to propose a logarithmic function for the utility of wealth — diminishing as the payoff grows. This, of course, solved the paradox. People are not willing to pay an infinite amount to play the game because they do not have infinite utility for that wealth. The value of each subsequent dollar is less than the previous one — that is the essence of marginal utility, and the foundation of modern economics. Of more interest to this discussion, however, is that Bernoulli also gives a first glimpse of a goals-based theory of utility! Bernoulli points out that we must think of what it is the wealth can do for us, rather than the absolute value of that wealth. In other words, it is not the cash that we care about, but rather what that cash represents in the real world: freedom from prison in Bernoulli’s Prisoner’s case, and transportation, housing, leisure, food, and so on, for the rest of us. What you wish to do with the money is an important consideration to how much you would pay to play Bernoulli’s game. This idea is echoed by Robert Shiller, winner of the 2013 Nobel Prize in Economics: “Finance is not merely about making money. It is about achieving our deep goals and protecting the fruits of our labor.” In short, investing is never done in the abstract! Investing is — and always has been — goals-based. It would be another two centuries before the theory underpinning rational choices was developed. John von Neumann and Oskar Morgenstern authored The Theory of Games and Economic Behavior in 1944, which has become the foundation upon which all theories of rational choice are built. Von Neumann was a mathematician (and a brilliant one at that), so their additional contribution — beyond the actual foundational ideas — was to apply a mathematical rigor to the theory of human choice. In 1948, Milton Friedman (later to win the 1976 Nobel prize in economics) and L. Savage explored the implications of von Neumann and Morgenstern’s rational choice theory to an economic conundrum: why do people buy both insurance and lottery tickets? Rational choice theory would generally expect individuals to be variance-averse, so the fact that people express preferences for both variance-aversion and variance-affinity in the same instance is troubling. This has since become known as the Friedman-Savage paradox, and their solution was that the utility curve of

How Goals-Based Portfolio Theory Came to Be Read More »

Does a Stock’s Price Influence Its Risk Profile?

As a stock’s nominal share price falls, what happens to its risk profile? The answer to this question has important implications for managing investor expectations and reducing portfolio turnover. Afterall, investors often deviate from their chosen long-term strategies due to emotional reactions to unanticipated market movements. These market-timing actions present their own form of risk, adding to the existing risk of unpredictable markets. Some would argue that as a stock approaches the lower end of penny stock territory, volatility will moderate because there is an inherent threshold below which the price cannot drop. Others would contend that the stock will become more sensitive to market movements because market conditions dictate the survival of the company. We investigated what happens to systematic risk and the total volatility of a stock when it becomes a penny stock, i.e., its price drops below $5 per share. The results may surprise you. We found that as a stock declines in value, it becomes more sensitive to market movements. In other words, its beta increases and its total volatility increases accordingly. We pulled stock returns on all NASDAQ- and NYSE-listed firms going back 50 years. We examined stocks that during the 50-year period crossed the threshold of $1 a share, $2.50 a share, or $5 a share. We captured the instances when each stock crossed these thresholds for the first time. We then noted the beta of the stocks before the threshold crossovers and compared them to the same betas of the stocks two years after the crossover date. The Findings The first interesting finding is that when a stock dips below the $1 threshold, on average, its beta goes from 0.93 to 1.57. A beta greater than 1.0 means a stock’s price is more volatile than the overall market, i.e., its price swings more wildly. The opposite is true of a beta less than 1.0. The jump in beta to 1.57 from 0.93 for the stocks that dipped below the $1 threshold represents a significant shift in risk profiles. In fact, it is statistically significant at 1%. At the $1 threshold, the average penny stock has much more systematic risk and total volatility. And this shift is across the board. Stocks with negative betas go from an average of -0.62 to 1.14. Stocks with betas between 0 and 1.0 go from 0.55 to 1.37. And stocks with betas higher than 1.0 go from 1.95 to 1.88. What happens to systematic risk and the total volatility of a stock when it becomes a penny stock: Beta Before Price Drop Beta 2 Years After Price Drop Average Price Drop Cutoff: $1/share 0.93 1.57 Beta below 0 -0.62 1.14 Beta between 0 and 1.0 0.55 1.37 Beta higher than 1.0 1.95 1.88 Beta Before Price Drop Beta 2 Years After Price Drop Average Price Drop Cutoff: $2.50/share 0.90 1.56 Beta below 0 -0.55 1.01 Beta between 0 and 1.0 0.52 1.27 Beta higher than 1.0 1.90 1.94 Beta Before Price Drop Beta 2 Years After Price Drop Average Price Drop Cutoff: $5/share 1.00 1.07 Beta below 0 -0.56 -0.51 Beta between 0 and 1.0 0.47 0.50 Beta higher than 1.0 2.02 2.17 The results highlight that this drastic increase in risk (volatility) is entirely due to increases in systematic risk, i.e., movement with the market index. Notably, these results are not driven by a reversion to the mean over time in betas. At the high end of our study, we examined when stocks cross the $5 a share barrier. The results look quite different. Before a stock crossed the $5 threshold, on average, its beta is 1.0 and afterward it is 1.07.  The other beta tiers at $5 a share showed the same results. This affirms that the $1 threshold results are truly due to the stock entering penny stock territory. The results support the idea that penny stocks become much more risky (higher volatility) as they approach the zero-price barrier and that this risk is due to increases in systematic risk (increased sensitivity to market movements). If you liked this post, don’t forget to subscribe to the Enterprising Investor. All posts are the opinion of the author. As such, they should not be construed as investment advice, nor do the opinions expressed necessarily reflect the views of CFA Institute or the author’s employer. Professional Learning for CFA Institute Members CFA Institute members are empowered to self-determine and self-report professional learning (PL) credits earned, including content on Enterprising Investor. Members can record credits easily using their online PL tracker. source

Does a Stock’s Price Influence Its Risk Profile? Read More »

Private Equity: In Essence, Plunder?

Statistically, there is an increased risk of failure with private equity ownership. PE portfolio companies are about 10 times as likely to go bankrupt as non-PE-owned companies. Granted, one out of five companies going bankrupt doesn’t portend certain failure, but it is a startling statistic. The rejoinder, of course, is that PE firms gravitate toward companies in distress, a practice that weighs down their success rate. But to understand what private equity is at its worst is a call to action, personally and professionally. We need to monitor the specific and repetitive activities that benefit the operators and no one else. That, in a nutshell, is the key takeaway from our conversation with Brendan Ballou, the award-winning author of Plunder: Private Equity’s Plan to Pillage America. Ballou, who has experience as a federal prosecutor and special counsel for private equity at the US Department of Justice, was speaking in a personal capacity at the fireside chat hosted by CFA Society Hong Kong. Drawing from his extensive background, Ballou is well-placed to help us understand how PE firms leverage their influence to the detriment of the broader economy. He shared his insights on the inner workings and profound impact of private equity firms. During our discussion, Ballou focused on leveraged buyouts (LBOs). PE firms typically invest a small amount of their own money, a significant amount of investor money, and borrowed funds to acquire portfolio companies. And they aim to profit within a few years. He emphasized the influence of private equity in the US economy, noting that top-tier PE firms collectively employ millions of people through their portfolio companies. Despite their significant presence, public awareness of their activities remains low. Ballou highlighted several adverse outcomes associated with PE ownership, including a higher likelihood of bankruptcy for portfolio companies, job losses, and negative impacts on industries such as retail and healthcare. He cited three main reasons: PE firms’ short-term investment horizons, their heavy reliance on debt and extraction of fees, and insulation from legal consequences. He shared two case studies to demonstrate how PE firms can use financial engineering to benefit themselves while harming companies, employees, and customers. There are ways to mitigate the negative impacts of private equity, he maintained, advocating for regulatory changes to align sponsor activities with the long-term health of businesses and communities. Lightly Edited Excerpts From Our Conversation CFA Society Hong Kong: In Plunder, you discussed seven ways PE firms extract excessive profits from investments: sale-leaseback, dividend recapitalization, strategic bankruptcy, forced partnership, tax avoidance, roll-up, and a kind of operation efficiency that entails layoff, price hikes and quality cuts. Which one or two of these do you think are the most harmful and get to the core of your concerns? Brendan Ballou: It’s hard to pick just one or two. Sale-leasebacks, for instance, aren’t necessarily problematic but often can be, especially when the owner only plans to invest in the business for a few years. If you have a long-term perspective on a business, a sale-leaseback might make sense. However, a PE firm might buy the business and execute it primarily to maximize short-term value rather than to ensure a good real estate situation for the coming years. This was very vividly demonstrated in the buyout of Shopko, a regional retailer like Walmart. The PE firm executed a sale-leaseback, locking Shopko into 15-year leases. In retail, owning property is valuable due to its cyclical nature, and it’s helpful to have assets to borrow against. The PE firm took that away from Shopko. The second example is dividend recapitalizations. The basic concept is that the portfolio company borrows money to pay a dividend to the PE firm. The challenge is that a PE firm might only be invested in the company for a few years. Through some contractual arrangements, it can have significant control over the business despite a small equity investment (1% to 2%). This often leads the PE firm to execute a dividend recapitalization, directing the business to borrow and pay back the acquisition cost. This way, the PE firm is made whole on the purchase and turns subsequent income into pure profit. This approach makes sense for the PE firm but leaves the company saddled with debt it may or may not be able to manage. These examples illustrate that misalignments frequently create pain and controversy in PE acquisitions. Aren’t strategies like sale-leasebacks and dividend recapitalizations traditional business practices? None of them are illegal. Is it possible that you’re just focusing on the “wrong” data points? This is probably a very valid critique. However, it goes back to the basic problems we discussed earlier. PE firms have operational control over their businesses but often face very little financial or legal liability themselves. It means that PE firms can capture all the benefits when things go well in a business and sometimes benefit even when things go poorly. However, when things go poorly, there are often very few consequences for the PE firms. Tactics like sale-leasebacks, roll-ups, and dividend recapitalizations may be perfectly appropriate for a lot of businesses in various circumstances. But when you couple these tactics with a business model that operates on a “heads I win, tails you lose” often, maybe even most times, the outcome is destructive for all stakeholders except the PE sponsors. The business practices you described in Plunder could be seen as capitalism at its finest. By reorganizing balance sheets, value is created without necessarily having to invent something new, like an iPhone. Are you suggesting that these capitalists — by working within the system and collaborating with government officials — can do deals that exacerbate inequality? Absolutely. First, I often say that lawyers in the United States tend to invent a problematic business model every 20 years or so. Currently, I would argue it’s leveraged buyouts. Twenty years ago, it was subprime lending. Forty years ago, savings and loans. Sixty years ago, conglomerates. A hundred years ago, trusts. We can just create laws and regulations that incentivize short-term, extractive thinking. To be

Private Equity: In Essence, Plunder? Read More »

The Yield Curve, Recessions, and Monetary Policy Blunders: EI Podcast Highlights

Editor’s Note: Our Enterprising Investor podcast features intimate conversations with some of the most influential people from the world of finance. This post highlights some key talking points from a conversation between the show’s host, Mike Wallberg, CFA, MJ, and Campbell Harvey, PhD. In this episode of Enterprising Investor podcast, Cam Harvey delves into his groundbreaking research on the yield curve as a predictor of economic recessions within the context of today’s economy and recent monetary policy actions. Harvey, a finance professor at Duke University, pioneered the study connecting inverted yield curves with impending recessions — a relationship that has proven remarkably reliable over the past four decades. Understanding Yield Curve Inversion A normal yield curve slopes upward, reflecting higher yields for longer-term investments due to their increased risk and time horizon. An inverted yield curve — where short-term interest rates exceed long-term rates — signals that investors expect lower economic growth or a recession soon. This inversion is considered a powerful leading indicator of economic downturns. Indeed, Harvey’s research made the yield curve one of the most closely monitored tools by economists, investors, and policymakers. Its predictive power has stood the test of time, maintaining its relevance across different economic environments. In this episode of EI podcast, Harvey shares the remarkable story of how he developed and tested his original theory. Current Economic Context Harvey addresses the current 20-month inversion of the yield curve and implications for the economy. He explains that the curve inverted again in late 2022, sparking widespread concern about an impending recession. There have been eight yield curve inversions since the 1960s, all of which were followed by recessions. “This is a very simple indicator that is eight out of eight with no false signals. The economy is so complex, it’s remarkable you can have something that does such a reliable job,” Harvey enthuses. He concedes that the yield time between inversion and recession is inconsistent, ranging from six months to 23 months. The current inversion is 20 months. Monetary Policy Harvey has been critical of the Federal Reserve in the press. In this EI podcast episode, he discusses the Fed’s role in the current yield curve inversion. He maintains that the Fed’s aggressive interest rate hikes aimed at combating inflation have contributed to the inversion. As the central bank increases short-term interest rates to curb inflation, long-term rates have not risen as quickly, leading to the inversion. CFA Institute Research and Policy Center’s “Monetary Policy: Current Events and Expert Analysis” curates a range of research and opinions across markets and asset classes. Nuances and Considerations While the yield curve is a critical tool for forecasting, Harvey emphasizes that it should not be used in isolation. He advises that other economic indicators and market conditions must be considered when assessing the risk of a recession. For instance, factors like employment rates, consumer confidence, and corporate earnings also play crucial roles in understanding the broader economic picture. He shares the data he believes market participants and policymakers are ignoring, to their detriment. Harvey also explores the potential consequences of a prolonged yield curve inversion. Historically, prolonged inversions have often led to deeper and more severe recessions. He warns that if the current inversion persists, it could indicate more significant economic troubles ahead. However, he also suggests that appropriate policy responses, particularly from the Federal Reserve, could mitigate these risks. source

The Yield Curve, Recessions, and Monetary Policy Blunders: EI Podcast Highlights Read More »