CFA Institute

Quit to Win? Six Reasons Why Winners Quit

Binod Shankar, CFA, is the author of Let’s Get Real: 42 Tips for the Stuck Manager. Sometimes quitting is the right thing to do, whether it is leaving a city, a relationship, or, yes, even a career. But as an executive coach, I find that most people have major issues with giving up on a career, even one that has grown stale and unfulfilling. We can hang on for years — even decades — after we should have just thrown in the towel.  Why? There are countless reasons, but these are the ones I encounter the most in my practice:  No one wants to be seen as a loser. After all, winners never quit and quitters never win. We believe greater success in our current career is just around the corner. That organizational shake-up or long-awaited promotion will finally materialize and set us on the right path. We do not know why we should quit. We cannot articulate a convincing reason. Quitting will take us outside our comfort zones and inject uncertainty into our lives. Starting a new career is hard, especially if it is in a totally different sector. Will we have to take a pay cut? What will it mean for our quality of life? We have dedicated too much of our time and human capital to succeeding in an industry or discipline — accounting, for example — and quitting feels like chucking all that away. What was the point of all that effort if we are now going to give up? I know how much these concerns matter. They keep us in jobs we no longer want and prevent us from finding the ones that we love. But they are all focused on the downside. That is why I try to convince my clients who are finance professionals that quitting can have an upside. How do I know? Because I am an experienced quitter who has quit to win many, many times. For example, I quit studying for CPA exams to focus on the CFA Program; I quit corporate life to co-found a financial training company that we subsequently sold; I quit that company to become a podcaster; I quit as a CFA exam prep trainer to become an executive coach; I quit marathon running for high-altitude hiking and mountaineering; and I quit those two disciplines to focus on strength training. Are you seeing a pattern? So, I’ve devised six perspectives that help underscore the reasons to quit. Inspired by episodes of The Big Bang Theory, these are framed in a way that investment professionals will understand. 1. The Sunk-Cost Fallacy  When we calculate the net present value (NPV) or the internal rate of return (IRR) of a project or investment, we ignore all sunk costs no matter how large. These include valuation and appraisal reports, market studies, etc.  Why do we do this? Because life moves forward, not backwards. It is the forecast — the future — that matters.  So, from a pure career perspective, the 10 or 15 years we spent in financial control at XYZ bank matters far less than where we will spend the next 10 to 15 years. So, why not consider a switch?  What holds us back is an emotional attachment to a historical fact that is nothing but a sunk cost. 2. The Opportunity Cost Alternative  Opportunity cost is the value lost by choosing one opportunity over the next best opportunity.  Say we own a commercial building and lease it out as an office. The opportunity cost is the rent we would have collected had we leased it for the next best use — retail, say. Now look at our careers from this vantage point. Every day we spend in accounting is a day we do not spend building a career in investment management. And that type of inertia comes with a price tag attached.  I live in Dubai where, by my estimates, a financial planning and analysis manager with 10 years of experience earns about $80,000 less per year than a CFA charterholder working in investment management at the same firm with the same amount of experience. So yes, there’s definitely an opportunity cost.  There are caveats to be sure. When we switch careers or organizations, we may lose our seniority. For example, someone with 10 years in financial planning and analysis who moves to equity research may be treated at par with a five-year associate and their compensation may be lower at first. They may need three to five years to return to their old salary and then begin to outearn it. So, think long term. In Dubai, at least, we may not see that incremental $80,000 the first year after quitting. 3. The Time Value of Money  This is one of finance’s most fundamental concepts. We cannot conduct any analysis without it. So, what does this framework have to show about our future career? We can look at either the present value or the future value of the additional money we would make if we switched careers.  For the example above, if we run a present value or future value analysis of the extra $80,000 over a five to seven year period, even assuming an initial decline in salary, the additional financial benefits are hard to ignore. 4. The Risk–Return Paradigm  Quitting comes with risk. Financial and career failure are foremost.  Imagine as a finance professional we quit a career in corporate banking to join a private banking firm. But we soon find we hate the sales part of the new job and that building a book of ultra-high net worth individuals from scratch is easier said than done. Did we make a mistake? No — we just escaped a stagnating career at a small, haphazardly managed bank. In our new private bank position, our pay is 50% higher. We also have more flexibility and access to a wider range of financial products. Our prospects for promotion have also improved. We are now on a ladder that

Quit to Win? Six Reasons Why Winners Quit Read More »

Is Widespread Crypto Adoption Inevitable?

We are on the cusp of a major shift in financial, political, and social power from Baby Boomers toward Millennials that, combined with digitization and monetary policy shifts, will continue to drive regulatory changes supporting the adoption of cryptoassets. Regulation is often cited as a key factor hindering adoption of this under-owned asset. A recent Campden Wealth survey cited the lack of regulation as the second-highest impediment to investing in crypto among family offices. This is understandable, given the regulatory landscape in the United States since the collapse of crypto exchange FTX. Gary Gensler’s Securities and Exchange Commission (SEC) came down on the crypto industry with an iron fist, executing enforcement actions against Coinbase, Kraken, and many other credible companies. In addition, Martin Gruenberg at the Federal Deposit Insurance Corporation (FDIC) made life difficult for the crypto industry by weaponizing the banking sector. It has been challenging for crypto businesses like ours to get the basic banking services we require to function. The good news is conditions have improved markedly in the last year, opening the door for the power of changing demographics to accelerate the adoption of cryptoassets. Removing Regulatory Obstacles Conditions began to change in June 2023 with a constructive judgment in the court case against Ripple (XRP), providing much-needed clarity on the application of securities law to crypto. It also showed that the courts could stand up to the SEC, holding the institution accountable for its judgments. In August 2023, the US Court of Appeals for the D.C. Circuit called the SEC “arbitrary and capricious” after its decision to reject Grayscale’s Bitcoin ETF. This decision led to the approval of 11 bitcoin ETFs in January 2024 and laid the groundwork for Ethereum ETF approval in May 2024. ETFs have proven important, not merely for flows but for institutional credibility, creating broad-based support. Some of the world’s largest asset managers with entrenched relationships in Washington have built Bitcoin products and are marketing the value proposition to their clients. Bipartisan Support The approval of Bitcoin ETFs was monumental, but uncertainty over crypto regulation remained in Washington. Regulatory actions by the Department of Justice against Tornado Cash and Samourai Wallet in 2024 suggested persistent regulatory resistance. Events in May, however, have firmly affirmed the pendulum is shifting more positively. In May 2024, the House of Representatives passed a resolution, H.J. Res. 109, which overturned the SEC’s Staff Accounting Bulletin (SAB) 121. SAB 121 introduced unfeasible actions on digital asset custodians, threatening their viability. President Biden subsequently vetoed the actions of Congress. But the more important news is the bipartisan support for the bill in Congress including from key Democrats like Nancy Pelosi. In addition, FDIC chairperson Gruenberg is set to resign, potentially ending Operation Choke Point. Although Gruenberg’s decision is related to his misconduct charges, it certainly contributes to a significantly more positive regulatory landscape than a few months ago. It now appears that the harsh regulatory actions against the crypto industry are more idiosyncratic, coming from specific lobby groups. A broader number of Congressional members including Democrats, are adopting a more pragmatic view of the crypto industry and the technology that underpins it. The Unstoppable Market Forces I have long argued that three powerful market forces — digitization, monetary shifts, and changing demographics — make crypto adoption inevitable: Digitization: The world is increasingly digital, yet banking and finance haven’t been heavily impacted. Bitcoin represents the advent of digital scarcity. Bitcoin and crypto are taking money and finance into the digital age. Monetary shifts: Monetary regimes don’t last forever. The US dollar global reserve system has been around since the 1970s and is creaking under excessive debt and ultra-low interest rates, suggesting it cannot persist indefinitely. An alternative monetary system is required, and there are not many viable alternatives. Demographics: Baby Boomers have dominated global economics, politics, and culture for the last 50 years. They account for approximately 70% of US disposable income and 50% of wealth. However, old age implies that the reins will pass from Boomers to Millennials in the next 10 years. By 2025, Millennials are projected to comprise 40% of the US workforce, driving changes in work culture, job expectations, and career trajectories. Millennials are far more tech-savvy and favorable toward crypto than Boomers. Some Millennials will have grown up spending a significant portion of their time online. Digital ownership and online security may be second nature to them. The Campden Wealth 2023 survey of family offices affirms this general shift, revealing “change in culture” as a key finding. Nearly half (46%) of family offices expect a leadership transition to the next generation to occur within the next decade. Crypto Will Ultimately Prevail “Truth will ultimately prevail where there is pains to bring it to light.” George Washington As these trends unfold, aggregate perceptions of crypto will evolve, driving adoption beyond mere allocation. Politicians will need to adopt more crypto-friendly stances to appeal to an increasingly influential constituency. The recent appointment of J.D. Vance and Vivek Ramaswamy to key roles in the Trump presidential campaign reflects the early stages of this trend. If Trump is elected, these two pro-Bitcoin officials would be the first Millennials in the White House. Companies will consider crypto as a cost of doing business to remain relevant in the digital age like PayPal. Investment managers will be forced to consider allocation as they assess underperformance potential. A Nomura 2023 investor survey suggested allocators expect to have between 5% and 10% in digital assets in the next three years, and that traditional finance (Tradfi) backing of crypto products is important. We now have that backing through ETFs. Nearly half (45%) of the survey respondents said their and/or their clients’ total percentage exposure to digital assets will be between 5% and 10% over the next three years, and just 0.5% say they will have no exposure. Notably, $150 billion flows are expected by the end of 2025. Money is a technology to facilitate trade and savings. Bitcoin and crypto are merely an

Is Widespread Crypto Adoption Inevitable? Read More »

The Financial Adviser Value Proposition: The Five Components

What can we do for our clients that they can’t do on their own? What can make us better at managing their money than they are? These aren’t always easy questions to answer as a financial adviser. But modesty aside, we need to be able to explain to potential clients how we can help them and why we are worth the cost. And once we convince them to make that decision, we have to demonstrate that we really do walk the walk. It’s a two-part process: explaining our value and then continually demonstrating that value in the months and years ahead. So, what is our value proposition? To me, it comes down to five key contributions that we can deliver that many clients can’t get without an adviser. 1. Managing Emotions and Controlling for Bias Even if the client is brilliant, a genius, and smarter than any adviser out there, chances are they may get emotional about their money and might have trouble staying focused and unbiased when it comes to managing their own wealth the way advisers can.  They might hold on to a stock as it goes up and up without any strategy to protect themselves, only to watch it crash. Or they might panic and go to cash if the Dow drops 3% for four days in a row without the discipline to recognize that they may miss the upswing. A good adviser will have the discipline to stick to an investment philosophy and follow the data. Historical data shows that over the past 20 years, seven of the best days happened within just about two weeks of the 10 worst days. As professionals, we need to help clients manage their expectations and emotions.  I have seen so many clients insist on holding on to a stock simply because they “like it,” even though its earnings and profitability tell another story. And I have seen so many clients try to bail out at a bad time. That’s where we come in. Advisers are driven by objective factors — no emotions allowed. We provide the process, the philosophy, and the discipline that clients often can’t exercise on their own. 2. Resources As advisers, we have resources that clients can’t access themselves. This could be in the form of investment opportunities, proprietary research and insights, or access to specialists who can help with more complex situations, such as estate planning or liquidity events. Everyone’s financial situation is different. Financial goals and investing timelines vary from person to person. Creating a financial strategy is not one-size-fits-all, which is why it’s so important to have a personalized investment strategy. Advisers can sit down with a client and help outline a customized financial road map that is tailored to their personal needs and goals. Some advisers also specialize in particular areas, which can help clients who are navigating unique situations. 3. Brainstorming and Listening As advisers, we take and return our clients’ calls. We listen to their thoughts, whether it’s their worries and complaints or their hopes and dreams. This is significant and it matters. We can serve as sounding boards, even if we don’t always have the answers. Clients may have complex issues that we haven’t seen before. But simply talking through the pros and cons can be a great way to build a good client-adviser relationship. I had a client who struggled with whether to retire. She was so concerned about cash flow but no longer enjoyed the expensive city she called home. We brainstormed what it would mean to retire somewhere with a lower cost of living. At first, she merely mentioned it in passing — almost like a dream. It had little to do with her finances. Rather, she thought about missing her local friends but being closer to family as she aged. Ultimately, she went through with the plan. She now enjoys a stress-free life in retirement, with no cash flow issues. Our years of back-and-forth discussions went beyond the numbers. I listened and made sure I heard her concerns clearly. 4. Explaining Don’t downplay how important and helpful it is to simply explain things to clients. We should be spending a tremendous amount of time here. Good advisers will describe to their clients, in clear, direct language, exactly what is going on in their investment portfolio — the portfolio they created — as well as in the market and the broader economic landscape. A good adviser knows how to communicate and breaks things down to a level that’s easy to understand. We shouldn’t condescend and use big words and impenetrable jargon. We just need to be kind and polite and truly stand behind what we have created so that the client understands from start to finish. I think to myself, “If I were a client, what would I like to know?” And then I try to provide those answers.  At every quarterly meeting with a client, I make a point of going through what I think is obvious. How much money did the client start with? How much is there now? What is the dollar increase, the percentage increase, and how do these returns compare to the benchmark? What is the appropriate benchmark, anyway? What were the fees paid, down to the penny? What is the income estimate and what was the income earned? How much can be drawn out without touching the principal?  When describing our relationship, we hope clients would say, “I meet with my adviser regularly, and they explain my money to me clearly. I understand what is going on. I even understand what is happening in the markets.” I always shudder when I onboard a client who says, “I really have no idea what’s in my portfolio.” Be the adviser that takes the time to explain — it is invaluable. 5. Being Close Confidantes A good adviser functions as a trusted partner. I serve as a partner not only to my clients, but alongside the other advisers in their life. For example, I work with clients’ tax and legal professionals, to help them craft strategies to prepare for all stages of life. I have walked clients through what will happen when they

The Financial Adviser Value Proposition: The Five Components Read More »

Bitcoin Valuation: Four Methods

For more on crypto valuation, read Valuation of Cryptoassets: A Guide for Investment Professionals by Urav Soni and Rhodri Preece, CFA, from CFA Institute Research and Policy Center. “On behalf of the professional investment community, I am respectfully asking any crypto expert to put together some cogent, coherent concept of how to make buy and sell decisions in a cryptocurrency portfolio.” — Franklin J. Parker, CFA, “Crypto’s Unanswered Question: At What Price?” Introduction Before diving into the bitcoin valuation task, we must first acknowledge that this is no ordinary undertaking. Unlike traditional assets such as stocks and bonds, bitcoin lacks the typical characteristics required for traditional valuation methods. It doesn’t generate cash flows, pay dividends, or otherwise offer yields, and thus may be more reminiscent of commodities, which are both cyclical in nature and notoriously difficult to value. Nevertheless, there are a number of sensible frameworks through which to view this evolution in money and finance.  So, in response to the question posed by Franklin J. Parker, CFA, here are four bitcoin valuation methods that highlight different ways of exploring the cryptocurrency’s worth and offer insights into this nascent yet powerful technology. 1. Compare It with the Alternatives One way to gauge bitcoin’s value is to determine what asset classes or securities it competes with and compare their potential value. So, to extend our commodity metaphor, where does bitcoin — so-called digital gold — stand relative to actual gold? Both are fixed-supply, counterparty-free assets with rare and desirable monetary characteristics and used by investors as long-term safe havens for capital preservation. Today, gold has a market capitalization of roughly $11.5 trillion. If bitcoin reached a similar market capitalization, then the price per coin would exceed $500,000. Bitcoin Valuation: Alternatives Comparison Sources: Glassnode, World Gold Council, Trading Economics, Savills, Visual Capitalist, and Sound Money Of course, bitcoin has something of a technological edge over gold. It is digital, decentralized, and free from government influence. So, if its market capitalization reaches $11.5 trillion, why would it stop there? And is gold its only competition? Couldn’t bitcoin stand in for other financial collateral and store-of-value assets like global bonds or even residential property? To be sure, definitive answers to these questions are elusive, but trying to find them can enhance our understanding of bitcoin, bitcoin valuation, and the crypto phenomenon more generally. 2. Base It on Production Costs We hear all the time about the electricity and equipment required to mine bitcoin. These associated expenses provide another means of determining the cryptocurrency’s value. While estimates of these costs are highly variable and inevitably inaccurate, Cambridge University researchers have compiled some of the most reliable data. Bitcoin Production Costs Source: Capriole Investments. Created with Data Wrapper Of course, bitcoin is a store-of-value asset and an alternative monetary technology. But few users are pricing bitcoin based on the latter quality. That’s why bitcoin production costs serve a purpose similar to those of gold: They set a floor on the price, which can help determine whether the underlying is undervalued. Historically, bitcoin’s price has tended to bottom out at around its production cost, as in the second half of 2016, the first half of 2019, March 2020, and the second half of 2022. By helping determine whether bitcoin is undervalued, production costs are a critical input to its valuation. But since they can hardly quantify the upside price potential associated with bitcoin’s monetary premium, they are also a limited input. 3. Look at the US Dollar So, how do we value bitcoin’s monetary premium? As an alternative monetary technology, bitcoin has to be assessed in the context of the prevailing monetary system: the US dollar. Real interest rates, money supply growth, and fiscal policy, among other factors, all influence bitcoin’s valuation. Elevated real interest rates and constrained money supply growth are indicators of sound monetary and fiscal policy. They help gauge whether the authorities are protecting the value of the dollar. Such factors should constitute headwinds for bitcoin prices. If policymakers are looking after the existing monetary regime, investors are less likely to look for an alternative. For Bitcoin Valuations, Dollar Policy Prudence Matters Sources: Glassnode, Google Finance, and Sound Money Of course, monetary policymakers often adopt profligate measures that debase the value of the dollar. The quantitative easing (QE) and other monetary stimulus of the last 15 years created low and negative real interest rates and rapid growth in the money supply. These were ideal conditions for bitcoin and fueled the crypto boom. Under tighter macro conditions, bitcoin is less valuable. Under loose conditions, it is more valuable. 4. Measure the Conviction of Bitcoin Holders Taking a more behavioral approach, we can also evaluate the underlying conviction of long-term vs. short-term bitcoin holders for clues to bitcoin’s value. The share of long-term holders tends to increase during bear markets and decrease during bull markets. Long-Term Bitcoin Holder Percentages Indicate Under/Overvaluation Sources: Glassnode and Sound Money This suggests that bitcoin is overvalued when short-term speculators hold more of the supply and undervalued when long-term holders predominate. Those accustomed to discounted cash flows, price-to-earnings ratios, and other traditional metrics may find bitcoin valuation methods unconventional. But unconventional or not, they offer a way to move forward. The outputs and outcomes may vary, but that is no surprise when it comes to emerging and potentially transformative technologies. Bitcoin’s many detractors could very well be right. Bitcoin and crypto in general could all end in failure, with an intrinsic value of effectively zero. But crypto advocates could also be on to something when they anticipate bitcoin becoming a global reserve asset. Few assets have ever sparked such divergent opinions. As the financial industry delves deeper into the crypto-valuation question, we should remember that the printing press, the steam engine, the internet, and other revolutionary technologies have always been difficult to value, particularly in their early stages. But these innovations eventually transformed the world in ways people did not initially imagine. Crypto may do the same. Or it may not. We’ll

Bitcoin Valuation: Four Methods Read More »

Is the PEG Ratio a Reliable Market-Timing Tool?

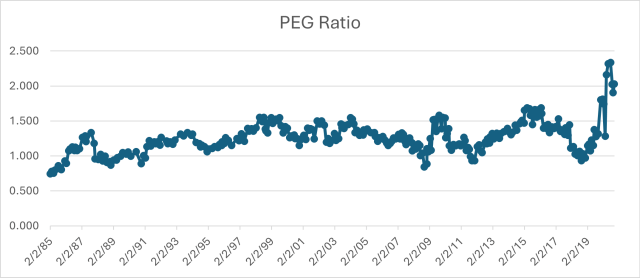
Investors rely on valuation metrics to gauge whether a stock is fairly priced. Among these, the PEG ratio is popular for its ability to adjust a stock’s valuation based on future earnings expectations. Unlike the standard P/E ratio, which simply compares price to current earnings, PEG incorporates growth projections. It is simply a company’s P/E ratio divided by its growth rate. Theoretically, this makes it a more refined tool for assessing whether a stock is under- or overvalued. But does the PEG ratio provide meaningful insights for broad market trends? To find out, we analyzed historical PEG data for the S&P 500 (1985 to 2020) and tested its effectiveness as a trading strategy. We used Yardeni Research’s PE ratio and its estimates of forward growth rates for the same period.  Exhibit 1. Mapping of the PEG ratio over time. The conventional wisdom is simple: PEG < 1.0 → The stock is undervalued relative to its expected growth. PEG > 1.0 → The stock is overvalued relative to its growth. Many investors consider 1.0 to be a key threshold. If a stock trades at a PEG below 1.0, it is seen as an opportunity. If it is above 1.0, caution is advised. If we use PEG to gage broad market trends, how often do these “undervalued” opportunities appear, and do they signal strong returns? Using the S&P 500 data from 1985 to 2020 and forward growth estimates from Yardeni Research, here’s what we found: PEG < 1.0 is Rare: Throughout the 1980s, there were a handful of months when the PEG ratio dipped below 1.0. In the 2000s, this happened only three times. In the 2010s, it occurred just five times. The PEG ratio almost never provides consistent buying opportunities at this threshold. PEG as Market Timing Tool: We tested a strategy where an investor would buy the S&P 500 when the PEG ratio was below 1.0 and sell when it moved above 1. While this worked well in some periods—like the 1980s—it was far less effective in the 2000s and beyond. Expanding the threshold to 1.25 or 1.5 showed similarly mixed results. Volatility is High: The returns associated with different PEG levels varied significantly across decades. What worked in one period often failed in another, making it difficult to use the PEG ratio as a standalone market signal. Table 1. While the PEG ratio remains a useful tool for evaluating individual stocks, our analysis suggests that applying it as a market-wide signal is far less reliable. Historically, opportunities to buy when the PEG ratio falls below 1.0 have been rare, and the strategy of trading based on PEG thresholds has yielded inconsistent results, particularly since 2000. While valuation metrics are valuable in investment decision-making, no single ratio should dictate market timing. Instead, investors should consider the PEG ratio as one piece of a broader analytical framework — complementing it with other fundamental and macroeconomic factors to make well-rounded investment decisions. If you liked this post, don’t forget to subscribe to the Enterprising Investor. All posts are the opinion of the author. As such, they should not be construed as investment advice, nor do the opinions expressed necessarily reflect the views of CFA Institute or the author’s employer. Image credit: ©Getty Images / Ascent / PKS Media Inc. Professional Learning for CFA Institute Members CFA Institute members are empowered to self-determine and self-report professional learning (PL) credits earned, including content on Enterprising Investor. Members can record credits easily using their online PL tracker. source

Is the PEG Ratio a Reliable Market-Timing Tool? Read More »

The Alchemist’s Paradox, Central Bank Sovereignty, and the Fate of Crypto

“It is difficult not to marvel at the imagination which was implicit in this gargantuan insanity. If there must be madness something may be said for having it on a heroic scale.” — John Kenneth Galbraith The cryptocurrency exchange FTX filed for bankruptcy on 11 November 2022 as Sam Bankman-Fried’s estimated net worth plummeted from $16 billion to roughly $0. While I’ve always been a crypto skeptic, I tempered my opinion because I did not understand the technical underpinnings or fully grasp the broad use cases. This led me to discount what was obvious: That the crypto craze had all the signs of a speculative bubble and that cryptocurrencies fulfilled none of the critical requirements needed to replace major currencies or serve as “digital gold.” Whatever the value of the technical innovation that minted them, cryptocurrencies suffer from two major and insoluble problems that make it extremely doubtful they will ever supplant fiat currencies or be used as the underlying commodity to which the value of a currency is pegged. Problem 1: The Alchemist’s Paradox One of the keys to crypto’s value proposition is the concept of supply constraint. According to their proponents, cryptocurrencies cannot be minted ad infinitum the way paper currencies ostensibly can. Each cryptocurrency can supposedly be reined in by programmatic constraints that prevent arbitrary increase in supply and preserve a cryptocurrency’s scarcity value. This sounds great in theory, but it only applies to single cryptocurrencies. Because crypto technology is so easily replicated, nothing prevents entrepreneurs from launching new cryptocurrencies. Which is precisely why there are now roughly 12,000 varieties circulating in cyberspace. This is the same problem ancient alchemists would have encountered had they discovered how to create gold out of lesser elements. Once the secret was out — and it would get out — gold would lose its scarcity value and no longer serve as a reliable store of value. The same rule applies to cryptocurrencies. The technology that gave rise to bitcoin was novel, but other cryptocurrencies have since emulated it. This distinct lack of supply constraint has made cryptocurrencies, in aggregate, a poor store of value. Problem 2: Central Bank Sovereignty The next hurdle to broad cryptocurrency adoption is the central banks. They must accept cryptocurrencies as a viable form of reserves. For that to happen, they would first need to abandon the current system of fiat currencies that most employ and repeg their currencies to some other commodity. No major central bank is likely do this willingly and, contrary to popular belief, for good reason. Doing so would significantly reduce their ability to adjust the money supply in response to financial crises. It was precisely this constraint under the gold standard that prolonged the Great Depression in the 1930s and caused repeated panics and depressions throughout the 1800s and early 1900s. Central bankers will not voluntarily reintroduce this structural weakness into their financial systems. Second, even if central banks retired fiat currencies, they would have to determine that a cryptocurrency, rather than gold, silver, or something else, was the best commodity to which to link their currency. In what sort of scenario would any major central bank willingly harness its currency to something over which it could exercise no control of the supply? At least with gold, the supply is limited by formidable natural constraints. The last time a major sovereign country relinquished control over its money supply to my knowledge was in early 18th-century France, when the regent for Louis XV handed the money supply, tax collection system, and control of Mississippi Company shares to John Law. The Mississippi Bubble that followed decimated the French economy and reverberated for the remainder of the century. Louis XV suffered a tremendous loss of wealth, and his successor, Louis XVI, lost his life. This is not something central bankers would dare repeat. Relegation to the Shadows of Finance Without broad-based central bank acceptance, cryptocurrencies will be permanently exiled to the fringes of the financial markets. The black market, failed or failing nation states, and the 24-hour casinos run by FTX-like firms may find limited use cases. But even if these are viable, we can only guess how large the potential market might be and which or how many cryptocurrencies will emerge as viable mediums, which makes buying and selling them no more than speculation. What’s worse, those who play this game will need to accept the risk of bank runs, bank robberies, and fraud without the protections of a well-regulated banking system. For those who made their fortunes in this shadowy market, I bear no ill will. Every bubble has its share of winners. But those looking to make crypto fortunes should be aware that there are more Bankman-Frieds lurking in the shadows, and whether or when they divulge the real value of their assets or steal yours is anybody’s guess. If you liked this post, don’t forget to subscribe to Enterprising Investor. All posts are the opinion of the author. As such, they should not be construed as investment advice, nor do the opinions expressed necessarily reflect the views of CFA Institute or the author’s employer. Image credit: ©Getty Images/ undefined undefined Professional Learning for CFA Institute Members CFA Institute members are empowered to self-determine and self-report professional learning (PL) credits earned, including content on Enterprising Investor. Members can record credits easily using their online PL tracker. source

The Alchemist’s Paradox, Central Bank Sovereignty, and the Fate of Crypto Read More »

CAPE Is High: Should You Care?

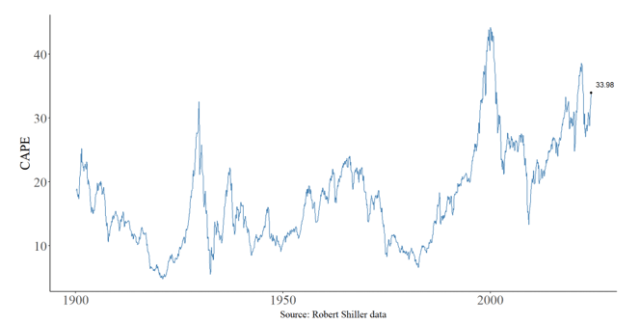
Robert Shiller’s cyclically adjusted price-to-earnings ratio (CAPE) is approaching historically high levels. In fact, CAPE’s current value has been exceeded only twice since 1900. But should you care? Investment professionals know that despite CAPE’s historical tendency to anticipate equity market returns, it isn’t a reliable market-timing tool. The evidence discussed here offers a possible explanation why. As shown in Figure 1, CAPE was trendless for most of its post-1900 history, with run ups typically followed by “compression.” For most of its history, it would have been natural to think that periods of high CAPE will be followed by periods of low CAPE. Figure 1: CAPE, 1900-2024 And there’s a familiar if unnerving empirical regularity linking CAPE and future equity market returns. Figure 2 plots annualized 10-year returns for the Ibbotson Large Cap stock index®. Points are filled by CAPE starting value (red = high, blue = low). As is clear from the downward sloping pattern, CAPE values are strongly negatively correlated with future returns (correlation coefficient = -0.7). Longer term, the relationship is weaker but still negative. The correlation between initial CAPE and subsequent 20-year annualized returns is -0.3. Combined, Figures 1 and 2 suggest that episodes of expanding CAPE are followed by episodes of contracting CAPE and subdued equity market returns. Figure 2: CAPE (horizontal axis) and next 10-year’s annualized return, 1926-2024. Could This Time be Different? The question is whether the current period of expanding CAPE will be followed by a period of contraction and low equity market returns may depend on CAPE’s stability in a time series sense. My own work suggests that CAPE isn’t “stationary” and therefore shouldn’t be expected to mean revert. See “A Time-Series Analysis and Forecast of Cape” in the Journal of Portfolio Management. I revisit that question in this blog. Testing For a CAPE Break Since the growth rate of P (price) divided by E (earnings) is just the difference between the growth rates of P and E, the idea that CAPE might rise without bound may make investment professionals uncomfortable. To avoid this discomfort, it is helpful to think of CAPE as a single quantity and consider how that quantity has behaved over time and whether the process that animates it has changed. That is the approach I take here. It’s obvious from casual visual inspection of Figure 1 that CAPE changed at least once in its long history. CAPE has been elevated since the 1990s. Prior to 1990, CAPE’s mean value was 14.1. Since then, it has averaged 26.6. At 34, today’s CAPE is in 95th percentile of observations since 1900. A critical issue for practitioners is therefore: Did CAPE “change” in the 1990s, making its behavior prior to then less relevant than since? A statistical test of a change in a time-series over a range of dates, the Quandt Likelihood Ratio (QLR) test, can help answer this question. To estimate a break date using this test requires regressing CAPE on time and possible but unknown break dates (months, in this case) that fall within a particular window of time. I chose the window 1980 to 1999. By including a candidate break-date interval as dummy right-hand side variables in the regression model along with their interaction with time, a simple test of joint significance on a series of regressions (one for each date) can help identify changes in a time-series process. (R code for this test and other results cited in this blog can be found here.) Figure 3 shows the test statistics (technically, F-statistics) that result. The highest test-statistic value is the best candidate for a break in CAPE. That date, marked with a red dot in Figure 3, is August 1991. It coincides nicely with the date eyeballed from visual inspection of Figure 2. Figure 3: Test for date break in CAPE, 1980 to 1999. With a candidate break date in mind, we can then test whether CAPE’s behavior changed after that point. Specifically, we want to know if CAPE’s tendency to mean revert was more pronounced before 1991. To test this, I used a definition of mean reversion common in empirical finance: existence of negative serial correlation. One serial correlation test is straightforward. Changes in CAPE over one period are regressed on the change in an immediately prior period of equal length. If the estimated coefficient is negative and significant, CAPE may be mean reverting. To estimate CAPE’s serial correlation, I regressed the five-year change in CAPE on its prior five-year change. Results confirm a change in CAPE’s behavior after 1991. Prior to 1991, the estimated relationship between CAPE’s change in successive five-year periods is indeed negative (coefficient = -0.19) and significant (t = 5.8). After the estimated break year (1991), however, the estimated coefficient increases to a far less meaningful -0.06, and is insignificant (t = 1.4). Notably, results for tests over longer periods are less compelling, but also less reliable. The potential change in serial correlation is suggested by the scatterplots in Figure 4. The relationship in the right panel, which shows the more recent period, is weaker than in the earlier period, which is shown in the left panel. This is underscored by the slopes — flatter in the later period — of the linear regression fit lines drawn through each set of points. Figure 4: CAPE 5-year change serial correlation, 1900-91 (left panel) and 1992-2024 (right panel) Implications Most practitioners probably feel that CAPE changed in the 1990s. It has been above its 1900 to 1989 mean value of 14.1 a remarkable 99.8% of the time since the start of that decade. That elevated CAPE is associated empirically with lower returns is unsettling. But empirical regularities may not be reliable for forecasting if underlying relationships are unstable. My simple analysis offers evidence that CAPE changed in the 1990s and that and mean-reversion concerns may be misplaced. If CAPE changed three decades ago, however, there is nothing to prevent it from doing so again. Should you worry that CAPE is high? That depends on whether you

CAPE Is High: Should You Care? Read More »

Private Equity: Five Lessons from the Global Financial Crisis

Up until the 2008 credit crunch, the conventional recipe for success in private equity (PE) was straightforward: Just pour in debt and stir. A generous dose of leverage typically spiced up the financing of a transaction.  But the global financial crisis (GFC) turned this money pie into mush. Government-backed purchases of toxic assets — funded by central bank purchases of government bonds — eventually engineered a comprehensive bailout of distressed borrowers and other heavy debt users. With loose monetary policies throughout the 2010s, leverage returned with a vengeance. What to Expect from a Downturn So if a recession comes, how can the lessons of the GFC inform PE practitioners facing a formidable debt wall and stubbornly high interest rates? Here’s what to watch for: 1. A Mass Shakeout  Post-GFC, one in four buyout firms never raised another fund, according to Bain & Company’s “Global Private Equity Report 2020.” Without the central banks’ rescue package of zero interest rates and quasi-unlimited credit, the damage would have turned into carnage. Some firms were forced into liquidation, including top 10 European buyout shop Candover. Others were sold out in distressed transactions or simply spun off, including the proprietary PE units of troubled banks Lehman Brothers and Bank of America Merrill Lynch. A capital drought forced many more to work deal by deal. The fund managers that survived the GFC know they had a lucky escape. To avoid leaving their fate in the hands of regulators and monetary authorities, the larger operators have morphed into financial supermarkets over the last 15 years. That transition had less to do with fostering economic growth than protecting and diversifying fee income.  Global consolidation is to be expected and US PE groups will once again lead the charge. In 2011, Carlyle bought Dutch fund of funds manager AlpInvest. Five years later, HarbourVest acquired the UK firm SVG, a cornerstone investor in Permira. More recently, general partner (GP)-stakes investors, such as Blue Owl, specialized in the acquisition of large shareholdings to provide liquidity to PE fund managers. Blue Owl’s former incarnation — Dyal Capital — took a stake in London-headquartered Bridgepoint in August 2018, for instance. Blackstone has been one of the most active acquirers of stakes in fellow PE firms and announced in April 2020, amid pandemic-related uncertainty, that it had $4 billion in cash available for such purchases. Today’s tight monetary policies offer similar opportunities. 2. Portfolio Cleansing  According to the UK-based Centre for Management Buyout Research (CMBOR), 56% of PE portfolio exits in Europe in the first half of 2009 were distressed portfolio realizations such as receiverships and bankruptcies. By contrast, at the peak of the credit bubble in the first half of 2005, this cohort accounted for only 16% of exits.  In the United States, the number of PE-backed companies filing for Chapter 11 was three times greater in 2009 than two years earlier. Likewise, in 2020, nationwide lockdowns caused almost twice as many bankruptcies among PE portfolio companies than in the prior year despite comprehensive government bailout initiatives. Because most credit deals in recent years applied floating rates, should the cost of credit remain high, zombie scenarios, Chapter 11 filings, and hostile takeovers by lenders could spike. Financial sponsors wary of injecting more equity into portfolio companies with stretched capital structures may emulate KKR’s decision earlier this year to let Envision Healthcare fold and fall into the hands of creditors. 3. Flight to Size  Although PE powerhouses came under pressure in the wake of the GFC, with some critics gleefully predicting their demise, capital commitments should keep on flowing as long as fund managers control the narrative around superior investment returns. The risk for prospective investors is confusing fund size or brand recognition with quality. The Pepsi Challenge proved years ago that, in a blind taste, consumers preferred Pepsi to Coca-Cola, yet they continued to buy the latter partly because they wrongly associated advertising spend with superior taste. There is no blind taste test in private markets, so don’t expect a flight to quality but instead a crawl to safety. Limited partners (LPs) will avoid the risk of switching to less well-known fund managers, irrespective of performance. 4. Reshaping Capital Deployment  If a potential recession is not coupled with a financial crisis, the private markets correction ought to be moderate. Fundraising, nevertheless, is already becoming a drawn-out process. Institutional investors, or LPs, are committing less capital and will do so less frequently. Firms will raise vintages every six to eight years as in 2008 to 2014 rather than every three to four years as during the money-printing bubble of 2015 to 2021. In anticipation, several fund managers have established permanent capital pools to reduce their dependence on LPs.  To address distressed situations, fund deployment will focus on portfolio bailouts, assuming some value remains in the equity. PE fund managers will pursue risk-averse strategies such as continuation funds and buy-and-build platforms, backing existing assets rather than closing new deals.  Secondary buyouts (SBOs) will still represent the main source of deal flow, even if, in a high-interest-rate environment, these often-debt-ridden businesses may struggle.  Corporate carve-outs may be another source of deals. In the wake of the GFC, many companies had to dispose of non-core activities to protect margins or repair their balance sheets. Five of the 10 largest leveraged buyouts (LBOs) announced in 2009 were carve-outs. This trend could re-emerge amid a higher interest rate climate in which a growing number of corporations qualify as zombies, with earnings not covering interest payments. The Bank of England predicts that half of non-financial companies will experience debt-servicing stress by year-end. 5. A Credit Squeeze  The immediate fallout of higher credit costs is falling debt multiples and a more complex syndication process. In the midst of the GFC, some practitioners criticized the pernicious business model adopted during the credit bubble. In a 2008 book, French PE firm Siparex remarked: “Siparex . . . did not apply excessive leverage on mega-buyouts that today prevents the syndication of bank loans .

Private Equity: Five Lessons from the Global Financial Crisis Read More »

The First US Real Estate Bubble and Three Lessons from the Mount Tambora Eruption

Mark J. Higgins, CFA, CFP, is the author, with Elliot Chambers, of “The Panic of 1819, Silicon Valley Bank and the Dangers of Bank Runs,” from the Summer 2023 issue of Financial History. “The demand for lands since the 1st July seems as great as ever; all payments are made in the Mississippi Stock — which is sold at 25 percent discount . . . the demand for lands is so great I have not time within office hours to attend to my returns or books.” — Nicholas Gray, Land Office Clerk, 1816 On 10 April 1815, Mount Tambora, a volcano on the Indonesian island of Sumbawa, exploded in the largest volcanic eruption in recorded history. The volcano ejected an estimated 31 cubic miles of rock and ash and claimed at least 70,000 lives. But the eruption’s effect on the climate was far more deadly and disruptive. The volcano sent an enormous cloud of sulfur dioxide into the upper atmosphere that repelled sunlight and temporarily cooled the planet by an estimated 1 degree Fahrenheit or around 0.5 degrees Celsius. The disaster’s impact peaked in the summer months of 1816, the so-called Year without a Summer. Crop yields collapsed throughout the world, creating a shortage of agricultural commodities and a sharp rise in prices — especially for wheat and cotton. European farmers were hit especially hard, and countries increased imports to feed their populations. The US experience was less catastrophic but still painful. New England suffered the most due to the harsher effects of cold weather in the northern latitudes. Thousands of US farmers sold their land and headed west. The appeal was twofold. First, they could purchase larger tracts of farmland. Second, crop prices went up. For example, wheat prices rose nearly 25% by year-end 1816 and more than 50% by year-end 1817. The combination of more acreage and higher prices looked like the ultimate win–win situation. The following graph shows the sharp rise in land purchases in just one county in what became the state of Mississippi. Total Land Sales, in Acres, Washington County, Mississippi Source: Malcolm J. Rohrbough, The Land Office Business: The Settlement and Administration of American Public Lands The First Great Depression “The bank bubbles are breaking . . . the merchants are crumbling to ruin, the manufacturers perishing . . . there seems to be no remedy but time and patience, and the changes of events which time affects.” — President John Quincy Adams The global cooling caused by the Mount Tambora eruption was intense but short-lived. Unlike carbon dioxide, sulfur dioxide naturally dissipates from the atmosphere within a few years. By 1818, sulfur dioxide levels returned to pre-eruption levels, and global temperatures normalized. Owners of Midwestern farmland suddenly faced financial ruin. Many had taken on enormous loans to purchase plots at prices that could only be justified if crops sold at elevated rates for many more years. Instead, robust harvests and the huge expansion in agriculture fueled a global supply glut, and prices plummeted. By 1820, wheat prices had fallen by approximately 60% relative to 1817. The decline of agricultural commodity prices triggered a collapse in US land values as farmers and speculators adjusted their revenue forecasts. At the same time, the Second Bank of the United States, which began operations in 1817, reversed many of its lending policies to keep its dwindling reserves from eroding further. This reduced the money supply and intensified the economic contraction. Falling commodity prices, collapsing land values, tight monetary conditions, and highly indebted landowners were too much for the economy to bear. No single event marked the beginning of the Panic of 1819, but the financial misery that followed rivaled anything that the nation had experienced before and is sometimes referred to as the first Great Depression. Lessons from the Eruption of Mount Tambora The eruption of Mount Tambora occurred more than 200 years ago, but it has many lessons that are still relevant today. I detail several of these in the Summer 2023 issue of Financial History magazine and a few more below. 1. The Danger of Herd Behavior “That’s the dilemma we face. Over the next 15 years, instead of having these beautiful fields and orchards [alternative assets] to ourselves, there’s going to be a lot more money and a lot more competition. One has to predict that it’s going to be much tougher for endowed institutions to preserve their performance advantage.” — Laurance (Laurie) R. Hoagland, Jr., former CIO of the Hewlett Foundation Humans have a strong instinct to follow the crowd. This bias was hard-wired into our brains over hundreds of thousands of years because it was critical to our survival. When early humans identified an attractive resource and harvested it or recognized a hidden danger and fled from it, their neighbors often did the same. For most of human history and in many different contexts, this approach worked and continues to work, and later arrivers gain just as much benefit as the first movers. But the herd instinct does not work in the investing world. In fact, it backfires. As the herd flocks to new investments, the price goes up and quickly exceeds the intrinsic value of the asset. Then, once the supply of new investors dries up, the asset crashes. A small number of early adopters may profit from undiscovered investment opportunities, but followers are virtually guaranteed to come up short. The farmers and speculators of the 1810s differ little from modern victims of herd behavior. They suffered the same consequences as retail investors who piled into dot-com stocks, residential real estate, cryptocurrencies, non-fungible tokens (NFTs), and now artificial intelligence (AI) stocks. This behavior is also common among institutional investors, who have substantially increased their alternative asset allocations only to be disappointed with the returns, as Laurie Hoagland all but predicted 15 years ago. 2. The Danger of Fighting the Current of Time “Their delusion lies in the conception of time. The great stock market bull seeks to condense the future into a

The First US Real Estate Bubble and Three Lessons from the Mount Tambora Eruption Read More »

Debunking the Myth of Market Efficiency

Sixty years after it was first formulated, the core tenet of the efficient market hypothesis (EMH) — that stock prices fully reflect all available information — is still considered gospel truth in many quarters: Investors can only expect to earn a normal rate of return because prices adjust before investors can trade on fresh information. Hypothesizing about Markets Another key postulate of the EMH is investor rationality. That is, investors will automatically adjust their valuation estimates to every new piece of information. The EMH acknowledges that individuals can independently deviate from rational behavior. But a third assumption of the theory is that irrationally optimistic investors are just as common as irrationally pessimistic ones and thus “prices would likely rise in a manner consistent with market efficiency,” as the authors of Corporate Finance explain. While arguing that such irrationality is invariably offset may seem a little too tidy and unrealistic, a fourth EMH assumption holds that irrational amateurs will face rational and intuitive professionals who will take advantage of any temporary mispricing through arbitrage. A fifth fundamental inference is that of perfect competition. No investor can control any segment of the market and extract monopoly profits for lengthy periods. As a consequence of the above, there are no patterns in share price changes and prices at all times express true value. Prices follow a random walk, and no investor can consistently make money from trend-following, momentum-buying, or any other investment style. To anyone with experience in the public markets, these axioms — perfect information, investor rationality, an irrationality-offsetting mechanism, systematic arbitrage, and perfect competition — are, at best, farfetched. But as sociologist Raymond Boudon observed, “people often have good reason to believe in dubious or false ideas,” which can be reinforced by flawless arguments based on conjectures. One particular belief Boudon flagged is that of homo economicus as a rational being, “almost God’s equal.” What makes the EMH so appealing is the premise that markets are optimal capital allocators and wealth creators. That capitalism trumps planned economies does not validate the theory, however. Here, Max Weber’s core research principle applies: “Statements of fact are one thing, statements of value another, and any confusing of the two is impermissible.” This is where the EMH erred. Deconstructing Market Efficiency Let’s review why the EMH’s economic interpretation is questionable. 1. Information Accuracy To start with, the notion of perfect information ignores the fact that information can be manipulated, inaccurate, misleading, fraudulent, or simply difficult or impossible to understand. Rigging markets is not a new technique. Creative accounting and outright fraud are common, particularly during bubbles and market corrections. The dot-com and telecom manias led to various scandals. The latest euphoria orchestrated by central banks’ zero interest-rate policies brought on Wirecard and FTX, among other excesses. In the days of fake news and instant messaging, the claim that market prices contain all available data fails to take into consideration the risk of misrepresentation. 2. Information Access Market prices can only reflect perfect information if all investors access the same data at the same time. In the United Kingdom, for instance, a fifth of public takeovers are preceded by suspicious share price movements. Insider trading is rife and has always been. In an April 1985 study of all takeovers, mergers, and leveraged buyouts from the year before, BusinessWeek magazine found that the stock price rose in 72% of the cases before the transaction was publicly announced. As Drexel CEO Fred Joseph put it: “the arbs [arbitrageurs] have perfected the technique of obtaining inside information.” Disparate data access does not solely affect stock and bond exchanges. Four years ago, the Bank of England and US Federal Reserve discovered that some traders and hedge funds received policymakers’ statements up to 10 seconds before they were broadcast. 3. Information Processing Sophisticated investors analyze information in a methodical, rigorous, and speedy way. Algorithmic tools give institutions an unassailable edge against less experienced investors. The success of quantitative trading at Jim Simons’s Renaissance Technologies and other hedge funds demonstrates that superior data analysis can help beat the market consistently, even if not all the time. Mass investor confusion is a real phenomenon. Investors mistook the Chinese company Zoom Technologies with the newly listed Zoom Video in 2019, sending the former’s stock soaring 70000%. A year later, as the world went into lockdown, it happened again. These are isolated anecdotes to be sure, but given such basic mistakes, is it credible to posit that stock prices accurately reflect all available information? Beyond Information A major shortcoming of the EMH is that it offers a narrow definition of market efficiency, focusing wholly on data availability. This oversimplification fails to acknowledge that the market is more than just a reflection of data flows. Other factors can create friction. 1. Trade Execution Once investors access, process, and analyze information, they must be able to execute trades seamlessly. Market makers and professional traders may have this ability, but individual investors do not. The front-running scandal at Robinhood, when customer order data was shared with high-frequency traders (HFTs), is just one example of the uneven playing field. This sort of practice is nothing new. In The Man Who Solved the Market, Gregory Zuckerman explains how in the mid-1990s, “shady traders were taking advantage” of Simons’s hard work by “watching [his fund] Medallion’s trades.” Michael Lewis described how HFTs speed up trade execution in Flash Boys. They deploy computer-driven trading robots, access private venues called “dark pools” to hide transactions, move physically closer to public exchanges to trade ahead of other participants, and pay intermediaries for early access to information — all to artfully maintain an unfair advantage. Superfast connections and algorithmic trading should democratize access to stock exchanges, improve liquidity, and lower spreads not rig markets by enabling front-running. 2. Price Setting According to the EMH, price changes are statistically independent from one another. They occur as new data emerges; there are no trends for investors to identify. The market’s response to new data includes no

Debunking the Myth of Market Efficiency Read More »