CIO CIO

Better dashboarding with Dynatrace Davis AI: Instant meaningful insights

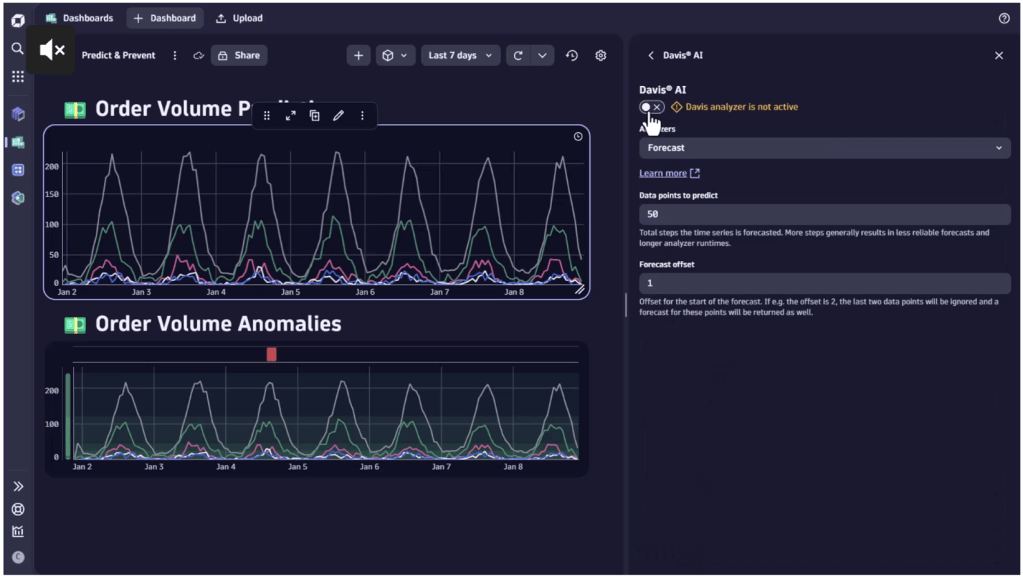
Ensuring smooth operations is no small feat, whether you’re in charge of application performance, IT infrastructure, or business processes. Chances are, you’re a seasoned expert who visualizes meticulously identified key metrics across several sophisticated charts. Your trained eye can interpret them at a glance, a skill that sets you apart. However, your responsibilities might change or expand, and you need to work with unfamiliar data sets. The market is saturated with tools for building eye-catching dashboards, but ultimately, it comes down to interpreting the presented information. This is where Davis AI for exploratory analytics can make all the difference. Figure 1. Activate Davis AI to analyze charts within seconds Dynatrace Davis AI can help you expand your dashboards and dive deeper into your available data to extract additional information. Our customers value the nearly unlimited possibilities for querying and joining data on the Dynatrace platform, with the option of instant, real-time visualization of query results. Whether you’re an expert or an occasional user, our recently launched Davis CoPilot will enable you to get instant results without the need to write complex queries yourself. Have a look at our recent Davis CoPilot blog post for more information and practical use cases. If you’ve already created your dashboards, now is the time to use Davis AI to identify anomalies or predict future trends without restricting use cases. Leverage Davis AI for anomaly detection and instant insights “My chart shows a peak at 8:00 AM. Do I need to investigate this further?” You might be regularly confronted with this or similar questions. Davis AI machine learning capabilities will help you identify actual anomalies within seconds, enabling you to focus resources on issues that matter. Based on your requirements, you can select one of three approaches for Davis AI anomaly detection directly from any time series chart: Auto-adaptive threshold: This dynamic, machine-learning-driven approach automatically adjusts reference thresholds based on a rolling seven-day analysis, continuously adapting to changes in metric behavior over time. For example, if you’re monitoring network traffic and the average over the past 7 days is 500 Mbps, the threshold will adapt to this baseline. An anomaly will be identified if traffic suddenly drops below 200 Mbps or above 800 Mbps, helping you identify unusual spikes or drops. Seasonal baseline: Ideal for metrics with predictable seasonal patterns, this option leverages Davis AI to create a confidence band based on historical data, accounting for expected variations. For instance, in a web shop, sales might vary by day of the week. Using a seasonal baseline, you can monitor sales performance based on the past fourteen days. An anomaly is identified if sales on a Friday are significantly lower than on previous Fridays, indicating a potential issue. Static threshold: This approach defines a fixed threshold suitable for well-known processes or when specific threshold values are critical. For example, if you have an SLA guaranteeing 95% uptime, you can set a static threshold to alert you whenever uptime drops below this value, ensuring you meet your service commitments. Davis AI is particularly powerful because it can be applied to any numeric time series chart independently of data source or use case. The following example will monitor an end-to-end order flow utilizing business events displayed on a Dynatrace dashboard. By leveraging Davis AI anomaly detection, we can identify potentially fraudulent behavior by activating anomaly detection on the Average order size chart. As shown in the chart below on the lower left, most values fall within the band of acceptable response time (highlighted in green), with only one spike occurring at 5:00 AM. Since this spike was outside the expected range, an anomaly was identified. Figure 2. Apply Davis AI anomaly detection to detect fraudulent behavior in a business process Dynatrace Application observability: Identify unexpected error rate increases in application performance, helping pinpoint and resolve issues quickly. Digital experience management: Monitor user interaction patterns to spot anomalies in website or app performance that could affect user experience, such as slow page load times. FinOps: Track irregularities in cloud spending or resource usage, enabling cost optimization and preventing budget overruns. Forecasting: Visualize trends directly on your charts with Davis AI Davis AI forecast analysis predicts future numeric values of any time series. It can even process external datasets or the results of any data query if it can be displayed as a numeric time series, such as occurrences over time. The forecast is created instantly, even for large data sets, and updates dynamically whenever filter settings are changed. In application performance management, acting with foresight is paramount. Maintaining reliability and scalability requires a good grasp of resource management; predicting future demands helps prevent resource shortages, avoid over-provisioning, and maintain cost efficiency. On this SRE dashboard, we utilize Davis AI to forecast and visualize future resource utilization: Figure 3. SRE dashboard monitoring the four golden signals and forecasting resource utilization Dynatrace Other potential applications for forecasting include: Kubernetes: Forecasting helps dynamically scale Kubernetes clusters by predicting future resource needs. This ensures optimal resource utilization and cost efficiency. Forecasting can identify potential anomalies in node performance, helping to prevent issues before they impact the system. Business: Using information on past order volumes, businesses can predict future sales trends, helping to manage inventory levels and effectively plan marketing strategies. AIOps: Utilize Davis AI to predict and prevent Utilizing the Dynatrace AutomationEngine, Davis AI forecasting capabilities can even trigger automated actions. One of our customers’ SRE teams needed to increase disk space to avoid ongoing over- and under-provisioning, which was time-consuming and annoying. Now, with Davis AI forecasting capabilities, the target disk size is predicted automatically, and an automated task for disk resizing is triggered when necessary. If you want to further explore the possibilities for prediction and prevention management with Dashboards, have a look at our example dashboard in the Dynatrace Playground. Figure 4. Prevent incidents through predictive maintenance and capacity management Dynatrace To explore the depth of functionality of Dynatrace Dashboards yourself and get first-hand experience, try out the app in the Dynatrace Playground. source

Better dashboarding with Dynatrace Davis AI: Instant meaningful insights Read More »
Driving AI-powered observability to action

As digital technologies have become ever more embedded within mission-critical services and customer-facing channels, observability has been elevated into a strategic business requirement. Organizations can no longer rely on manually monitoring the performance and availability of their applications and infrastructure. They need a real-time, end-to-end view of IT systems’ behavior and its direct impact on business outcomes, such as customer experience, conversions, and revenue. This is only possible with AI-powered business observability. By integrating technical and business metrics and using AI to turn them into actionable insights, organizations can turn business observability from a “nice-to-have” to a critical enabler for operational excellence, customer satisfaction, and growth. With business observability and AI capabilities, organizations can unlock the full value of their cloud investments, identify risks before they escalate, and create seamless user experiences. The challenges leaders face Many business leaders understand the importance of digital transformation, but lack the full visibility needed to connect IT performance with business outcomes. The volume of telemetry data being generated by modern digital services and their users has simply gone beyond human ability to analyze and act upon. This disconnect can lead to unexpected downtime, reduced customer satisfaction, compliance risks, and lost revenue. For example: System failures can cause disruptions to critical services, creating ripple effects across the business. Siloed teams may lack access to shared insights, delaying issue resolution and negatively affecting collaboration. Insufficient data analysis can result in missed opportunities to optimize system performance, cut costs, and identify emerging risks. Lack of data context means organizations aren’t getting the full picture when it comes to their data, hindering the ability to use it for effective decision making. For leaders, the critical challenge is clear: How do you transform the tsunami of telemetry data into actionable insights that can help to manage highly complex systems while ensuring business continuity, end-user satisfaction, and compliance with evolving standards? The answer lies in leveraging AI-driven business observability to foster effective collaboration across the organization. Observability is a strategic must-have Observability isn’t just an IT function—it’s a strategic necessity for modern organizations aiming to thrive in a cloud-driven world. While cloud-based applications offer unparalleled scalability and flexibility, they also introduce challenges such as increased system interdependencies, short-lived containers, and unpredictable behaviors in distributed environments. Traditional IT monitoring approaches are unsuited to this modern cloud-native world. Previously, organizations relied on siloed monitoring tools dedicated to a particular layer of the technology stack, such as networks, applications, databases, or infrastructure. These tools were time-consuming to use, relying on manual configuration and correlation of data from different tools to unlock actionable insights. As such, they fall short of delivering the comprehensive, full-stack context and real-time insights that IT teams need to predict and prevent issues effectively. AI-powered business observability addresses this gap by collecting and analyzing data from multiple sources—combining customer behaviors, IT performance, and business intelligence into a single, cohesive view in real time. Whether it’s optimizing customer experiences, enhancing security measures, meeting regulatory compliance, or maximizing operational efficiency, these approaches can empower organizations to proactively address challenges before they affect the bottom line. Unlocking business potential with observability Recognizing that business observability is a game-changer for modern digital enterprises leads to the discovery of actionable insights into both technical performance and business impact. By harnessing these insights, organizations can unlock business potential in numerous ways, including the following: Proactive issue detection and risk mitigation involve identifying IT issues early to prevent business disruptions by using real-time monitoring that highlights vulnerabilities, uncovers root causes, and provides solutions. For example, a financial institution reduced root-cause analysis time by 40% and automated security controls by 20% by using observability to distinguish real threats from potential risks, which reduced vulnerability risk and bolstered compliance. Enhanced decision-making through data contextualization combines technical metrics with business goals to enable informed decisions. By correlating performance metrics with factors such as revenue, customer journeys, and resource allocation, organizations can ensure that strategic outcomes align seamlessly with operational goals. Optimized customer and user experiences are achieved by analyzing customer behaviors to refine user journeys and eliminate friction points. For example, an e-commerce platform leveraged real-time observability data to enhance customer experiences, offering tailored product recommendations that led to a 35% increase in customer retention. Operational efficiency and sustainability are enhanced through end-to-end system visibility, which helps optimize resources and reduce costs. This includes enabling predictive autoscaling and rightsizing of cloud resources, contributing to sustainability goals. By adding AI-driven insights into the equation, organizations can harness precise answers upon which automation can be taken, therefore radically transforming application delivery and cloud operations processes. For example, a global logistics company implemented observability to manage its vast supply chain network, improving operational efficiency by 30%. Faster response times to logistics challenges increased coordination among business units. Agility and innovation enablement are achieved by streamlining DevOps and product cycles, which accelerates time-to-market. For example, organizations can increase app delivery speed when eliminating bottlenecks through automation and orchestration of DevOps pipelines. Strategic compliance and security focus on continuously tracking transactions, detecting anomalies, and mitigating cybersecurity risks. Deloitte and Dynatrace for better business Deloitte and Dynatrace have partnered to revolutionize observability for organizations by addressing the complexities of hybrid and multi-cloud environments. Through the Dynatrace AI-powered observability platform, which integrates deep monitoring, AI-driven operations (AIOps), and security automation, organizations gain accurate insights and efficient infrastructure management. Deloitte complements this with its extensive cloud expertise, developing custom observability frameworks that promote resilience, reliability, and innovation. The value of this partnership lies at the intersection of adjacent platforms, creating sophisticated solutions greater than the sum of their parts. As a leading global systems integrator, Deloitte builds on Dynatrace capabilities by seamlessly integrating with complementary technologies such as ServiceNow, AWS, and Red Hat. This synergy allows organizations to unlock unparalleled efficiencies, enhancing their ability to navigate and manage modern cloud-native ecosystems. The collaboration also adeptly manages the vast data produced by cloud-native systems, using predictive AI, business analytics, and automation to optimize system performance, meet technical standards like ISO 27001 and DORA,

Driving AI-powered observability to action Read More »

Gen Z faces a changing, and challenging, job market accelerated by AI

The July Jobs Report from Dice also shows that from the first half of 2024 to the first half of 2025, the number of job postings looking for candidates with six to nine years’ experience increased 20%, and postings for candidates with 10 or more years’ experience increased 17%. Meanwhile, job postings that were seeking candidates with zero to three years of experience declined by 3% — the only cohort to see a decline, says Zeile. Tanya Moore, chief people office of consultancy West Monroe, agrees the current job market for Gen Z is uncertain, and likens the current state of AI to the introduction of the internet, which eventually reshaped the way we work and live, impacting nearly every industry and career. “Even if it doesn’t happen overnight, AI is going to impact every industry and job role,” she says. “When I say I think Gen Z needs to be very prepared, I don’t think everybody has to suddenly become an AI engineer. But Gen Z has to be prepared mentally to be resilient, adaptable, and to be constantly learning because things will change.” source

Gen Z faces a changing, and challenging, job market accelerated by AI Read More »

Third-party risk management: Don’t get fired due to someone else’s failure

Third-party risk management (TPRM) has become a key concern for organizations. As organizations increasingly “outsource” many functions, tools, infrastructure, processes, and even staffing to external partners, the risks — to cybersecurity, compliance, reputation, finance, and operations — to your organization associated with these relationships have grown exponentially. Third-party risk covers a broad spectrum: from situations where a vendor, supplier, or service provider is compromised, granting attackers unauthorized access to your organization’s sensitive data; to disruptions caused by the downtime of a third-party tool your operations depend on; to poor vendor upgrade policies that result in widespread outages across your systems (remember the 2024 CrowdStrike patch incident). To illustrate this necessity for TPRM, IDC’s July 2025 SaaS Path report shows that about 20% of organizations experienced third-party data breaches in recent years with their SaaS providers. And those events can carry a huge financial impact. Delta Airlines, for instance, estimated the CrowdStrike outage cost it $500 million. source

Third-party risk management: Don’t get fired due to someone else’s failure Read More »

How enterprise leaders should prepare for the quantum future

This should cover internal systems, cloud services, supply chain interfaces and data in transit. Hybrid encryption models, which combine classical and post-quantum cryptography (PQC) schemes, can serve as interim solutions while standards mature. Governance functions must adapt by embedding quantum risk into enterprise risk registers, policy documentation and cybersecurity audits. 2. Workforce capability Quantum readiness requires informed leadership and cross-functional literacy. Many executive teams lack a shared understanding of quantum risks and potential applications. Without this, strategic planning becomes fragmented or delayed. Targeted education programmes for boards, legal teams, risk officers and engineers are essential. Skill development should correspond to role-specific needs. Engineers need training in cryptographic migration and hybrid implementation. Legal and compliance professionals must stay current with the evolving policy landscapes. Executives require context to inform investment decisions and drive governance reforms. Upskilling through academic partnerships or external certifications maintains capability as the field changes. 3. Strategic planning and governance Quantum readiness introduces a planning challenge not typically found in conventional technology initiatives. The development timeline is uncertain, impacts vary by sector and regulation is in flux. Effective governance requires organizations to define a posture. This might be observational, exploratory or proactive. The selected posture must then be embedded into strategic planning and decision-making frameworks. Planning should distinguish between short-term preparatory actions and longer-term integration. source

How enterprise leaders should prepare for the quantum future Read More »

Slalom: Building hyper-personalized connection with generative AI

Overview Over the past few years, much of the conversation around AI and generative AI has focused on productivity – which is understandable, considering the potential of these tools to accelerate workflows and automate defined tasks. However, that’s far from the full story. In episode 2 of The Art of the Possible podcast, Jennie Wong, Ph.D., Global Industry Director for Education at Slalom, and Patrick Frontiera, Higher Education Strategy Leader of IT and Campus Operations at AWS, explore an exciting, less-discussed use case: hyper-personalization. Together, AWS and Slalom are using AI to drive hyper-personalization projects that have fundamentally transformed operations for a diverse group of customers. UCLA Anderson School of Management, for example, has seen a staggering 130% increase in donations from alumni who received hyper-personalized, generative AI-driven emails compared to more traditional control emails. “The UCLA Anderson Advancement Team was already doing a certain level of personalization,” Wong said. “They were already using certain best practices. But [using generative AI], we essentially doubled down on behavioral science research in persuasion over the last few decades around how to make the most effective assets most likely to convert.” According to Frontiera, the success of this program came down to two factors:Project alignment Slalom’s ability to speak not just in terms of the technology, but also the desired business outcomes. “These are really two sides of the same coin,” Frontiera said, “and [generative AI] was critical in delivering something that the Advancement Office could benefit from and that would fit into their daily workflows.” Register Now source

Slalom: Building hyper-personalized connection with generative AI Read More »

From data to insights with Dynatrace Dashboards

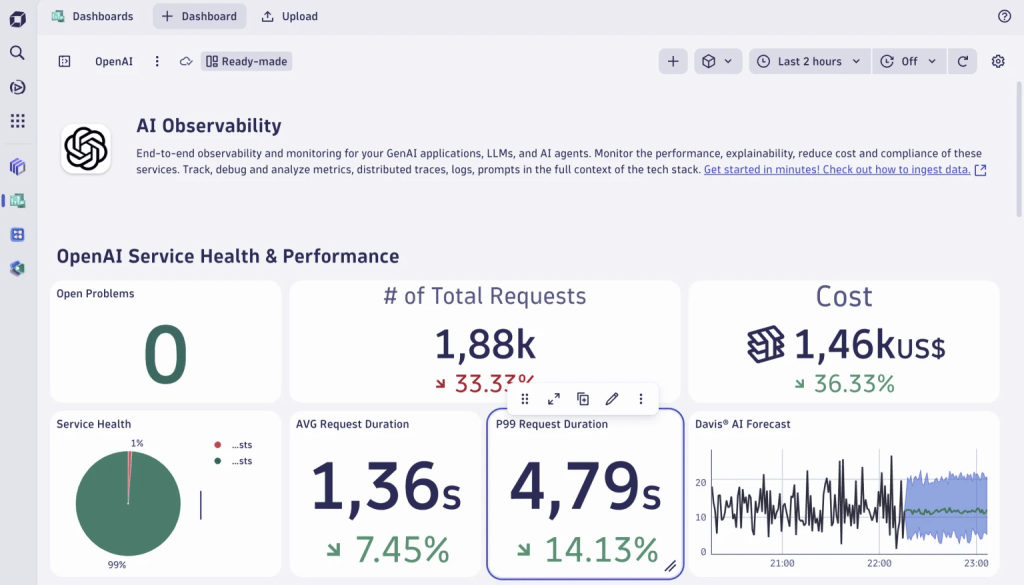
We’ll walk you through a real-world example of monitoring OpenAI APIs in production to show you what this looks like in action. In practice: Create a dashboard monitoring OpenAI LLM APIs Imagine you’re on a platform team at a SaaS company that recently integrated OpenAI to power features like smart search, summarization, or chatbots. With these capabilities now live, your next challenge is ensuring they perform reliably, scale efficiently, and stay within budget. This is where Dynatrace shines—helping you transform telemetry into insights that drive action. Let’s walk through all the steps to create just such a dashboard, and dig deeper to: Find and add (OpenAI telemetry) data with ease. Tailor visualizations to understand token usage, latency, and error metrics easily. See what matters: filter and segment data by LLM model, service, or environment. Predict and prevent issues: avoid model response slowdowns and cost spikes. Find and add (OpenAI telemetry) data with ease Creating a new dashboard begins with identifying and understanding the relevant data for your use case. Monitoring LLM APIs requires the visualization of key metrics like request volume, latency, or error rates per model. With Dashboards, exploring your data is intuitive, providing multiple ways to search for and analyze data. Start with a ready-made dashboard that provides instant insights. Explore data using a simple-to-use point-and-click interface—ideal for getting started by quickly adding tiles. Utilize the full power of Grail by writing your own DQL query or utilizing Davis CoPilot® to transform your natural language prompts into DQL queries. As an experienced Dynatrace user, you’re familiar with exploring data in context with our purpose-built apps like Kubernetes, Logs, or Distributed Traces, and how to add visualizations from those apps to your dashboards. Let’s look at some of these approaches in the following sections. Start the journey with ready-made dashboards You don’t have to start from scratch. Dynatrace offers many ready-made dashboards as part of Dynatrace® Apps and purpose-built extensions to serve dedicated use cases. As the leading observability solution for monitoring AI workloads, we offer dashboards for all major AI and LLM stacks, including agentic frameworks such as OpenAI, Anthropic, Amazon Bedrock, or NVIDIA. These dashboards provide instant value, whether you’re monitoring performance or debugging expensive prompts. By delivering real-time insights into request volume, latency, cost, and service health, they not only save you time but also create a solid foundation for tailoring their experience to your needs. Let’s start our journey by opening the ready-made dashboard for OpenAI and creating a copy of it. To follow along, locate the Dashboards app on the Dynatrace Playground. Figure 1. Duplicate the ready-made dashboard to customize it. Dynatrace Add further tiles to analyze token usage Next, let’s add another tile to visualize the overall prompt token usage by type: input vs. output for OpenAI services. From discussions with our platform observability team, we know that all relevant metrics sent to Dynatrace using OpenTelemetry are available as custom metrics prefixed with gen_ai. We add a metrics tile and type gen_ai into the search field. This instantly surfaces all related telemetry. A few clicks later, applying data splits and aggregations, we have two more tiles, demonstrating how simple it is to turn raw telemetry into actionable insights: A pie chart that shows the balance between input and output tokens A line chart that tracks how the usage evolves over time Figure 2. Visualizing overall prompt token usage. Dynatrace For further insights into the exploration and transformation possibilities in Dashboards, check out our blog post on transforming data into insights. Leverage the power of Dynatrace Grail Not sure where to start, which metric to use, or how to quickly advance with the power of Dynatrace Query Language (DQL) and Grail® data lakehouse? That’s where Davis CoPilot® comes in. Built directly into Dashboards and Notebooks, Davis CoPilot allows you to interact with your data using plain language—no need to write queries or know exact metric names. Just type something like Visualize token usage by input and output types, and the AI will help you instantly generate the appropriate query, taking you from question to insight in seconds. Figure 3. Use Davis CoPilot to create and visualize queries instantly. Dynatrace Tailor visualizations to easily understand token usage, latency, and errors As someone responsible for monitoring systems or ensuring service reliability, you know how important it is to get the right insights at a glance. Dynatrace helps you build intuitive dashboards that focus on what matters most: understanding your data and taking action on it. Once the data is set and a tile added, Dynatrace automatically suggests the most suitable visualization. For example, when tracking API token usage by type over time, a line chart is recommended to highlight trends and fluctuations. Figure 4. A suitable line chart visualization is automatically suggested. Dynatrace Dynatrace also applies other smart defaults based on the context of the visualized data. For example, when you add a metric that tracks the usage of example prompts and split it by the prompt name, sparklines are automatically included to show trends over time—no extra configuration needed. And if you’re already a power user, the newly added search speeds up your dashboard creation journey by offering a way to instantly jump to any configuration without the need to scroll around. But there’s a lot more that helps improve the user journey. We harmonized the settings of individual visualization types, ensuring that already defined configurations, such as color palettes or units, persist, even if you change the type. Figure 5. The settings of individual visualization types are enhanced and harmonized. Dynatrace We’ve also made many updates to the chart plotting features of our pre-existing visualizations. For example, the single value tile, which used to be a basic number display, is now a highly expressive component. You can now enrich the single value tile with icons, apply color thresholds to flag anomalies, add sparklines to show trends, and add value and trend labels that provide additional context for the charted value and give it meaning. Figure 6. The single value tile now also includes sparklines and other options. Dynatrace Plotting the values on a map benefits many signals. Consider displaying token usage or prompts issued per destination. The map component has a rich set of customization options—such

From data to insights with Dynatrace Dashboards Read More »

Why sustainability belongs on the CIO’s agenda

As societal issues such as climate change and inequality become more widely accepted as business responsibilities, sustainability has moved far beyond its previous home in facilities, operations, or supply chain teams. Today, sustainability is a board-level priority – and for some IT leaders, it’s now part of the job description. For George Michalitsianos, Vice President of Information Security at global manufacturing firm Ansell, contributing to the company’s net zero ambitions involves both “smaller” and “bigger” actions. “There are more traditional, tactical things that IT can do to help, like reducing electronics waste and recycling our devices,” he says. “But at the bigger end, we’re using AI to figure out our emissions, monitoring our processes and making them more efficient. There are areas where IT data and analytics can really help us innovate and meet our objectives.” IT leaders acting as key players in climate strategy is a relatively new phenomenon. But in a world of energy-intensive digital infrastructure and AI tools, it’s understandable that many CIOs feel they can no longer stay on the sidelines. Enterprise technology is now one of the largest contributors to enterprise emissions – accounting for up to 45% of Scope 2 emissions. Sergio Tagliapietra, VP of Information Technology at a global fashion brand, adds: “If we define sustainability as responsible resource use, then the rise of generative AI presents an immediate challenge. But while AI’s energy demands are concerning today, I’m optimistic that these technologies may eventually eliminate many of those abstraction layers, unlocking unprecedented efficiency.” The good news is that, with their oversight of technology and strategy, CIOs are in a powerful position to align sustainability with innovation, driving growth while advancing environmental and social progress. They can encourage sustainable practices, not at the cost of organizational performance, but as a complement to it. And with one of the most powerful levers for reducing emissions at their fingertips, CIOs’ influence on sustainability isn’t just growing – it’s essential. Lessons from Formula 1®: adapt rapidly, reduce emissions, improve inclusion Tata Communications is the Official Broadcast Connectivity Provider of Formula 1® When it comes to using technology to adapt in moments of disruption – and then turning that adaptation into long-term impact – Formula 1®’s shift to remote production stands out. For years, the sport relied on high-speed logistics and in-person technical teams traversing the globe. Large teams of people had to be physically present at 24 track locations across five continents over the course of the season. But when the pandemic hit, its intensive global travel model became untenable. So, with Tata Communications as a key partner, the Formula 1® team reengineered its operations, shifting to a remote production model. Thanks to a high-capacity global fiber network and ultra-low latency bandwidth, real-time feeds from racetracks could be transmitted back to a centralized UK hub in just 200 milliseconds. This allowed teams to broadcast events remotely without compromising performance, all while driving significant reductions in carbon emissions. So, what started as a crisis response quickly became a new standard. Today, much of the broadcast team remains remote, with live feeds, data, and telemetry streamed over Tata Communications’ global network. By reducing the need for constant international travel, Formula 1® created a more inclusive and diverse environment. And in an industry that’s already high-pressure, fostering more sustainable operations has also helped drive more people-friendly practices. “CIOs with the right mindset are uniquely positioned to drive sustainability without compromising performance,” says Dino Trevisani, Vice President and Head of the Americas Region at Tata Communications. “Just look at Formula 1® – they cut emissions and improved inclusion without sacrificing the world-class experience fans expect.” With the right partners guiding them towards smarter digital decisions, CIOs can devise creative ways to align sustainability priorities with the broader digital transformation strategy. And in the end, not only make their organizations greener, but also stronger, more resilient, and more inclusive. Measure everything Not every business runs a global sporting event, but every CIO does have the opportunity to rethink what really needs to happen in person. Leaders should ask themselves a few strategic questions: What processes can be digitized or centralized? Where can infrastructure be made more energy efficient? What’s the equivalent of “remote production” in our industry? One principle is undeniable: use digital tools to measure everything. And CIOs are best placed to turn that principle into practice, because IT holds another key sustainability advantage: visibility. From real-time analytics to systems monitoring, CIOs already oversee many of the tools needed to measure emissions and track energy use. These same capabilities can underpin enterprise-wide climate reporting, helping organizations move from ambition to action. As Ansell’s George Michalitsianos observes: “Being a manufacturing company, there are a lot of processes and ESG related data that we can collect and report on. That’s where IT and the business can partner together to meet that larger sustainability goal.” This isn’t about adding sustainability to the CIO’s plate – it’s about recognizing that the tools for change are already in their hands. They don’t need to become climate scientists, but they do need to understand the footprint of their infrastructure, the power of their data, and the influence of their decisions. And with the right mindset – and the right partners – CIOs can help lead the shift to a lower-carbon future.  Because sustainability isn’t just a story of supply chains and offsets. It’s also one of networks, smart IT strategy, and policies that result in more thoughtful enterprises. For more information click here. source

Why sustainability belongs on the CIO’s agenda Read More »

Driving lower barriers, higher returns in industrial AI

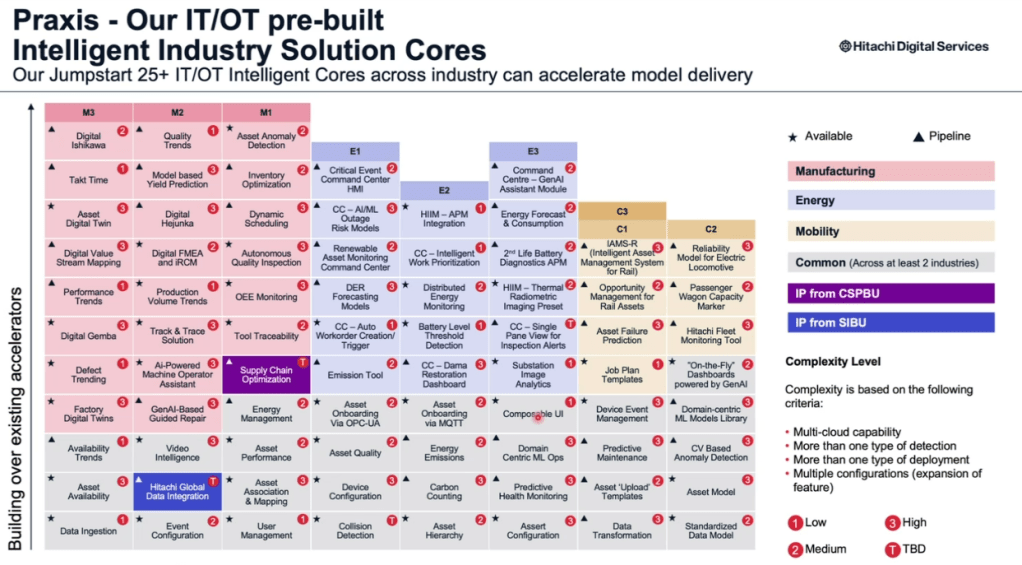
Although great strides have been made to overcome some of the most common digital obstacles to the adoption of AI, from data cleansing to bias detection, human skills barriers have proven to be the most persistent challenge. The nagging confluence of talent shortages and lackluster upskilling programs can leave organizations with little idea of where to begin to integrate AI, or how. This attention deficit typically leads to sporadic and siloed model development that can grow costly, quickly, and provide limited visibility into potential returns. While daunting to traditional AI adoption, such challenges can downright choke industrial AI development, which demands far more scrutiny. This was the concern that fueled the managed services group at Hitachi, to develop its pragmatic approach to industrial AI that views adoption from the inside out – by building AI accelerators for distinct disciplines within distinct industries – rather than bolting AI onto processes from the outside in. The effort quickly matured into an actual classification of industrial AI building blocks – a grid, not unlike the Periodic Table of Elements – of vertical and horizontal accelerators. With this approach, companies across energy, transportation, manufacturing, and beyond, are provided multiple points of entry for AI, the ability to scale, and a clear vision of the potential return on investment.  This was the making of the Praxis Library of industrial AI accelerators. Bringing order to adoption “The reason AI has not been widely adopted in the industrial sectors is that most companies don’t have the resources to build and train a custom model,” says Prem Balasubramanian, chief technology officer and head of AI at Hitachi Digital Services. “It is so costly, and it requires so many training cycles for it to become accurate enough to use in production, that people just don’t have the money or the patience to do it unless it provides tremendous value.”  Hitachi has taken the lessons from its custom industrial AI builds and vast domain expertise from across the company to create the Praxis Library, which includes accelerators for everything from asset digital twins and model-based yield prediction in manufacturing, to energy forecast and consumption and substation image analytics for utilities. It also includes cross-industry, “horizontal” AI accelerators for tasks like monitoring carbon output, tracking asset availability, and detecting collisions. client supplied-art The result? Dramatically faster and less expensive AI deployment. Although the accelerators must still be tailored to the unique needs of each organization, 40 to 50% of the development work has already been done, Balasubramanian says. Rather than investing significant time and money into AI experiments that may never yield a return on investment, he adds, organizations can opt for solutions with proven success in the field.  “We call it the ‘asset-ization’ of AI,” Balasubramanian says. “Every industrial application requires customization, but we’ve found the commonalities. That provides a jump start, and it’s going to accelerate and reduce the friction to AI adoption.” “We call it the ‘asset-ization’ of AI. Every industrial application requires customization, but we’ve found the commonalities. That provides a jump start, and it’s going to accelerate and reduce the friction to AI adoption.”–Prem Balasubramanian, chief technology officer and head of AI, Hitachi Digital Services Manifesting the library While the current AI hype cycle largely dates back to the fall 2022 public debut of ChatGPT, Hitachi has many years of experience standing up industrial AI solutions. Large language models (LLMs) like ChatGPT can be probabilistic, meaning that they can generate slightly different answers even if a user asks the exact same question multiple times. These models are also known to “hallucinate,” making up incorrect answers when they can’t find the necessary information in their training data. By contrast, Balasubramanian notes, industrial AI applications are largely deterministic, meaning that they pull exact answers from highly specialized training data. Many LLM users can tolerate occasional inaccuracies. However, industrial AI applications demand much higher accuracy, especially for use cases involving transportation, heavy machinery, or other scenarios where mistakes could jeopardize the safety of workers and/or the public – not too mention the potentially extensive cost of repairs. “Industrial AI doesn’t tolerate hallucinations,” Balasubramanian explains. “This is the kind of AI that is for mission-critical systems like trains and energy substations. In these use cases, similarity isn’t enough. The answer has to be the same, every time.” (For more on the criticality of industrial AI, read: “Industrial AI: Move fast, break nothing.”) In 2015, Hitachi partnered with a large logistics provider to build out an AI-powered preventive maintenance solution. At the time, truck breakdowns led to an average of two weeks of repair time, creating “huge” productivity losses across the company. With the new “Guided Repair” solution, the company was able to bring repair times down to under an hour. Afterward, the company turned to Hitachi for an AI solution to monitor its fleet (150,000-vehicles under this solution) in real time, gather data from on-board diagnostic (OBD) devices, and predict problems before they occur. The solution, which even generates automatic work orders with fault codes, helps the company get trucks back on the road within 48 hours, on average. And last year, it helped prevent about 90,000 trucks from breaking down in the first place, yielding multi-million-dollar savings annually for the logistics provider, Balasubramanian says. From there, Hitachi built a robust predictive maintenance framework for aircraft engines. While the aircraft engine and fleet management engagements are tailored to specific operational context—such as the type and volume of data collected or the timing of data transmission—the underlying principles of the two frameworks are consistent. These insights have been distilled into the Predictive Maintenance accelerator within the Praxis library, enabling organizations to jumpstart their own initiatives with a proven foundation. “The technical implementations may vary, but the strategic approach to solving predictive maintenance challenges is consistent,” says Balasubramanian. “By embedding our learnings into reference architectures and accelerators, we can empower customers to move faster and more confidently—without the burden of starting from scratch.” Cataloging a partner’s industrial expertise Looking ahead, Balasubramanian anticipates an

Driving lower barriers, higher returns in industrial AI Read More »

A 4-step framework for generative AI success

Rest Step 1: Test — start small to validate ideas Unlike the Lean Startup method, which focuses on “Build” as its first step, our framework opens with experimentation. In many cases, gen AI models are already “consumer-ready” and don’t require significant software development to get started. But before committing significant resources to an AI initiative, starting small, and validating the idea, is essential. We tried a few experiments in this phase, including the introduction of RestGPT to improve employee productivity. In our first release, we used ChatGPT’s “engine” running on enterprise infrastructure in a safe environment with data in our own separate tenant. To ensure we followed a controlled and structured approach, we established guardrails, including a responsible use policy where employees agreed to use gen AI in line with our risk and governance approach.  source

A 4-step framework for generative AI success Read More »