Pew Research Center

30% of Americans Consult Astrology, Tarot Cards or Fortune Tellers

A fortune teller arranges tarot cards on table. (Prathan Chorruangsak/Getty Images) How we did this Pew Research Center conducted this study to gauge Americans’ experiences with astrology, tarot cards and fortune tellers, and the role they play in people’s lives. For this analysis, we surveyed 9,593 U.S. adults from Oct. 21 to 27, 2024. Everyone who took part in this survey is a member of the Center’s American Trends Panel (ATP), a group of people recruited through national, random sampling of residential addresses who have agreed to take surveys regularly. This kind of recruitment gives nearly all U.S. adults a chance of selection. Surveys were conducted either online or by telephone with a live interviewer. The survey is weighted to be representative of the U.S. adult population by gender, race, ethnicity, partisan affiliation, education and other categories. Read more about the ATP’s methodology. Here are the questions used for this report, the topline and the survey methodology. Over the past decade, media reports have described rising popular interest in New Age practices such as astrology, tarot card reading and fortune-telling. These practices are frequently associated with young people, and they have developed their own social media cultures on TikTok and other platforms, especially during the period of social distancing brought on by the COVID-19 pandemic. So, how popular are these practices, and why do Americans engage in them? A fall 2024 Pew Research Center survey finds that 30% of U.S. adults say they consult astrology (or a horoscope), tarot cards or a fortune teller at least once a year, but most do so just for fun, and few Americans say they make major decisions based on what they learn along the way. Here are other key takeaways from the nationally representative survey of 9,593 U.S. adults. Despite recent attention to astrology, the number of Americans who believe in astrology doesn’t appear to have changed very much in recent years. On the new survey, 27% of U.S. adults say they “believe in astrology (the position of the stars and planets can affect people’s lives).” That is not significantly different from what we found when we asked an identical question in 2017 (29%). And, although the results of earlier surveys may not be directly comparable because of differences in methodology, Gallup polls from 1990 to 2005 consistently found that between 23% and 28% of Americans believed in astrology. On most questions we asked about these practices, there are big differences by age and gender. Younger adults – and especially younger women – are more likely to believe in astrology and to consult astrology or horoscopes. For example, 43% of women ages 18 to 49 say they believe in astrology. That compares with 27% of women ages 50 and older, 20% of men ages 18 to 49, and 16% of men who are 50 and older. Americans who identify as lesbian, gay, bisexual or transgender (LGBT) are especially likely to consult astrology or a horoscope, and tarot cards. About half of LGBT Americans (54%) consult astrology or a horoscope at least yearly – roughly twice the share among U.S. adults overall (28%). And LGBT women are more likely than LGBT men to consult astrology at least yearly (63% vs. 40%). In addition, 33% of LGBT adults say they consult tarot cards – making them three times as likely as U.S. adults overall to say this (11%). And 21% of LGBT Americans say that when they make major life decisions, they rely at least a little on what they’ve learned from astrology or a horoscope, tarot cards, or a fortune teller. While there is limited academic research on the topic, media publications focused on LGBTQ+ issues have described the prevalence of New Age practices in the LGBTQ+ community. Yet, most Americans who engage in astrology, tarot cards or fortune-telling say they do it for fun, rather than for insights or guidance on life decisions. Overall, 20% of U.S. adults say they engage in at least one of these activities mostly “just for fun,” while 10% say they do them mostly because they “believe the practices give them helpful insights.” Relatively few Americans make major life decisions based on what they learn from astrology, tarot cards or fortune tellers. Just 1% of U.S. adults say they rely a lot on what they have learned from these practices when making major life decisions. An additional 5% say they rely a little on what they have learned. Fewer than one-in-ten Americans engage in these practices on a weekly basis. While there are now abundant ways – both online and in person – to consult a horoscope, tarot cards and fortune tellers, just 6% of Americans report that they participate in one or more of these activities at least weekly. More (14%) say they engage monthly in at least one of these practices. Read on to learn more about how different demographic groups answer questions about: Belief in astrology Religiously affiliated Americans and religiously unaffiliated Americans are equally likely to believe in astrology (27% and 28%, respectively). (Religiously unaffiliated Americans are those who identify religiously as atheist, agnostic or “nothing in particular.”) But some religious groups are especially likely to believe that the position of stars and planets can affect people’s lives. About one-third or more of Black Protestants, Hispanic Catholics and adults who say their religion is “nothing in particular” say they believe in astrology. On the other hand, atheists, agnostics, White evangelical Protestants and Jewish Americans are less likely than the general public to say they believe in astrology. The survey included respondents of many other religious backgrounds, including members of the Church of Jesus Christ of Latter-day Saints (widely known as Mormons), Muslims, Hindus and Buddhists. But there are not enough respondents from these smaller groups to report on their answers separately. Views among demographic subgroups More advanced statistical analyses show that belief in astrology also varies significantly across demographic categories. We ran regression analyses to examine the independent effects of a number of factors – including gender,

30% of Americans Consult Astrology, Tarot Cards or Fortune Tellers Read More »

Israeli Public Is Increasingly Skeptical About Lasting Peace

An ultra-Orthodox Jewish man stands near the Western Wall in the Old City of Jerusalem on Aug. 9, 2024, with the Islamic Dome of the Rock seen in the background. (Hazem Bader/AFP via Getty Images) How we did this This Pew Research Center analysis explores Israeli attitudes on lasting peace with Palestinians, different parties’ commitment to peace, obstacles in the process, and the influence of international actors. It also covers their views of Israeli leaders, Palestinian leaders and the prospect of an independent Palestinian state – the likelihood of international recognition in the near future and whether Israel can coexist peacefully alongside it. The data is from a survey of 998 Israeli adults conducted face-to-face from Feb. 5 to March 11, 2025. Interviews were conducted in Hebrew and Arabic, and the survey is representative of the adult population ages 18 and older, excluding those in East Jerusalem and in outposts that are not sanctioned by the Israeli government. (The survey also did not cover the West Bank or Gaza.) The survey included an oversample of Arabs in Israel. It was subsequently weighted to be representative of the Israeli adult population with the following variables: gender by ethnicity, age by ethnicity, education, region, urbanicity and probability of selection of respondent. Throughout the report, we analyze respondents’ attitudes based on where they place themselves on an ideological scale. In Israel, we asked people to place themselves on a scale ranging from “Extreme left” to “Extreme right” and categorized them as being on the ideological left, center or right. Prior to 2024, combined totals were based on rounded topline figures. For all reports beginning in 2024, totals are based on unrounded topline figures, so combined totals might be different than in previous years. Refer to this year’s topline to see our new rounding procedures applied to past years’ data. Here are the questions used for the report, along with responses, and the survey methodology. More than a year into the Israel-Hamas war, Israelis express growing doubts about peace with Palestinians, according to a Pew Research Center survey. Research in the West Bank and Gaza Pew Research Center has polled the Palestinian territories in previous years, but we were unable to conduct fieldwork in Gaza or the West Bank for our February-March 2025 survey due to security concerns. We are actively investigating possibilities for both qualitative and quantitative research on public opinion in the region. The survey was conducted Feb. 5-March 11, 2025, among a nationally representative sample of 998 Israeli adults. It is the Center’s second annual survey in Israel since the start of the war on Oct. 7, 2023. The field period coincided with the most recent ceasefire between Israel and Hamas, and the survey was completed before hostilities resumed on March 18. Likelihood of peace We find that 21% of Israeli adults think Israel and a Palestinian state can coexist peacefully – the lowest percentage since we began asking this question in 2013. This share is down 14 percentage points since spring 2023, several months before the Israel-Hamas war started. The share of Jewish Israelis who think peaceful coexistence is possible is also low (16%). Arab Israelis are more optimistic (40%) about the possibility of an independent Palestinian state coexisting with Israel, a prospect often called a “two-state solution.” Commitment to peace A slim majority of adults in Israel (56%) say the Israeli people are committed to working toward lasting peace. But fewer think this is true of the Palestinian people (41%) or of the leadership on either side. About half of Israelis (47%) say their own government is very or somewhat committed to working toward lasting peace. A similar share (45%) say the Palestinian Authority is at least somewhat committed to seeking peace. Just 20% of Israelis say this about Hamas, the main organization at war with Israel in the Gaza Strip. Obstacles to peace Israelis see several things as at least minor obstacles to peace: the status of Jerusalem, Israeli settlements in the West Bank, conflict between the left and right in Israeli politics, and conflict between Hamas and Fatah on the Palestinian side. But the most frequently cited obstacle is a lack of trust between Israelis and Palestinians. Three-quarters of Israelis call this a major obstacle to lasting peace. International actors Israelis are skeptical about foreign involvement in efforts to facilitate lasting peace. They see the influence of several countries – as well as the United Nations – as harmful rather than helpful. The United States is an exception: 81% of Israelis say the U.S. is helpful in the work toward lasting peace between Israelis and Palestinians. Still, half of Israelis say U.S. President Donald Trump is favoring Israelis too much in his foreign relations, while 2% say he favors Palestinians too much and 42% say he favors each group the right amount. In the following report, we look more closely at how Israelis view: Related: How Americans view Israel and the Israel-Hamas war at the start of Trump’s second term Views of contested territories Israelis identify several contested territories as obstacles on the path to peace with the Palestinians. Seven-in-ten (70%) say the status of Jerusalem, a city that both Israelis and Palestinians claim as their capital, is a major obstacle. Roughly half (52%) say the same of surrounding Israeli settlements in the West Bank. The settlements are considered illegal under international law, though Israel disputes this claim – and among the Israeli public, more say the continued building of West Bank settlements helps the security of their country (44%) rather than hurts it (35%). As for Gaza, a third of Israelis believe Israel should govern the territory after the war, down from 40% in spring 2024. In particular, Israeli Jews and Israelis on the ideological right are less likely to say Israel should govern Gaza compared with last year. A smaller share of the Israeli public would rather let the people who live in Gaza decide who governs them (16%). And relatively few prefer a

Israeli Public Is Increasingly Skeptical About Lasting Peace Read More »

1. Views of the potential for lasting peace

About a fifth of Israelis (21%) say a way can be found for Israel and an independent Palestinian state to coexist peacefully, down from 26% last year. The share who take this stance has declined steadily over the past decade: 50% said peaceful coexistence was possible in 2013. Despite this pessimism about a “two-state solution,” 56% of Israelis surveyed say the Israeli people are very or somewhat committed to working toward lasting peace. Fewer (41%) say this about the Palestinian people. (Because the questions about commitment to peace were asked for the first time in the 2025 survey, we do not know how these opinions may have changed over time.) When it comes to leadership structures, 47% say the Israeli government is very or somewhat committed to lasting peace, and 45% feel the same about the Palestinian Authority. Far fewer Israelis (20%) see Hamas as committed to peace. In fact, a two-thirds majority say Hamas is not committed to peace at all. Can Israel and an independent Palestinian state coexist? Around one-in-five Israeli adults (21%) think a way can be found for Israel and an independent Palestinian state to coexist peacefully. Half think this is not possible, and another 19% volunteer that “it depends.” The share who think a two-state solution is possible has dropped 29 points since we first asked this question in 2013. In the shorter term, it’s fallen 14 points since spring 2023 (before the start of the Israel-Hamas war) and 5 points since spring 2024. Four-in-ten Israeli Arabs think peaceful coexistence is possible – more than double the 16% of Israeli Jews who say the same. The share of Arabs who believe coexistence can happen is down 9 points since 2024, bringing their level of confidence in a two-state solution closer to what it was in 2023. The share of Jews who believe coexistence is possible has not changed significantly since 2024. Around half of Israelis who place themselves on the ideological left (54%) say a way can be found for Israel and a Palestinian state to coexist, compared with 29% of Israelis in the center and 7% of those on the right. Among Jewish Israelis, a quarter of Hilonim say peaceful coexistence is possible – more than twice the share of Haredim and Datiim (9%) or Masortim (11%) who say this. Where would the independent Palestinian state be located? Israelis who said Israel and an independent Palestinian state can coexist or who volunteered “it depends” were asked a follow-up question: Would they expect the independent Palestinian state to be in the West Bank, the Gaza Strip or both? A sizable share of these respondents believe that the new Palestinian state would be in both the West Bank and Gaza. Fewer believe it would be only in Gaza or only in the West Bank. Still, only about a third of all Israeli adults overall gave a response to this question. Arab Israelis are more likely than Jewish Israelis to expect the Palestinian state to be in both Gaza and the West Bank. And Israelis on the left are more likely than those in the center or on the right to say the Palestinian state would be in both places. Who is committed to peace? More Israelis say the Israeli people are committed to working toward a lasting peace with the Palestinians than say they are not committed (56% vs. 39%). But opinions are reversed when it comes to the Palestinian people (41% committed vs. 54% not committed), including 40% who describe the Palestinian people as not committed to peace at all. Israelis are about evenly split on whether their government is committed to peace. About half (47%) say the Israeli government is very or somewhat committed, while a similar share (49%) say it’s not too or not at all committed. As for the Palestinian Authority, 45% of the Israeli public sees it as committed to peace, and about half says it is not (52%). A sizable share of Israelis (41%) say the Palestinian Authority is not committed to peace at all. One-in-five Israelis say Hamas is committed to lasting peace between the two groups. About three-quarters (72%) say Hamas is not committed to peace – including 67% who say the organization is not at all committed. Views by ethnicity A majority of Jewish Israelis (61%) say the Israeli people are committed to lasting peace, while 34% say the same of the Palestinian people. The opposite is true among Arab Israelis: 68% say Palestinians are committed to peace, while 35% say this about Israelis. When asked about leadership structures on each side, nearly three-quarters of Israeli Arabs believe the Palestinian Authority is committed to peace (73%), compared with 38% of Israeli Jews who hold this view. Inversely, Jews are much more likely than Arabs to say the Israeli government is committed to lasting peace (56% vs. 12%). Among both Israeli Jews and Israeli Arabs, about a quarter or fewer say Hamas is committed to lasting peace between Israelis and Palestinians. Views by ideology Israelis across the ideological spectrum are about equally likely to describe the Israeli people as committed to lasting peace. However, Israelis on the left (73%) are much more likely than those in the center (49%) or on the right (26%) to say the Palestinian people are committed to peace. In addition, Israelis on the left are more skeptical of their own government: A quarter say the Israeli government is committed to peace, compared with 47% of those in the center and 59% of those on the right. And left-leaning Israelis are much more likely to see the Palestinian Authority as committed to peace (79%) when compared with those in the center (57%) or on the right (27%). Regardless of their ideological leanings, Israelis generally agree that Hamas is not committed to peace between Israelis and Palestinians. A quarter or fewer in each group say this is the case. Views by Jewish religiousness Half or more Israeli Jews in each religious group say the

1. Views of the potential for lasting peace Read More »

4. Views of Israeli and Palestinian political leaders

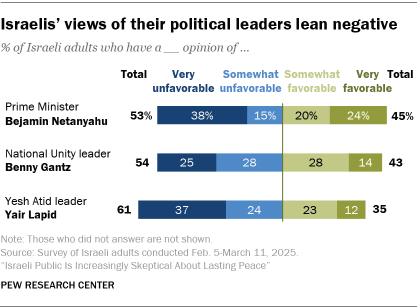
Over a year into the war with Hamas, Israelis express more negative than positive views of key political leaders in both Israel’s governing coalition and its political opposition. They are even more critical of Palestinian leaders. Israeli leaders Israelis express more negative than positive views of their country’s political leaders. Prime Minister Benjamin Netanyahu is viewed very or somewhat favorably by 45% of Israelis. Around half (53%) see him unfavorably, including 38% who say their opinion is very unfavorable. These assessments are largely unchanged from last year, which marked a high point in unfavorable views of Netanyahu since we first started asking the question in 2013. Benny Gantz – the leader of the National Unity opposition party who joined Netanyahu’s government at the start of the Israel-Hamas war, then resigned in June 2024 – is seen favorably by 43% of Israelis. Around half (54%) have an unfavorable view of him. Negative views of Gantz are up 10 points since last year. (The 2024 survey was fielded when Gantz was still part of the emergency government and a member of Israel’s war cabinet.) Yair Lapid, leader of the opposition in the Israeli Knesset and head of the centrist party Yesh Atid, is the least popular of the three leaders we asked about: 35% of Israelis have a favorable view of him and 61% have an unfavorable view, including 37% whose opinion is very unfavorable. Lapid performed similarly with the Israeli public in our 2024 survey. Related: Most people across 24 surveyed countries have negative views of Israel and Netanyahu Views by ethnicity Favorable views of Netanyahu are more common among Jewish Israelis than Arab Israelis by a large margin (55% vs. 8%). Israeli Jews are also more favorable than Israeli Arabs toward Gantz (44% vs. 35%), but the opposite is true for Lapid (31% vs. 49%). Views by Jewish religiousness Netanyahu is far more popular with Haredi and Dati Jews than with Masorti or Hiloni Jews. The share of Haredim and Datiim who favor him is more than triple the share of Hilonim who feel the same (86% vs. 23%). A smaller majority of Masortim have favorable views of Netanyahu (67%). Seven-in-ten Hilonim have a favorable view of Gantz, compared with 36% of Masortim and 17% of Haredim and Datiim. Lapid is even less popular with the most religiously observant Jews – only 6% of Haredi and Dati Jews feel positively toward him. Roughly a quarter of Masortim (24%) have a favorable view of the Knesset opposition leader, as do 54% of Hilonim. Views by ideology Netanyahu remains popular with his political base, favored by a 73% majority of those on the ideological right. This compares with 21% of those in the center and just 5% of Israelis on the left. Centrist politician Gantz is significantly less popular with the Israeli right (34%) than he is with the center (60%) or the left (52%). Lapid, also a centrist, is favored by 56% of those in the center and 66% of those on the left. A much smaller share of Israelis on the right (15%) see him in a positive light. Palestinian leaders Israelis tend to be more negative than positive in their assessments of Palestinian political leaders, too, but by wider margins. Large majorities of Israelis have unfavorable views of Palestinian Authority President Mahmoud Abbas, also known as Abu Mazen (85%), and of his fellow Fatah member Marwan Barghouti (80%), who has been imprisoned in Israel since 2002. The share who view Abbas negatively is down 4 points since 2024, while views of Barghouti have not changed significantly in that time. At least nine-in-ten Israeli Jews have unfavorable views of both men, and nearly seven-in-ten Israeli Arabs say this about Abbas. But only about a quarter of Israeli Arabs express an unfavorable opinion of Barghouti (23%), while 62% see him in a favorable light. source

4. Views of Israeli and Palestinian political leaders Read More »

1. Views of how much discrimination racial and ethnic groups in the U.S. face

Most Americans say there is at least some discrimination against Black, Hispanic and Asian people, while fewer than half say White people experience a lot of or some discrimination. These attitudes differ considerably across racial and ethnic groups. Read the overview of this report for Americans’ views of all 20 groups asked about on the survey. Overall, sizable majorities say Black people are subject to at least some discrimination. However, Black adults (70%) are far more likely than Hispanic (40%), Asian (39%) and White (28%) adults to say Black people face a lot of discrimination. Similarly, majorities across groups say Hispanic people face at least some discrimination in the U.S. But Hispanic and Black adults see higher amounts of discrimination against Hispanic people than White and Asian adults do. Majorities in each group also say that Asian people in the U.S. face a lot of or some discrimination. Still, Asian Americans are more likely to say Asian people experience discrimination (82% say a lot or some) than Black (69%), Hispanic (66%) and White Americans (64%) are. Relatively few Americans say White people face at least some discrimination, yet a larger share of White adults (45%) say this than Hispanic (27%), Black (24%) and Asian adults (20%). There are wide differences between Republicans and Democrats in their views of how much discrimination racial and ethnic groups experience. Democrats and Democratic-leaning independents are more much likely than Republicans and Republican leaners to say that Black, Hispanic and Asian people face discrimination: 94% of Democrats say Black people face at least some discrimination, compared with 54% of Republicans. 90% of Democrats say the same about Hispanic people, compared with 54% of Republicans. 83% of Democrats say Asian people face widespread discrimination, versus 51% of Republicans. By contrast, Republicans are far more likely than Democrats to say that White people face at least some discrimination (55% vs. 21%). Within the GOP, views of discrimination differ by race and ethnicity. Hispanic Republicans (65%) are more likely to say Hispanic people face at least some discrimination than do White Republicans (53%). Asian Republicans (71%) are more likely than either White or Hispanic Republicans to say Asian people face discrimination. And White Republicans (62%) are far more likely than Hispanic (39%) and Asian Republicans (35%) to say White people face a lot of or some discrimination. (There were not enough Black Republicans in the sample to report their views.) Democrats’ views of discrimination against racial and ethnic groups vary only modestly by race and ethnicity. Smaller shares of Americans now say there is at least some discrimination against Black, Hispanic and Asian people than last year, with the changes driven primarily by Republicans. The share saying Black people face at least some discrimination has declined from 80% to 74% since last year. Among Republicans, these views have declined from 66% to 54%, while among Democrats it remains largely unchanged (92% in 2024, 94% today). A similar pattern is evident in views of discrimination against Hispanic and Asian people in the U.S., with overall declines driven by shifts among Republicans. Republicans are also now less likely to say White people face at least some discrimination in American society (66% in 2024, 55% today). However, Republicans continue to be more than twice as likely as Democrats (21%) to say that White people face a lot of or some discrimination. source

1. Views of how much discrimination racial and ethnic groups in the U.S. face Read More »

5. Community, friends and LGBTQ spaces

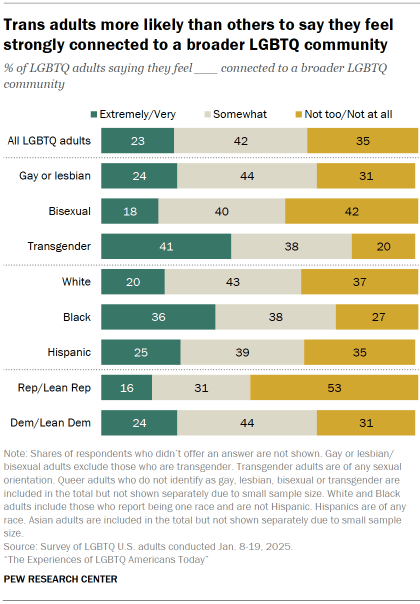
We asked LGBTQ Americans some questions to better understand: How connected they feel to a broader LGBTQ community How much they feel they have in common with people who are gay or lesbian, bisexual, transgender or straight How many of their friends are LGBTQ What LGBTQ people think of where they live How we defined LGBTQ groups for analysis Throughout this report, references to gay, lesbian and bisexual adults exclude those who are transgender. Transgender adults are of any sexual orientation (28% of trans adults we surveyed identify as gay or lesbian, 53% are bisexual, and 8% are straight). Queer adults are included in the total and in the gay or lesbian, bisexual, and trans totals if they indicated they also identify with these terms. The number of queer respondents who do not identify as gay or lesbian, bisexual, or trans is too small to analyze separately. Read Chapter 4 for more detail on the questions we asked related to sexual orientation and gender identity. About a quarter of LGBTQ adults (23%) say they feel extremely or very connected to a broader LGBTQ community. Another 42% feel somewhat connected, and 35% feel not too or not at all connected. Views on this vary by: LGBTQ group: 41% of transgender adults say they feel extremely or very connected, compared with 24% of gay or lesbian adults and 18% of bisexual adults. About four-in-ten bisexual adults (42%) say they feel not too or not at all connected, greater than the shares of gay or lesbian (31%) and transgender (20%) adults who say the same. Race and ethnicity: 36% of Black LGBTQ adults say they feel extremely or very connected, compared with 25% of Hispanic LGBTQ adults and 20% of White LGBTQ adults. (The number of Asian LGBTQ adults in the sample is too small to analyze separately.) Party: 24% of LGBTQ Democrats and Democratic leaners say they feel extremely or very connected, compared with 16% of LGBTQ Republicans and Republican leaners. In turn, Republicans are more likely than Democrats to say they feel not too or not at all connected to a broader LGBTQ community (53% vs. 31%). How much do LGBTQ adults think they have in common with certain groups? We asked LGBTQ adults how much they think they have in common with most people who are: Gay or lesbian Bisexual Transgender Straight Perhaps unsurprisingly, large shares of gay or lesbian (77%), bisexual (71%) and transgender (74%) adults say they have a great deal or a fair amount in common with most others in their own group. But views are more mixed when each is asked about other groups. Gay or lesbian adults Half of gay or lesbian adults say they have at least a fair amount in common with people who are bisexual (50%). A similar share (51%) say they have a lot in common with people who are straight. Fewer (28%) say they have a lot in common with people who are transgender. These figures are based on gay and lesbian adults who are not transgender. Bisexual adults A majority of bisexual adults (61%) say they have a great deal or a fair amount in common with most people who are straight. A smaller majority (55%) say they have at least a fair amount in common with gay or lesbian adults. And just 25% say the same about people who are transgender. These figures are based on bisexual adults who are not transgender. Transgender adults Majorities of transgender adults say they have a great deal or a fair amount in common with people who are gay or lesbian (63%) and people who are bisexual (63%). A far smaller share of trans adults (27%) say they have a lot in common with most people who are straight. It is important to note that transgender adults in our survey include those of any sexual orientation: 28% of trans adults also identify as gay or lesbian, 53% are bisexual, and 8% are straight. LGBTQ friendships Roughly three-in-ten LGBTQ adults (28%) say all or most of their friends are LGBTQ. Another 36% say that some of their friends are LGBTQ. And 35% say only a few, only one or none of their friends are. This varies by several factors: LGBTQ group: 63% of transgender adults say all or most of their friends are LGBTQ. This is far greater than shares of gay or lesbian (30%) and bisexual (20%) adults who say the same. Age: LGBTQ adults younger than 30 are more likely than their older counterparts to say all or most of their friends are LGBTQ (37% vs. 23% of those ages 30 and older). Party: LGBTQ Democrats are more likely than their Republican counterparts to say all or most of their friends are LGBTQ (31% vs. 13%). In fact, half of LGBTQ Republicans say only a few, only one or none of their friends are. How LGBTQ adults describe where they live and what is important to them in a local community About three-quarters of LGBTQ adults (74%) say it is extremely or very important to them personally to live somewhere that is welcoming of LGBTQ people (regardless of whether this describes where they currently live). Smaller shares say the same about living in a place that: Has community centers or organizations that are specifically for LGBTQ people (36% see this as highly important) Has a large LGBTQ population (32%) Has bars or cafes that are specifically for LGBTQ people (31%) Except for living in a place that is welcoming of LGBTQ people, more say each of these characteristics describes where they currently live than say they are highly important to them personally. Overall, 65% say their local community is welcoming of people who are LGBTQ. And half say there are bars or cafes specifically for LGBTQ people.   Similar shares say their area has community centers or organizations specifically for LGBTQ people (46%) and has a large LGBTQ population (44%). Views by LGBTQ group Transgender adults are more likely than gay,

5. Community, friends and LGBTQ spaces Read More »

1. Social acceptance for gay, lesbian, bisexual, nonbinary and transgender people

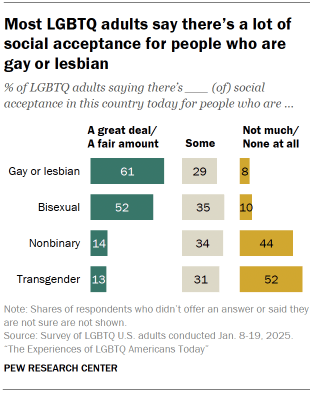
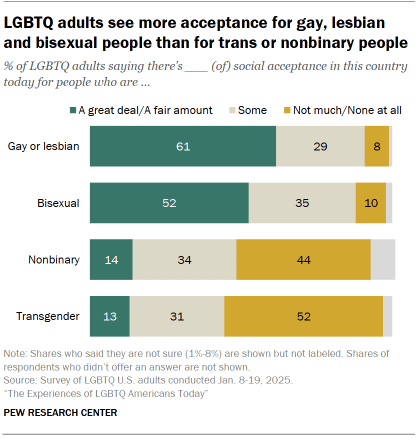
When it comes to how much social acceptance there is for people who are gay, lesbian, bisexual, nonbinary or transgender in the U.S. today, LGBTQ adults see the most acceptance for those who are gay or lesbian. How we defined LGBTQ groups for analysis Throughout this report, references to gay, lesbian and bisexual adults exclude those who are transgender. Transgender adults are of any sexual orientation (28% of trans adults we surveyed identify as gay or lesbian, 53% are bisexual, and 8% are straight). Queer adults are included in the total and in the gay or lesbian, bisexual, and trans totals if they indicated they also identify with these terms. The number of queer respondents who do not identify as gay or lesbian, bisexual, or trans is too small to analyze separately. Read Chapter 4 for more on the questions we asked related to sexual orientation and gender identity. A majority (61%) say there is a great deal or a fair amount of acceptance for people who are gay or lesbian. And about half (52%) say the same for those who are bisexual. Much smaller shares say there’s a great deal or a fair amount of acceptance for people who are nonbinary (14%) or transgender (13%). Roughly half (52%) say there’s not much or no acceptance at all for transgender people. And 44% say this is the case for nonbinary people. Views on social acceptance are mostly similar across LGBTQ groups. But those who are bisexual (56%) are more likely than those who are gay or lesbian (50%) or transgender (46%) to say there’s a lot of acceptance for bisexual people. LGBTQ adults who are nonbinary (57%) are more likely than LGBTQ men and women (43% each) to say there is not much or no acceptance at all for nonbinary people. LGBTQ Republicans are more likely than LGBTQ Democrats to say there’s a great deal or a fair amount of acceptance for people who are: Gay or lesbian (75% vs. 59%) Bisexual (70% vs. 49%) Nonbinary (20% vs. 12%) Transgender (25% vs. 11%) Views of social acceptance 10 years ago and 10 years from now We also asked LGBTQ adults their views of social acceptance today for people who are gay, lesbian, bisexual, nonbinary or transgender compared with 10 years ago, and how they expect things to be 10 years from now. What we found is that majorities see progress over the past decade and expect more acceptance in the future. Most LGBTQ adults say acceptance has increased for people who are: Gay or lesbian (82% say there’s a lot or somewhat more acceptance today than 10 years ago) Bisexual (76%) Transgender (66%) Nonbinary (64%) Even among those who say there isn’t much acceptance for these groups, majorities see more acceptance than in the past. Looking ahead, majorities also expect there to be even more social acceptance for these groups in the future. These shares range somewhat: 68% think there will be more acceptance for people who are gay or lesbian 10 years from now, while 59% say the same for nonbinary people. Views by age Similar shares of LGBTQ adults ages 18 to 49 and ages 50 and older say there’s at least somewhat more acceptance for people who are gay or lesbian compared with 10 years ago (83% and 82%). But younger LGBTQ adults are more likely than older ones to say there’s more acceptance today for people who are: Bisexual (78% vs. 69%) Transgender (68% vs. 57%) Nonbinary (68% vs. 52%) Impact of Obergefell v. Hodges on acceptance of same-sex couples In 2015, the Supreme Court ruled in Obergefell v. Hodges that the right to same-sex marriage is guaranteed across the U.S. We asked LGBTQ adults how they think this decision has impacted society’s acceptance of same-sex couples. Two-thirds of LGBTQ adults say the ruling made the country at least somewhat more accepting of same-sex couples. This includes 20% who say it has made people a lot more accepting. About a quarter (24%) say Obergfell made people neither more nor less accepting. And 9% say it made them a lot or somewhat less accepting of same-sex couples. Views by education LGBTQ adults with more education are more likely than those with less to say the ruling has made the country more accepting of same-sex couples. About three quarters (74%) of LGBTQ adults with at least a bachelor’s degree say this. By comparison, two-thirds of those with some college and 57% of those with a high school diploma or less education say the same. Views by party Among LGBTQ adults, Democrats are more likely than Republicans to say Obergfell has made the country more accepting of same-sex couples (70% vs. 55%). The difference is mostly driven by the shares saying the ruling has made the country somewhat more accepting of same-sex couples. Half of LGBTQ Democrats say this, compared with 39% among LGBTQ Republicans. There’s a much smaller difference between the shares saying Obergefell made people a lot more accepting (21% vs. 17%). Views by marital status Among LGBTQ adults who are in a committed same-sex relationship, similar shares of those who are married and those who are not say the ruling has made the country more accepting of same-sex couples (69% vs. 64%). However, those in a same-sex marriage are more likely than those who are in a same-sex relationship but not married to say Obergfell has made the country a lot more accepting of same-sex couples (26% vs. 17%). Factors that might increase social acceptance for LGBTQ people Majorities of LGBTQ adults say each of the following would do a great deal or a fair amount to increase acceptance of LGBTQ people: More religious leaders expressing support for LGBTQ people (61%) Having more openly LGBTQ politicians or public officials (60%) Having more openly LGBTQ celebrities, such as musicians and public figures (57%) Having more openly LGBTQ characters in movies, TV shows or books (55%) Fewer than half (45%) say having more companies and organizations expressing support

1. Social acceptance for gay, lesbian, bisexual, nonbinary and transgender people Read More »

The Experiences of LGBTQ Americans Today

About this project Pew Research Center conducted this study to understand the experiences of lesbian, gay, bisexual, transgender and queer adults in the United States 10 years after the Supreme Court’s Obergefell v. Hodges ruling legalized same-sex marriage nationwide. The survey explores how LGBTQ adults see the impact of Obergefell, how they view social acceptance for LGBTQ adults more broadly, and their personal experiences.   This project builds on a similar survey we conducted in 2013 among gay, lesbian, bisexual and transgender adults and a series of 2022 focus groups that explored the experiences of transgender and nonbinary adults. Together, studies like these provide a composite snapshot of American identity. They also address significant data gaps where internal diversity or emerging demographic or social identities are not represented in traditional data sources. For this study, we surveyed 3,959 LGBTQ U.S. adults from Jan. 8 to Jan. 19, 2025. The sample for this survey includes respondents from three different sources: Pew Research Center’s American Trends Panel (ATP), SSRS’ Opinion Panel (OP), and Ipsos’ Knowledge Panel (KP). The ATP is a group of people recruited through national, random sampling of residential addresses who have agreed to take surveys regularly.  The survey included oversamples of transgender adults and gay, lesbian or bisexual adults who are married or living with a partner from Ipsos’ KnowledgePanel. Like the ATP, the Opinion Panel and KnowledgePanel are probability-based online survey web panels recruited primarily through national, random sampling of residential addresses. Interviews were conducted either online or by telephone with a live interviewer. The survey is weighted to be representative of the U.S. LGBTQ adult population by gender, race, ethnicity, partisan affiliation, education and other factors. Here are the questions used for this analysis, the topline and the survey methodology. The Pew Research Center is a subsidiary of The Pew Charitable Trusts, its primary funder. This report was made possible with support from the Trusts and from the People & Voices Initiative. Terminology References to LGBTQ adults include adults who identify as lesbian, gay, bisexual, transgender or queer. Throughout this report, references to gay, lesbian and bisexual adults exclude those who are transgender. Transgender adults are of any sexual orientation. Queer adults are included in the total and in the gay or lesbian, bisexual, and trans totals if they indicated they also identify with these terms. The number of queer respondents who do not identify as gay or lesbian, bisexual, or trans is too small to analyze separately. Respondents indicated whether they are a man, a woman, nonbinary or describe their gender in some other way. They were asked separately to indicate their sexual orientation, if they are transgender and if they consider themselves queer. Gender was collected for analysis and not as a screening question. References to White, Black and Asian adults include only those who are not Hispanic and identify as only one race. Hispanics are of any race. The views and experiences of Asian Americans are not analyzed separately in this report due to sample limitations. References to those living in urban, suburban and rural areas are based on respondents’ answer to the following question: “How would you describe the community where you currently live? (1) urban, (2) suburban, (3) rural.” References to college graduates or people with a college degree comprise those with a bachelor’s degree or more education. “Some college” includes those with an associate degree and those who attended college but did not obtain a degree. “High school” refers to those who have a high school diploma or its equivalent, such as a General Educational Development (GED) certificate. All references to party affiliation include those who lean toward that party. Republicans include those who identify as Republicans and independents who lean toward the Republican Party. Democrats include those who identify as Democrats and independents who lean toward the Democratic Party. June 26, 2025, marks 10 years since the Supreme Court ruled in Obergefell v. Hodges that the right to same-sex marriage is guaranteed across the United States. The decision, which represented a major change in U.S. family law, reflected shifting public opinion on same-sex marriage. In 2004, 31% of Americans supported it, while 60% opposed. By 2015, 55% supported same-sex marriage, while 39% opposed. And support has continued to grow: In 2023, 63% of Americans expressed support for same-sex marriage. To explore how lesbian, gay, bisexual, transgender and queer adults see the impact of Obergefell, and how they view social acceptance for these groups more broadly, we surveyed 3,959 LGBTQ adults from Jan. 8 to Jan. 19, 2025. This study, which builds on a similar Pew Research Center survey conducted in 2013, also looks at the experiences of LGBTQ adults at a time when many in these groups see the political climate as unfavorable, especially for transgender people. In broad strokes, the survey finds some sense of social progress, as well as a feeling that acceptance will continue to grow. But it also highlights experiences with discrimination, especially among transgender adults. And it underscores the diversity of experiences across and within LGBTQ groups – from coming out, to navigating public spaces, to connecting with a broader LGBTQ community. How we defined LGBTQ groups for analysis Throughout this report, references to gay, lesbian and bisexual adults exclude those who are transgender. Transgender adults are of any sexual orientation (28% of trans adults we surveyed identify as gay or lesbian, 53% are bisexual, and 8% are straight). Queer adults are included in the total and in the gay or lesbian, bisexual, and trans totals if they indicated they also identify with these terms. The number of queer respondents who do not identify as gay or lesbian, bisexual, or trans is too small to analyze separately. Read Chapter 4 for more detail on the questions we asked related to sexual orientation and gender identity. Key findings LGBTQ adults have mixed views on how much social acceptance there is for certain groups. 61% of LGBTQ adults say there’s at least a fair amount of

The Experiences of LGBTQ Americans Today Read More »

3. Experiences with coming out as gay, lesbian, bisexual or transgender

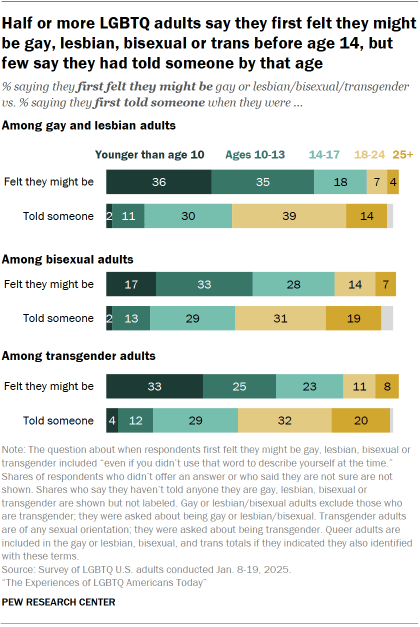
To better understand the coming out experiences of gay, lesbian, bisexual and transgender adults, we asked them: How old they were when they first felt they might be gay, lesbian, bisexual or trans, even if they didn’t use those words to describe themselves at the time. How old they were when they first told someone that they were or might be gay, lesbian, bisexual or trans. How we defined LGBTQ groups for analysis Throughout this report, references to gay, lesbian and bisexual adults exclude those who are transgender. Transgender adults are of any sexual orientation (28% of trans adults we surveyed identify as gay or lesbian, 53% are bisexual, and 8% are straight). Queer adults are included in the total and in the gay or lesbian, bisexual, and trans totals if they indicated they also identify with these terms. The number of queer respondents who do not identify as gay or lesbian, bisexual, or trans is too small to analyze separately. Read Chapter 4 for more on the questions we asked related to sexual orientation and gender identity. Half or more in each group say they knew they were gay, lesbian, bisexual or trans before age 14. Far fewer say they first told someone by that age. Gay and lesbian adults: 71% knew by age 14, while 13% had told someone by that age Bisexual adults: 50% vs. 15% Transgender adults: 58% vs. 16% Small shares ranging from 1% to 4% across these groups say they haven’t told anyone they are gay, lesbian, bisexual or trans.  These experiences vary by age and gender among gay, lesbian and bisexual adults. The number of transgender adults in the survey is too small to break out demographic groups. Experiences by age Gay or lesbian adults Most gay or lesbian adults across age groups say they first felt they might be gay or lesbian before age 14. But younger gay or lesbian adults are far more likely than their older counterparts to say they first came out to someone at an early age. Two-thirds of gay or lesbian adults ages 18 to 29 say they first told someone before they were 18, including 31% who say they first came out to someone at age 13 or younger. By comparison, 53% of those in their 30s and fewer than half of those in their 40s (37%), 50s (32%) or ages 60 and older (24%) say they had told someone by the time they were 18. Few in these groups say they came out to someone when they were 13 or younger. Bisexual adults There are more pronounced age differences among bisexual adults on these questions. A majority of those ages 18 to 29 (57%) and 51% of those in their 30s say they first felt they might be bisexual at age 13 or younger. Smaller shares of those in their 40s (39%) or ages 50 and older (32%) say the same. (The two oldest age categories are combined for bisexual adults due to sample size limitations.) Some 56% of bisexual adults ages 18 to 29 say they had told someone by the time they were 18. This compares with 42% of bisexual adults in their 30s, 32% of those in their 40s, and 17% of those ages 50 and older. Experiences by gender Gay or lesbian adults About eight-in-ten gay men (78%) say they first felt they might be gay at age 13 or earlier, including 40% who say they were first aware of their sexual orientation before age 10. Smaller shares of gay or lesbian women (53%) say they first felt they might be gay or lesbian at age 13 or younger, with 29% saying this happened before age 10. Men and women give similar answers when asked at what age they first came out to someone. About four-in-ten each say this happened by age 18. Bisexual adults Among bisexual adults, women are more likely than men to say they first felt they might be bisexual at an early age: 53% of bisexual women say this happened at age 13 or younger, with 19% saying they first felt they might be bisexual before age 10. 39% of bisexual men say they first felt they might be bisexual before age 14, with 11% saying this happened before age 10. Bisexual women (50%) are about twice as likely as bisexual men (24%) to say they had come out to someone by the time they turned 18. And 18% of bisexual women – compared with 5% of bisexual men – say this happened at age 13 or younger. Roughly one-in-ten bisexual men (12%) say they haven’t told anyone about their sexual orientation. This is the case for only 2% of bisexual women. Experiences of bisexual adults in a committed relationship About nine-in-ten bisexual adults who are in a committed relationship, including those who are married or living with a partner, say their partner knows they are bisexual. Among those in a different-sex relationship (sometimes referred to as an opposite-sex relationship), women are more likely than men to say their partner knows they are bisexual (93% vs. 69%). Overall, 87% of bisexual women in a committed relationship say their spouse or partner is a man. And 77% of partnered bisexual men are in a relationship with a woman. There aren’t enough bisexual adults in same-sex relationships in the sample to look at men and women separately. source

3. Experiences with coming out as gay, lesbian, bisexual or transgender Read More »

Video: How religious are young Americans today?

Young adults today are less religious than older adults by traditional measures. But when it comes to spirituality, the differences between young adults and older people are smaller. Watch the video to learn about religion and spirituality among young adults. Learn more about the study at pewresearch.org/rls. Publications from the Religious Landscape Study source

Video: How religious are young Americans today? Read More »