Pew Research Center

How Much Discrimination Do Americans Say Groups Face in the U.S.?

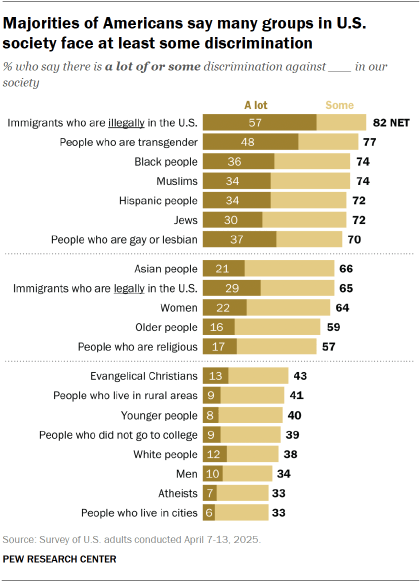
How we did this Pew Research Center conducted this study to understand how Americans view discrimination against various racial, ethnic, gender, religious and other groups in the U.S. Note: Some groups are too small demographically to yield sufficient sample in this survey to report their views of discrimination against people like them, such as Jews, Muslims and people who are gay, lesbian or transgender. For this analysis, we surveyed 3,589 adults from April 7 to April 13, 2025. Everyone who took part in this survey is a member of the Center’s American Trends Panel (ATP), a group of people recruited through national, random sampling of residential addresses who have agreed to take surveys regularly. This kind of recruitment gives nearly all U.S. adults a chance of selection. Interviews were conducted either online or by telephone with a live interviewer. The survey is weighted to be representative of the U.S. adult population by gender, race, ethnicity, partisan affiliation, education and other factors. Read more about the ATP’s methodology. Here are the questions used for this report, the topline and the survey methodology. Large majorities of Americans say numerous groups in the United States face at least some discrimination, including immigrants, transgender people and members of different racial and religious groups. About eight-in-ten (82%) say immigrants who are in the U.S. illegally experience a lot of or some discrimination – including 57% who say they face a lot of discrimination, according to a new Pew Research Center survey of U.S. adults. That is the highest share for any group among 20 included in the survey. Still, there is a widespread belief that many other societal groups also are discriminated against: 77% say people who are transgender face at least some discrimination, with 48% saying this group experiences a lot of discrimination. 74% say Muslims in the U.S. face a lot of or some discrimination, while a similar share (72%) say Jews face at least some discrimination. Roughly a third say there is a lot of discrimination against those in each of these groups. Nearly three-quarters of Americans say Black people (74%) and Hispanic people (72%) face at least some discrimination. About two-thirds (66%) say Asian people face a lot of or some discrimination. While there is a widespread perception that immigrants who are in the U.S. illegally face discrimination, 65% say immigrants who are legally in this country also face a lot of or some bias. 70% say people who are gay or lesbian encounter at least some discrimination. There is also variation in perceptions of discrimination across other demographic categories: Women and men. Nearly two-thirds of adults (64%) say women face at least some discrimination, with far fewer (34%) saying the same about men. Religious groups. A 57% majority of adults say people who are religious are subject to a lot of or some discrimination; just a third say atheists in the U.S. face at least some bias. When asked about specific religious groups, far fewer Americans (43%) say evangelical Christians face a lot of or some discrimination than say this about either Muslims (74%) or Jews (72%). Age groups. A much larger share of the public says older people (59%) than younger people (40%) face at least some discrimination in the U.S. Where people live. Fewer than half of Americans say that people living in rural areas or city dwellers face a lot of or some discrimination. But a larger share say rural residents are subject to at least some discrimination (41%) than say this about people living in cities (33%). These are among the key findings of a national Pew Research Center survey of 3,589 U.S. adults conducted April 7-13, 2025. The survey also finds that perceptions of discrimination against racial and ethnic groups – Black people, Hispanic people, Asian people and White people – have declined over the past year. These changes have been largely driven by Republicans and Republican-leaning independents. There have been virtually no changes in the views of Democrats and Democratic leaners over this period. Republicans and Democrats continue to have very different views of how much discrimination many groups face in the U.S. While there have been some shifts since last year, the partisan patterns are consistent.  Democrats are more likely than Republicans to say most of the groups asked about face at least some discrimination. But there are exceptions among certain groups. Groups that Republicans are more likely than Democrats to say experience a lot of or some discrimination: White people (55% of Republicans vs. 21% of Democrats) Evangelical Christians (57% vs. 31%) Men (42% vs. 27%) People who are religious (63% vs. 51%) Democrats are more likely than Republicans to say that 15 of 20 groups included in the survey face a lot of or some discrimination. These are the widest differences: People who are gay or lesbian (90% of Democrats vs. 50% of Republicans) Black people (94% vs. 54%) Immigrants who are in the U.S. legally (84% vs. 45%) Hispanic people (90% vs. 54%) Women (80% vs. 47%) Partisan differences extend to how much discrimination various groups face. For instance, while majorities in both partisan coalitions (94% of Democrats, 69% of Republicans) say that people who are in the U.S. illegally face at least some discrimination, Democrats are about twice as likely as Republicans to say they face a lot of discrimination (75% vs. 37%). Similarly, majorities of Republicans and Democrats say transgender people and Muslims in the U.S. face at least some discrimination. But in both cases, far larger shares of Democrats than Republicans say they face a lot of discrimination. For some groups, however, there is little to no partisan gap in these perceptions. Sizable majorities in both parties (77% of Democrats, 69% of Republicans) say Jews in the U.S. face at least some bias, including about three-in-ten in each party who say Jews face a lot of discrimination. And Democrats (44%) and Republicans (39%) are about equally likely to say people in rural areas face discrimination. Declining

How Much Discrimination Do Americans Say Groups Face in the U.S.? Read More »
3. Views of how much discrimination transgender people, gay and lesbian people, women and men face in the U.S.

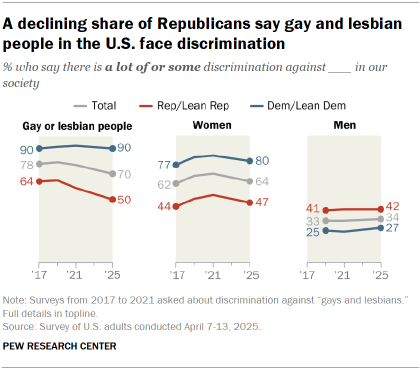
Nearly eight-in-ten Americans (77%) say there is a lot of (48%) or some (30%) discrimination against transgender people in society. And seven-in-ten Americans say there is a lot of or some discrimination in society against people who are gay or lesbian. Read the overview of this report for Americans’ views of all 20 groups asked about on the survey. Nearly two-thirds (64%) say women face at least some discrimination, while far fewer (34%) say men face a lot of or some discrimination. There are wide partisan differences in these views: People who are gay or lesbian Republicans and GOP leaners are now less likely to say people who are gay or lesbian face at least some discrimination (50%) than in 2021 (59%) or 2017 (64%). Democrats and Democratic leaners (90%) overwhelmingly continue to say people who are gay or lesbian experience a lot of or some discrimination. People who are transgender About nine-in-ten Democrats (91%) and six-in-ten Republicans (63%) say people who are transgender face at least some discrimination. Democrats are far more likely than Republicans to say transgender people experience a lot of discrimination (70% vs. 26%). This is the first year that discrimination against transgender people in U.S. society was asked about in this list. Women and men Nearly twice as many Americans say women face at least some discrimination in society than say this about men (64% vs. 34%, respectively). Democrats (80%) continue to be much more likely than Republicans (47%) to say women face a lot of or some discrimination. By contrast, Republicans (42%) are more likely than Democrats (27%) to say men face these levels of discrimination. These views have not changed much in recent years. Women are more likely than men to say women in society face a lot of or some discrimination, and this pattern holds within each party. Nearly three-quarters of women (72%) say there is at least some discrimination against women, while a narrower majority of men (54%) say the same. There are gender differences in both parties, but they are more pronounced among Republicans. 85% of Democratic women and 74% of Democratic men say women face at least some discrimination. A smaller majority of Republican women (57%) say women face discrimination, while 38% of Republican men say the same. The pattern is reversed for views of discrimination against men: 51% of Republican men say men in society face at least some discrimination. Much smaller shares of Republican women (31%), Democratic men (28%) and Democratic women (26%) have the same view. source

3. Views of how much discrimination transgender people, gay and lesbian people, women and men face in the U.S. Read More »

What Web Browsing Data Tells Us About How AI Appears Online

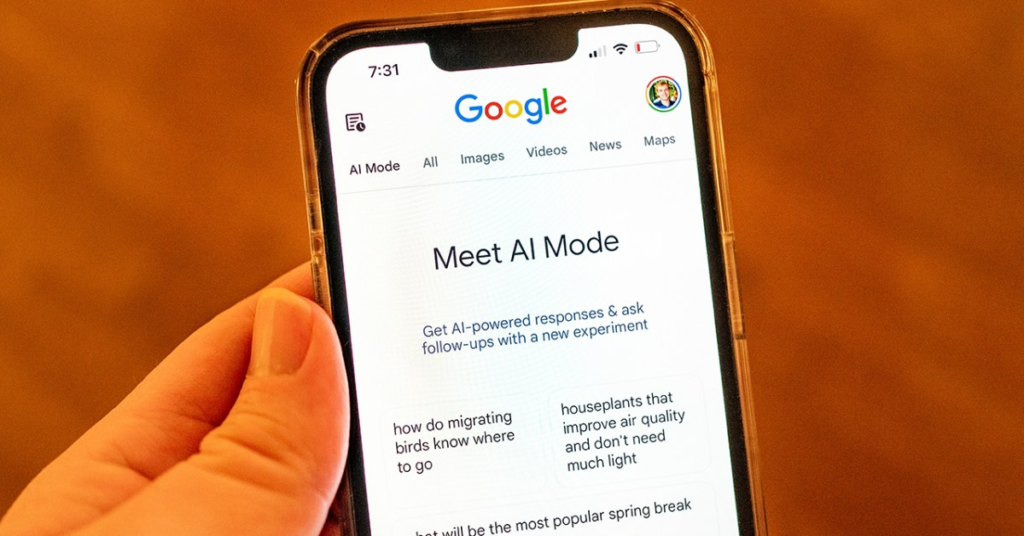
An iPhone displays Google AI Mode, an experimental search mode that uses artificial intelligence and large language models to generate interactive search results, on March 24, 2025. (Smith Collection/Gado via Getty Images) How we did this The goal of this study is to better understand how, where and in what context Americans are encountering artificial intelligence as they browse the web. For this analysis, we purchased the March 2025 web browsing data of 900 U.S. adults. Each respondent is a member of KnowledgePanel Digital, an online survey panel whose respondents agree to install an app that tracks their online browsing behavior. For each respondent, we received a list of all the URLs they visited using a web browser on a tracked device during the March 1-31, 2025, study period. For each of these approximately 2.5 million visits to 1.1 million unique URLs, we ran an automated script that retrieved the text a visitor to that URL might see, along with the page title and description. First, we wanted to see how many of these URLs mention AI anywhere on the page. To do that, we checked if the page text included any on a long list of AI-related terms (refer to the Appendix for the full list of terms). This is our broadest possible measure of whether a page mentions AI or offers some sort of AI functionality. It captures anything from a website for a generative AI tool like chatgpt.com, to a website with a single reference to AI on the page. In addition to this broad read on how many webpages mention AI at all, we also wanted to see how many mention AI more prominently or indicate an active interest in AI on the part of the visitor. Some examples might include searches for AI-related terms on a search engine, or visits to sites like: A generative AI tool such as chatgpt.com A news article that focuses on or extensively discusses AI-related issues A page for a product or service that extensively discusses its AI features To identify these pages, we trained a model to indicate whether each page that mentioned AI did so in an incidental context or in a more substantive context along the lines of those listed above. Although this study is based on the actual webpages respondents visited, it does have limitations that should be taken into consideration when interpreting its findings. First, the respondents were required to download a VPN to register personal devices for use in this study. As such, browsing on work devices or other untracked devices they might use to access the internet may not be captured. Second, the data only covers activity in web browsers, not other applications. Third, it does not include real-time algorithmically curated content (like the “For You” pages on X or TikTok) or pages that require a login to access. As artificial intelligence (AI) advances rapidly and becomes increasingly commonplace in online spaces, the American public has shown a clear wariness about its potential impact on individuals and society. Public opinion polling can help us understand Americans’ broad usage patterns and attitudes about AI, but we have less insight into what they see and read about this technology as they go about their daily online lives. To help shed light on this, we examined roughly 2.5 million webpage visits to 1.1 million unique URLs from a group of 900 U.S. adults who agreed to share their March 2025 browsing data. Here are our main findings about how ordinary internet users are crossing paths with AI-related tools and content in their online browsing habits: Most respondents encountered at least some AI-related content during the month – although most references were not especially prominent or in-depth. The vast majority (93%) visited at least one page that mentioned AI, even if that mention was brief or unrelated to the main focus of the page. This share drops substantially for the subset of pages that primarily focus on AI – like the website of an AI chatbot, or a news article that extensively discusses AI-related issues. Around half of all respondents (49%) visited one such page during the month, though the typical person who looked at this type of content did so only a handful of times. This pattern is found across several different types of web browsing activity, including querying search engines, reading the news and shopping online. A small share of respondents used search engines to get information about AI. One-in-ten conducted an AI-related query on a search engine during the month. But more often, search engines were a source for material generated by AI.The vast majority of respondents conducted a search using a search engine like Google. And for 58% of respondents, at least one of these searches produced an AI-generated summary along with the traditional search results. Some 13% of respondents visited a website for an AI tool like a chatbot, image generator or other generative AI tool. To the extent that respondents visit news pages mentioning AI, such pages don’t typically discuss the technology at length. Around half of all respondents (52%) visited at least one page from a news outlet that contained an AI-related term. But most of these articles only mentioned AI in passing – for example, a brief reference to an AI company in a story about the stock market, or an AI-related term in a sidebar to the main article. A far smaller share of respondents (8%) visited a news article in which AI was discussed in depth or was the primary focus of the story. Respondents tended to visit pages that describe AI using generic terms, brand names, marketing language and product descriptions. The most common AI-related terms were broad references like “AI” or “artificial intelligence.” Other relatively common terms included “ChatGPT” and “OpenAI;” references to products “powered,” “assisted” or “enhanced” by AI; and “AI images” or “AI image generator.” To be sure, these findings paint only a partial picture of all the ways Americans might encounter

What Web Browsing Data Tells Us About How AI Appears Online Read More »

Appendix: AI keywords used in this study

A webpage was classified as containing an AI mention if it had at least one of the following keywords. These keywords were detected using regular expression matching, included common variants and were not case sensitive, unless noted otherwise. AI or A.I. (case sensitive) BERT or RoBERTa or roBERTa (case sensitive) GPT (including GPT 3, 4, 4o, 4o1 or 4o3) LLM(s) or Large Language Model(s) or Language Model(s) NLP or Nature Language Processing X.AI or xAI (case sensitive) Grok (including Grok 1, 1.5, 2 or 3) AI Assistant AI Governance or AI Policy AI-Assisted or AI Assisted AI-Enhanced or AI Enhanced AI-Powered or AI Powered AI Regulation or AI Regulatory Compliance AI For Good or AI For Social Good AI Image Generator or AI Image(s) AI Overview AI Prompt or Prompt Engineering AI Summary AI Solution(s) Algorithm(s) Alibaba Cloud AI Anthropic Amazon AI or Amazon Alexa AWS Machine Learning Apple Machine Learning or Core ML Apple Intelligence Artificial Intelligence AI Translation or Automatic Language Translation Azure AI Baidu AI Bias in AI or Algorithmic Bias Bing AI Character.AI or Character AI or CharacterAI Chatbot(s) or Chat bot(s) or AI Chat ChatGPT or Chat GPT Claude AI (including Claude 2, 2.1, 3, 3.5, Sonnet, 3.5 Sonnet, Haiku, 3.5 Haiku, Opus or 3.7) Cognitive Computing Computer Vision Contextual Embedding Copilot Answer Deep Learning DeepFake(s) or Deep Fake(s) DeepMind DeepSeek (including DeepSeek LLM, MoE, Math, V2, V3 or R1) DALL·E or DALL-E or DALLE Ethical Tech or Responsible Tech or Ethical AI or Responsible AI or Ethics in AI Explainable AI Facebook AI or Meta AI Feature Engineering Fine-tuned Model or Fine-tuning a Model Generative Model or Generative AI Generative Adversarial Network(s) Gemini AI or Google Gemini Global AI Google AI or Google Brain Team or Google Brain or TensorFlow Healthcare AI or AI in Healthcare Huawei HiAI Hyperparameter Tuning IBM Watson (case sensitive) Intel AI Knowledge Graph LLaMA (case sensitive) Meta Llama or Code Llama (including Llama 2, 3, 3.1, 3.2 or 3.3) Machine Intelligence or Machine Learning Microsoft AI or Microsoft Copilot MidJourney Neural Network(s) NotebookLM or Notebook LM NVIDIA or NVIDIA AI OpenAI or Open AI (including OpenAI o1, o1-mini, o3 or o3-mini) Oracle AI Perplexity.AI or Perplexity AI or PerplexityAI Pre-trained Model(s) Predictive Analytics or Predictive Modeling or Predictive Modelling Qwen (including Qwen 7B, 72B, 1.8B, 2, 2-Math, 2.5, VL, VL2, Audio or LLM) QwQ or QwQ-2.5 or QwQ 2.5 Reinforcement Learning Robotic Process Automation Retrieval Augmented Generation Salesforce Einstein SAP Leonardo or Leonardo AI (case sensitive) Self-Attention Mechanism Semantic Analysis Sequence Modeling Stable Diffusion Summary by Copilot Supervised Learning Tencent AI TensorRT or Tensor.Art Transfer Learning Unsupervised Learning Workforce Automation source

Appendix: AI keywords used in this study Read More »

2. Views of how much discrimination Muslims, Jews, evangelicals and atheists face

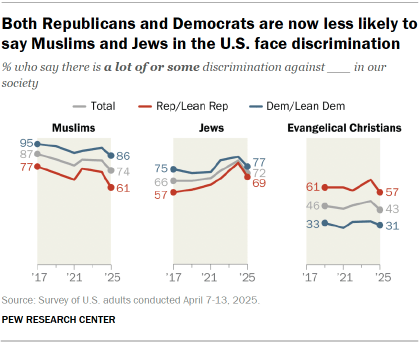
Compared with last year, perceptions of discrimination against Jews and Muslims have declined among both Republicans and Democrats (including independents who lean toward each party). There also has been a modest decrease in the share of the public saying evangelical Christians face at least some discrimination, largely due to a change among Republicans. Read the overview of this report for Americans’ views of all 20 groups asked about on the survey. Muslims The share of Americans who say there is at least some discrimination against Muslims in the U.S. is now lower than at any point since Pew Research Center first asked this question eight years ago – 74% say this today, down from 82% last year and 87% in 2017. The share saying there is a lot of discrimination against Muslims has dropped 10 percentage points over the last year (from 44% then to 34% today). The decline has come among both Republicans and Democrats, though Democrats continue to be more likely than Republicans to say Muslims face at least some discrimination in our society. Jews The share of Americans who say there is at least some discrimination against Jews has declined 10 points since last year – from 82% to 72% – though it remains higher than in 2017 to 2021. The share saying Jews experience a lot of discrimination is also down 10 points from last year (from 40% to 30%). There continue to be relatively modest partisan differences in views of discrimination against Jews in the U.S.: 77% of Democrats and 69% of Republicans say Jews are experiencing a lot of or some discrimination. Evangelical Christians 57% of Republicans say evangelical Christians face at least some discrimination, down from 67% in 2024. Democrats are far less likely to perceive discrimination against evangelical Christians: 31% say this group experiences at least some discrimination, virtually unchanged from a year ago. Atheists A third of U.S. adults say atheists face at least some discrimination. Democrats (41%) are much more likely than Republicans (24%) to say atheists experience at lot of or some discrimination. People who are religious A majority of Americans (57%) say people who are religious face a lot of (17%) or some (40%) discrimination. Republicans (63%) are more likely than Democrats (51%) to say religious people experience at least some discrimination. source

2. Views of how much discrimination Muslims, Jews, evangelicals and atheists face Read More »

What Is News?

How Americans decide what ‘news’ means to them – and how it fits into their lives in the digital era May 13, 2025 Table of Contents Table of Contents Table of Contents Table of Contents Measuring people’s news habits and attitudes has long been a key part of Pew Research Center’s efforts to understand American society. Our surveys regularly ask Americans how closely they are following the news, where they get their news and how much they trust the news they see. But as people are exposed to more information from more sources than ever before and lines blur between entertainment, commentary and other types of content, these questions are not as straightforward as they once were. This unique study from the Pew-Knight Initiative explores the question: What is “news” to Americans – and what isn’t? The Pew-Knight Initiative supports new research on how Americans absorb civic information, form beliefs and identities, and engage in their communities. Pew Research Center is a nonpartisan, nonadvocacy fact tank that informs the public about the issues, attitudes and trends shaping the world. Knight Foundation is a social investor committed to supporting informed and engaged communities. Learn more > How we did this In studying Americans’ news habits, we often allow the public to define “news” for themselves. But this may not be as straightforward in the digital age as it once was. The goal of this Pew-Knight Initiative study is to explore what “news” means to Americans today. We used three different methodologies to investigate this complex question: a qualitative online discussion board with 57 U.S. adults, a nationally representative survey of 9,482 U.S. adults conducted through Pew Research Center’s American Trends Panel (ATP), and on-the-record, in-depth interviews with 13 journalists and editors. Discussion board and interview responses were lightly edited for spelling, punctuation and clarity. Online discussion board An online discussion board is a digital qualitative research methodology that allows participants to share opinions, engage in multimedia activities and respond to posted topics in a private, asynchronous environment. An online discussion board was moderated by the research firm PSB Insights with 57 U.S. adults from Aug. 26 to 30, 2024. These discussions are not nationally representative, and the results are not framed in quantitative terms. Participants logged onto a virtual platform called Qualzy at their own pace for three days over a week. Moderators probed responses and asked follow-up questions within the platform to understand participants’ underlying emotions and motivations. PSB Insights recruited participants using quotas for age, party affiliation, education, race and ethnicity, community type (urban, suburban or rural) and self-reported news engagement level. All participants had to have daily access to a computer or mobile device with high-speed internet access and a working webcam. Fifty-seven participants completed all activities, yielding a 95% response rate from the 60 participants initially recruited. To learn more, refer to the detailed methodology and an accompanying Decoded blog post. Survey Respondents were asked questions expanding on our findings from the online discussion board, including to what extent they would consider different topics and sources to be news; which factors are most important when people think about what news is to them; how important it is that news sources share respondents’ political views; and how Americans react emotionally to the news they get. The survey portion of this analysis was conducted from March 10 to 16, 2025, among 9,482 U.S. adults. Everyone who took part in this survey is a member of the Center’s American Trends Panel (ATP), a group of people recruited through national, random sampling of residential addresses who have agreed to take surveys regularly. This kind of recruitment gives nearly all U.S. adults a chance of selection. Interviews were conducted either online or by telephone with a live interviewer. The survey is weighted to be representative of the U.S. adult population by gender, race, ethnicity, partisan affiliation, education and other factors. Read more about the ATP’s methodology. Here are the questions used for this analysis, the topline and the survey methodology.  Journalist interviews We conducted a series of individual on-the-record, in-depth interviews from July 18 to Sept. 6, 2024, with 13 journalists and editors at varying levels of editorial leadership. The interviews explored their perspectives on audiences’ understandings of news, as well as how these shifts are impacting news organizations. Participants were recruited to represent a variety of news platforms, journalistic approaches, geographic focuses, audiences, business models and demographics. Each interview was held via phone for around 20 to 40 minutes. The detailed methodology includes a full list of participants and the interview guide. This is a Pew Research Center analysis from the Pew-Knight Initiative, a research program funded jointly by The Pew Charitable Trusts and the John S. and James L. Knight Foundation. Find related reports online at https://www.pewresearch.org/pew-knight/. Before the rise of digital and social media, researchers had long approached the question of what news is from the journalist perspective. Ideas of news were often tied to the institution of journalism, and journalists defined news and determined what was newsworthy. “News” was considered information produced and packaged within news organizations for a passive audience, with emphasis (particularly in the United States) placed on a particular tone, a set of values and the idea of journalism playing a civic role in promoting an informed public. “I think there’s been this huge democratization where the institutions have lost the power they had to control what people saw and watched.” –Ben Smith, editor-in-chief, Semafor In the digital age, researchers – including Pew Research Center – increasingly study news from the audience perspective, what some have deemed an “audience turn.” Using this approach, the concept of news is not necessarily tied to professional journalism, and audiences, rather than journalists, determine what is news. The results of this study capture these changing dynamics of news consumption in the U.S. The journalists and editors we interviewed agree that in the digital age, the power to define news has largely shifted from media gatekeepers to the general public. And discussions with everyday Americans

What Is News? Read More »

Video: How common are spiritual beliefs in the U.S.?

The Religious Landscape Study (RLS) – conducted in 2007, 2014 and 2023-24 – surveys more than 35,000 Americans in all 50 states and the District of Columbia about their religious affiliations, beliefs and practices. In this video, we dive into the impact spirituality has on Americans and how it overlaps with and differs from religiousness. Learn more about the study at pewresearch.org/rls. Publications from the Religious Landscape Study source

Video: How common are spiritual beliefs in the U.S.? Read More »

5. Religious importance and religious affiliation

“How important is religion in your life?” and “What is your current religion?” are two survey questions that have long been used to measure religiousness in individuals and societies. By these benchmarks, the world’s most religious countries are mostly in the Middle East, South and Southeast Asia, sub-Saharan Africa and Latin America. For example, about nine-in-ten adults in Kenya and Sri Lanka say religion is very important in their lives, and virtually all adults in both places identify with a religion. Meanwhile, societies in Europe, East Asia, Australia and Canada tend to show lower levels of religiousness. In Japan, for instance, fewer than half of adults (44%) identify with a religion, and just 7% say religion is very important to them. In general, younger adults (people ages 18 to 34) are less likely than the oldest adults we surveyed (ages 50 and older) to say religion is very important in their lives. Likewise, younger adults are less likely to identify with any religion. In many of the places we surveyed, people with less education are more likely than others to say that religion is very important in their lives and to identify with a religion. There also is a gender gap on these questions in some countries, with women more likely than men to say religion is very important to them personally. In some places, women also are more likely than men to be religiously affiliated. How important is religion in your life? In a dozen of the 36 countries surveyed, about three-quarters or more of adults say religion is very important in their lives. People who live in South and Southeast Asia, as well as in Africa, are among the most likely to feel this way. In Bangladesh, for example, nearly everyone we surveyed (97%) said religion is very important to them. At the same time, there also are roughly a dozen countries where only about one-quarter or fewer of adults say religion is very important in their lives. Many of these countries are in Europe and East Asia. For example, just 18% of French and South Korean adults ascribe a lot of personal importance to religion. The United States, Israel and Argentina fall roughly in the middle of the countries surveyed: 38% of Americans say religion is very important in their lives, as do 37% of both Israelis and Argentinians. Views by religion Muslims are consistently among the most likely to say religion is very important in their lives. In every country with a sample of Muslims large enough to analyze separately, at least half of Muslims say religion is very important to them. In many of these places, nine-in-ten or more Muslims express that sentiment. Large shares of Hindus also tend to say religion is personally very important. In India, for instance, 82% of Hindus say this. However, Hindu Americans (24%) are much less likely than Hindus living in India, Bangladesh and Sri Lanka to place a lot of importance on religion. These are the only countries with enough Hindu respondents to break out their views separately. In general, the share of Christians who say religion is very important in their lives also ranges widely around the world. In a few countries, the vast majority of Christians say religion is very important in their lives; this includes Christians in Kenya (92%), the Philippines (88%) and Brazil (87%). Much smaller majorities feel the same in Chile (56%) and the U.S. (55%). And in Sweden (12%) and Hungary (9%), relatively few Christians view religion as personally very important. Religiously unaffiliated adults – people who describe themselves as atheist, agnostic or “nothing in particular” when asked about their religion – are consistently the least likely in each country to say religion is very important in their lives. In most places, 5% or fewer of the religiously unaffiliated population feels this way. For example, in Italy, only 3% of unaffiliated adults say this. Still, in four countries – Brazil, Colombia, Peru and South Africa – at least a quarter of religiously unaffiliated adults say religion is personally very important to them. Views by gender In general, women are somewhat more likely than men to say that religion is very important in their lives. For example, one-third of Italian women see religion as personally very important, compared with 20% of Italian men. And, in Sri Lanka, women are slightly more likely than men to hold this view (93% vs. 87%). Bangladesh is the only country in the survey where men are more likely than women to say religion is very important in their lives (98% vs. 95%). This general pattern echoes our previous research on the gender gap in religion around the world. Views by education In most countries surveyed, people who have more education are less likely than other adults to say religion is very important to them. In Greece, for example, 20% of adults who have completed schooling beyond a secondary education say religion is very important in their lives. Meanwhile, 36% of Greeks with less schooling feel this way about religion. (Secondary education is equivalent to high school in the U.S.) Religious affiliation In nearly every country surveyed, having a religion is more common than not having one. And in 14 countries, religious affiliation is almost universal, with 95% or more of adults saying they identify with a religion. These countries tend to have clear religious majorities. For instance, most people in Bangladesh identify as Muslims, most in Sri Lanka identify as Buddhists, and most Indians are Hindus. Likewise, nearly eight-in-ten Israelis are Jewish, and almost all Filipinos are Christian. Countries with high affiliation rates are concentrated in South and Southeast Asia, Africa and the Middle East. On the other hand, countries with substantial shares of religiously unaffiliated people are mostly in Europe, East Asia and the Americas. In countries with large unaffiliated populations, Christians often make up the largest affiliated group. However, there are some exceptions. In Singapore, a quarter of adults are Muslim, and nearly a

5. Religious importance and religious affiliation Read More »

1. God, spirits and the natural world

In most of the three dozen countries surveyed, large majorities say they believe in God. Smaller majorities of adults in most countries also say that “there is something spiritual beyond the natural world, even if we cannot see it.” Similarly, half or more adults in most places surveyed believe that animals “can have spirits or spiritual energies.” Many people also say that parts of nature can have spiritual energies, while far fewer globally say that certain objects (such as crystals, jewels or stones) can have spirits. Our survey also finds that: In general, vast majorities of Hindus, Muslims and Christians believe in God. Within each country surveyed, Christians are generally the religious group most likely to believe in something spiritual beyond the natural world. Most Hindus believe that animals and parts of nature can have spiritual energies. Adults with less education are more likely than others to believe in God. But those with less education are less likely to say there is something spiritual beyond the natural world. People who pray daily are more likely than those who pray less often to believe in God and, separately, to say there is something spiritual beyond the natural world. Women – particularly those in European and other high-income countries – are somewhat more likely to hold the beliefs discussed in this chapter. For instance, women are more likely than men to say they believe in God and that parts of nature can have spiritual energies. Belief in God Across the countries surveyed, most people say they believe in God. Indeed, a median of 83% across the 35 countries analyzed say this. Belief in God is particularly common in sub-Saharan Africa and Latin America, where around nine-in-ten or more adults in each country say they believe in God. Additionally, virtually all adults in Bangladesh (100%), Indonesia (100%), the Philippines (99%), Malaysia (98%), India (97%) and Turkey (96%) share this belief. East Asia and Europe tend to have much smaller shares of adults who say they believe in God. For example, just around half of Dutch adults say this. Views by religion Belief in God is particularly high among Muslims and Hindus. Across the countries with enough Muslims and Hindus to analyze, almost all adults in each group say they believe in God. Large shares of Christians in most countries also say they believe in God. However, in Sweden, a relatively small majority of Christians (58%) believe in God. And while large majorities of Buddhists in Singapore (78%) and Sri Lanka (77%) express a belief in God, fewer than half of South Korean Buddhists do so (45%). Across the countries surveyed, the religiously unaffiliated – people who identify as atheist, agnostic or “nothing in particular”– are consistently the least likely to say they believe in God. Still, majorities of the unaffiliated in Latin America and South Africa believe in God. This includes 92% of Brazil’s religiously unaffiliated population. Views by age In general, adults ages 50 and older are more likely than those under 35 to say they believe in God. This divide is largest in Hungary and Italy. In Hungary, a clear majority of the oldest adults (72%) believe in God, compared with fewer than half of adults under 35 (44%). Meanwhile, in the U.S., 85% of adults ages 50 and older say they believe in God, while 66% of adults under 35 express the same belief. Views by education In more than a dozen countries, adults with higher levels of education are less likely than other adults to believe in God. For example, 64% of Israelis with a postsecondary education say they believe in God, compared with 83% of Israeli adults who have no more than a secondary education (the equivalent of high school in the United States). Spirits in animals Most adults surveyed believe that animals can have spirits or spiritual energies, with a 35-country median of 62%. This includes roughly eight-in-ten adults in India (83%), Greece (82%) and Turkey (81%). Only in a handful of countries do fewer than half of adults say animals can have spirits or spiritual energies: Poland (43%), Kenya (42%), South Korea (42%), Bangladesh (40%) and Spain (36%). Views by religion In general, similar shares of religiously unaffiliated adults (also known as religious “nones”) and Christians in each country say that animals can have spirits. In Greece, for instance, about eight-in-ten adults – among both Christians and the unaffiliated population – say this. And in the United Kingdom, about half in each group believes that animals can have spiritual energies. But in a handful of countries, the religiously unaffiliated are more likely than Christians to say that animals can have spiritual energies. For example, 85% of Chileans who do not identify with any religion say this, compared with 73% of Chilean Christians. Muslims in different countries vary widely on this question, from a high of 88% of Israeli Muslims who say animals can have spirits to a low of 37% of Bangladeshi Muslims who share this view. In all three countries with enough Hindus to analyze separately – Bangladesh, India and Sri Lanka – a large majority of Hindus say that animals can have spirits or spiritual energies. Views by age In general, the youngest adults are more likely than the oldest to say animals can have spirits. In Peru, about three-quarters of adults ages 18 to 34 (77%) say this, compared with only a slim majority of adults ages 50 and older (56%). This division across age groups is the opposite of the pattern that exists on belief in God, where the oldest age group is more likely to believe than the youngest. For a broader discussion about how age interacts with measures of spirituality and religion, read the Overview of this report. Spirits in nature In about half of the countries surveyed, most respondents say that parts of nature (such as mountains, rivers or trees) can have spirits or spiritual energies. This belief is particularly common in Southeast Asia and Latin America. For

1. God, spirits and the natural world Read More »

Appendix: Detailed chart

ABOUT PEW RESEARCH CENTER Pew Research Center is a nonpartisan, nonadvocacy fact tank that informs the public about the issues, attitudes and trends shaping the world. It does not take policy positions. The Center conducts public opinion polling, demographic research, computational social science research and other data-driven research. Pew Research Center is a subsidiary of The Pew Charitable Trusts, its primary funder. source

Appendix: Detailed chart Read More »