Pew Research Center

Believing in Spirits and Life After Death Is Common Around the World

(Handini Atmodiwiryo/Getty Images) How we did this Pew Research Center conducted this survey to measure the prevalence of a variety of religious and spiritual beliefs and practices around the world. The survey included some questions grounded in the Christian, Jewish and Muslim traditions, as well as some questions with roots in Buddhism, Hinduism and other Asian faiths. We wanted to see how widely such beliefs and practices are shared by people in different regions and different religious groups, including those who don’t affiliate with any religion. This report is based on surveys conducted in 36 countries on six continents. The countries have a wide array of religious traditions. Some have Christian, Muslim or Jewish majorities, while others have Hindu or Buddhist majorities. A few are quite religiously mixed, and some have large shares of people who are religiously unaffiliated. Outside the United States, this report draws on nationally representative surveys of 41,503 adults conducted from Jan. 5 to May 22, 2024. All surveys were conducted over the phone with adults in Canada, France, Germany, Greece, Italy, Japan, Malaysia, the Netherlands, Singapore, South Korea, Spain, Sweden and the United Kingdom. Surveys were conducted face-to-face in Argentina, Bangladesh, Brazil, Chile, Colombia, Ghana, Hungary, India, Indonesia, Israel, Kenya, Mexico, Nigeria, Peru, the Philippines, Poland, South Africa, Sri Lanka, Thailand, Tunisia and Turkey. In Australia, we used a mixed-mode, probability-based online panel. For the U.S., data comes from respondents contacted in three separate survey waves in 2023 or 2024: 11,201 respondents were surveyed from July 31 to Aug. 6, 2023, via Pew Research Center’s American Trends Panel (ATP), an online survey panel recruited through national random sampling of residential addresses, which gives nearly all U.S. adults a chance of selection. Read more about the ATP’s methodology. 12,693 respondents were surveyed from Feb. 13 to 25, 2024. Most of the respondents (10,642) in this survey are members of the ATP, and nearly all these panelists also participated in the ATP survey that concluded in Aug. 2023. The remaining U.S. respondents (2,051) in this wave are members of three other panels: the Ipsos KnowledgePanel, the NORC Amerispeak Panel and the SSRS Opinion Panel. All three are national survey panels recruited through random sampling (not “opt-in” polls). We used these additional panels to ensure that the survey would have enough Jewish and Muslim respondents to be able to report on their views. In addition, U.S. data for a few questions comes from 36,908 respondents surveyed from July 17, 2023, to March 4, 2024, as part of the Center’s latest Religious Landscape Study (RLS). This survey was conducted mainly online and on paper, while 3% opted to complete the interview on the telephone. The RLS was made possible by The Pew Charitable Trusts, which received support from the Lilly Endowment Inc., Templeton Religion Trust, The Arthur Vining Davis Foundations and the M.J. Murdock Charitable Trust. This report was produced by Pew Research Center as part of the Pew-Templeton Global Religious Futures project, which analyzes religious change and its impact on societies around the world. Funding for the Global Religious Futures project comes from The Pew Charitable Trusts and the John Templeton Foundation (grant 63095). This publication does not necessarily reflect the views of the John Templeton Foundation. Here are the questions and responses used for this report (including information about the U.S. source used for each question), along with the survey methodology. Belief in life after death is widespread around the globe, as is the belief that spirits can reside in animals and in parts of nature such as mountains, rivers or trees, according to a Pew Research Center survey of three dozen countries with a wide range of religious traditions. Moreover, the new survey shows that younger adults are at least as likely as older adults to hold these spiritual beliefs – unlike belief in God, which tends to be more common among older people, globally. Over the last two decades, we’ve conducted surveys about religion and spirituality in more than 100 countries and territories. But in this survey, for the first time, we asked more than 50,000 people across six continents about some beliefs and practices that we previously had explored only in Asia or the United States. This allows us to draw a fuller picture of spirituality around the world. Some of the concepts we asked about have roots in specific religious traditions – such as Judaism, Christianity and Islam, Hinduism and Buddhism, or Asian folk religions. Others are associated with less formal religious traditions that some people might label “New Age.” We find that adults around the world – often across religious and geographic boundaries – share many of the beliefs and practices we asked about. For example, majorities of adults in most countries surveyed say that animals can have spirits or spiritual energies. This includes 83% of adults in India, which has a Hindu majority. It also includes 81% in Muslim-majority Turkey, 76% in Christian-majority Argentina and 70% in Israel, the world’s only country with a Jewish majority. Many people around the world also believe that parts of nature (such as mountains, rivers or trees) can have spirits or spiritual energies. This belief is voiced by nearly three-quarters of adults in Christian-majority Chile (74%) and Buddhist-majority Thailand (73%), and by 57% in Muslim-majority Indonesia. The U.S. falls somewhere in the middle of the countries surveyed on these questions: 57% of U.S. adults believe that animals can have spirits, while 48% say the same about mountains, rivers or trees. (Around six-in-ten U.S. adults identify as Christian, and about three-in-ten are religiously unaffiliated.) In general, people around the world are much less likely to say that certain objects (such as crystals, jewels or stones) can have spiritual energies. In some countries where large segments of the population do not identify with any religion, belief in spiritual forces nevertheless is fairly common. In Japan, for example, 53% of adults say that animals can have spirits, and 56% say that parts of nature can have spiritual energies – even

Believing in Spirits and Life After Death Is Common Around the World Read More »

Americans’ Trust in One Another

Americans trust each other less than they did a few decades ago. The share of adults who said “most people can be trusted” declined from 46% in 1972 to 34% in 2018, according to the General Social Survey. In a 2023-24 Pew Research Center poll, an identical 34% said most people can be trusted. Who says most people can be trusted? Social trust seems to be rooted partly in personal experience. People learn to trust others based on how they themselves have been treated. But scarring events that reduce trust – like losing a job or experiencing discrimination – may happen to people in some groups more often than others, leading to differences in trust across society. Racial and ethnic differences persist even after we take income, education, partisanship, age and other factors into account. Previous research shows that collective as well as individual experiences with racial discrimination can have a lasting impact on levels of trust.   Why does trust matter? On the one hand, common sense tells us that people sometimes can be too trusting – falling prey to scams, for example. And distrust can be a rational response to a life full of hardship. On the other hand, trust is the oil that lubricates the frictions of daily life. Trust makes it easier for people to work together to solve problems. It is beneficial for the economy because it’s related to confidence that other people will respect contracts, repay loans and behave honestly. And higher trust is associated with better-functioning democratic institutions.  In short, overall levels of social trust seem to go hand in hand with many features of a healthy society, creating a “virtuous circle.” (Though, as with any circular set of attitudes and behaviors, it’s difficult to say what is cause and what is effect.) A Pew Research Center survey from March 2025 offers a few examples. Americans who express trust in others are more likely to say they would help their friends and neighbors in various ways. Trust also plays a role in how people stay abreast of what’s happening around them. Americans who trust others are more likely than those who don’t to trust the information they get from friends, family and acquaintances. This kind of word-of-mouth news is now the most common source of local news for Americans. Also, trust in other people is associated with trust in institutions and experts. For example, people with lower levels of social trust tend to express less confidence in national news organizations, local news outlets, public school principals, the police and the federal government. While few U.S. adults trust the government in Washington much at all these days, Americans who say most people can be trusted are twice as likely to say the federal government can be trusted most of the time (22% vs. 11%). However, there is no consensus on whether declines in institutional trust lead to declines in social trust, or vice versa. Trust may offer some personal benefits, too. People who say most people can be trusted report greater life satisfaction than those who say you can’t be too careful. They tend to report being happier, more satisfied with their health and more likely to describe their family life as excellent or very good. Where is trust highest? Some parts of the United States stand out for higher – or lower – levels of trust. Take, for example, New Hampshire, Oregon and Utah. In these states, close to half of adults say “most people can be trusted.” But the share of people in some other states – like Alabama, Arkansas, Louisiana, Mississippi and West Virginia – who say “most people can be trusted” is about half of that in the highest trusting states. These “lower trusting” states have fewer college graduates and lower household incomes, both of which are associated with lower levels of trust. Within a state, trust also can vary dramatically from place to place. Take California: 35% of its residents (about the national average) say most people can be trusted, but San Franciscans are nearly twice as likely as people in Riverside to feel so trustful (46% vs. 24%).   Notably, the San Francisco metropolitan area, which encompasses both Oakland and Berkeley, is one of the most highly educated places in the U.S., with more than half of adults 25 and older holding at least a bachelor’s degree. In the Riverside metro area, by contrast, 25% are college graduates. The two metro areas also differ in average income levels and racial composition in ways that are related to trust. While the level of trust within a community may be predicted largely by the wealth, education and other characteristics of the people who live there, that’s not the entire story. Even after controlling for demographic differences, neighborhoods seem to matter. For example, people who live in an area where more people are college educated tend to have higher levels of trust, regardless of their own level of education. (For more about the impact of neighborhoods, refer to the “Geography” section below.) People who say that drug addiction, poverty, crime and availability of jobs are major problems in their community are – perhaps not surprisingly – more likely to say that most people can’t be trusted than those who don’t face those problems. And Americans who feel only “somewhat safe” in their neighborhood at night are considerably more likely to say most people can’t be trusted, on average, than those who feel very or extremely safe. As numerous studies have noted, demographic and social diversity also can present barriers to trust. A March 2025 survey found that more than two-thirds of people who say their neighbors are similar to them racially, politically and educationally also say they trust most or all of their neighbors. By contrast, most people who see their neighbors as very different say they trust only some or none of them. Still, causality is hard to pin down. Do differences between people increase mistrust? Or do mistrustful people

Americans’ Trust in One Another Read More »

Views of Race, Policing and Black Lives Matter in the 5 Years Since George Floyd’s Killing

May 7, 2025 May 25 marks five years since George Floyd, an unarmed Black man, was killed by a White police officer in Minneapolis. The officer, Derek Chauvin, was found guilty on charges of murder and manslaughter and sentenced to more than 20 years in prison. Floyd’s murder, just months after the killings of Ahmaud Arbery and Breonna Taylor, sparked nationwide protests. Millions of Americans marched in communities across the country, drawing attention to issues of racial inequality, including the treatment of Black people by police. In June 2020, more than eight-in-ten U.S. adults said they were following news about the demonstrations “very” (42%) or “fairly” closely (42%). This was similar to the high level of attention Americans had been paying to news about COVID-19.   The Black Lives Matter movement, which first rose to prominence in 2013 following George Zimmerman’s acquittal in the shooting death of Trayvon Martin, reached a high point in favorability during the 2020 protests, with 67% of U.S. adults expressing support. And a Pew Research Center analysis shows that use of the #BlackLivesMatter hashtag peaked following Floyd’s killing. Some called the summer of 2020 a time of racial reckoning in America. But in the years since, Americans have expressed growing skepticism that the events of 2020 produced significant change. In September 2020, 52% of U.S. adults said the increased focus on issues of race and racial inequality would lead to changes that would improve the lives of Black people; 46% said it would not. Terminology References to White, Black and Asian adults include those who are not Hispanic and identify as only one race. Hispanics are of any race. All references to party affiliation include those who lean toward that party. Republicans include those who identify as Republicans and those who say they lean toward the Republican Party. Democrats include those who identify as Democrats and those who say they lean toward the Democratic Party. Five years later, 72% say the increased focus on race and racial inequality after Floyd’s killing did not lead to changes that improved the lives of Black people. The share of Americans who express support for the Black Lives Matter movement stands at 52% today, a drop of 15 percentage points compared with June 2020. Commitment to diversity, equity and inclusion (DEI) has also declined. Companies have pulled back on DEI initiatives, and workers’ views of them have grown more negative. This was the case even before President Donald Trump signed an executive order eliminating DEI policies in the federal government and urging the private sector to do the same. More broadly, some Americans have grown more pessimistic that Black people will eventually have equal rights with White people. Among those who say the country hasn’t made enough progress on racial equality, 49% express doubt that Black people will ever have equal rights with White people, up from 39% in 2020. In this data essay, we’ll look back at how Americans were thinking about race, racial inequality and policing in the weeks and months following George Floyd’s killing. We’ll also explore how views about these issues have changed in the last five years and Americans’ expectations for the future. How Americans’ views of police conduct have changed Police officers in San Antonio, Texas. (Robert Alexander/Getty Images) Views of police conduct turned more negative in the weeks following George Floyd’s death. In June 2020, most U.S. adults said police around the country were doing an only fair or poor job of: Holding officers accountable for misconduct (69%) Treating racial and ethnic groups equally (65%) Using the right amount of force for each situation (64%) Each of these shares was at least 10 percentage points higher than it had been in 2016. By 2023, views had become more positive, though fewer than half said police were doing an excellent or good job in each of these areas. Views of police have consistently varied by party and by race and ethnicity. Democrats and Democratic-leaning independents have more negative views than Republicans and Republican leaners, and Black adults have more negative views than White and Hispanic adults. (The number of Asian adults in the sample was too small to analyze separately.) The impact of viral videos of police violence In 2023, nearly nine-in-ten Americans said they had personally seen videos of police violence against Black people. Views of the impact of these videos were mixed.  45% of U.S. adults said the wide sharing of these videos in the news or on social media is a very or somewhat good thing. 63% said these videos make it a lot or somewhat easier to hold police officers accountable. 54% said they make it a lot or somewhat harder for police officers to do their jobs. Black adults (65%) and Democrats (68%) were the most likely to say these videos being widely shared is a good thing. There were also wide partisan differences in the shares saying these videos make it easier to hold police officers accountable (76% of Democrats vs. 50% of Republicans). When it comes to the impact on police officers’ ability to do their job, 64% of White adults and 74% of Republicans said these videos make it harder. Fewer than half among other groups said the same. How the relationship between Black people and police has changed since Floyd’s murder Five years after George Floyd’s death, we asked Americans how they see the relationship between police and Black people in the United States. More than half of U.S. adults (54%) say things are about the same as before Floyd was killed. A third say things are now worse, while just 11% say things are better. Views differ by party. About four-in-ten Republicans (39%) say the relationship between police and Black people is now worse, compared with 28% of Democrats. Democrats are more likely than Republicans to say things are about the same as they were before Floyd’s killing (59% vs. 49%). Notably, these views don’t vary much by race and ethnicity. The #BlackLivesMatter

Views of Race, Policing and Black Lives Matter in the 5 Years Since George Floyd’s Killing Read More »

Americans on Healthy Food and Eating

(Willie B. Thomas/Getty Images) How we did this Pew Research Center conducted this study to understand Americans’ eating behaviors and priorities. For this analysis, we surveyed 5,123 U.S. adults from Feb. 24 to March 2, 2025. Everyone who took part in the survey is a member of the Center’s American Trends Panel (ATP), a group of people recruited through national, random sampling of residential addresses who have agreed to take surveys regularly. This kind of recruitment gives nearly all U.S. adults a chance of selection. Interviews were conducted either online or by telephone with a live interviewer. The survey is weighted to be representative of the U.S. adult population by gender, race, ethnicity, partisan affiliation, education and other categories. Read more about the ATP’s methodology. Here are the questions used for this analysis, the topline and the survey methodology. As food prices have crept up, eating healthy has gotten tougher for many Americans. An overwhelming majority (90%) of adults say healthy food has gotten more expensive in recent years. And 69% say these price hikes make it more difficult for them to eat healthy. These are among the findings from a Pew Research Center survey conducted from Feb. 24 to March 2, 2025, among 5,123 U.S. adults. Beyond supermarket sticker shock, Americans’ mealtime choices also are playing out against the backdrop of several other dynamics: rising obesity levels, proliferation of food delivery options, and a wave of diet trends and recommendations on social media. We conducted this survey to understand U.S. adults’ priorities and behaviors around healthy food and eating. This study builds on our previous work looking at Americans’ attitudes about and experiences with emerging health issues. Key highlights About two-in-ten Americans describe their own diets as extremely or very healthy, with a far larger share saying their diets are somewhat healthy (59%). One-fifth say their diets are not too or not at all healthy. When deciding what to eat, how the food tastes is a high priority for a large majority (83%) of Americans. About half say the same of food healthiness.  Eating home-cooked meals is far more common than ordering takeout or delivery or eating at restaurants. Nearly nine-in-ten eat home-cooked meals at least a few times a week, compared with 17% ordering takeout or delivery and 12% eating at restaurants that frequently. Americans who eat a home-cooked meal every day are more likely to describe their diets as extremely or very healthy, compared with those who have home cooking less frequently (29% vs. 12%).  Roughly seven-in-ten Americans say the increased cost of healthy food in recent years has made it more difficult to eat healthy. A larger share of lower-income adults than upper-income express this view (77% vs. 54%). Jump to: How Americans rate their own diets | What’s important to Americans when making food choices? | Where Americans get their food | Healthy food cost, access and knowledge How Americans rate their own diets Poor diets are a driver of major public health challenges in the United States, like obesity and heart disease. And nutrition experts say that many U.S. adults have unhealthy diets. When asked how healthy their own diets are, U.S. adults largely give middling reviews. About six-in-ten say that, overall, their diet is somewhat healthy. A much smaller share say their diets are extremely or very healthy (21%). And one-in-five say their diets are not too or not at all healthy. Older, upper-income and highly educated adults are more likely to say they have healthy diets than younger, lower-income and less educated Americans. Notably, Republicans and Democrats offer similar views of the healthiness of their own diets, as well as the factors that shape their food choices more broadly. Food and diet have been emphasized in the current presidential administration, with Health and Human Services Secretary Robert F. Kennedy Jr. prioritizing tackling obesity and working to ban certain food dyes. Findings by additional demographic characteristics are presented in the appendix. What’s important to Americans when making food choices? Busy schedules, tight budgets, taste preferences and health concerns all can play a role in eating decisions. This survey asked U.S. adults about how important each of four considerations are when deciding what food to get: taste, cost, healthiness and convenience. Taste of food Solid majorities of U.S. adults say all four aspects are at least somewhat important. But how the food tastes tops the list by a sizable margin when it comes to what Americans feel is extremely or very important. A strong majority (83%) says taste is this important. Large majorities of Americans across gender, race and ethnicity, age, and income say taste is extremely or very important in deciding what to eat. Across all these subgroups, at least seven-in-ten strongly prioritize taste. Price consciousness Sticker price can affect eating choices, and cost ranked second as a priority among the four criteria we asked about. Cost is highly important to roughly six-in-ten Americans when it comes to choosing what food to get, and it plays a bigger role among lower-income respondents than those who are upper income. Three-quarters of lower-income Americans say cost of food is extremely or very important when deciding what food to get, 36 percentage points higher than among upper-income adults. Healthiness of food About half (52%) say the healthiness of food is highly important when deciding what to eat. And prioritizing healthiness in food tracks with reporting a healthier diet. Among Americans who say healthiness in food is extremely or very important, 35% describe their own diets as highly healthy, compared with 3% of adults who say healthiness is not too or not at all important. Larger shares of Black (58%) and Hispanic adults (57%) than of White adults (49%) say healthiness of food is extremely or very important. By 11 points, women highly value healthiness of food more than men (58% of women vs. 47% of men). And more women than men feel all four priorities we asked about are highly important: taste (86% of women

Americans on Healthy Food and Eating Read More »

Most U.S. Catholics Say They Want the Church To Be ‘More Inclusive’

Catholic worshippers attend a New Year’s Eve Mass at St. Patrick’s Cathedral in New York City in 2016. (Artem Vorobiev/Getty Images) How we did this Pew Research Center conducted this survey to better understand how U.S. Catholics view the Catholic Church. For this report, we surveyed 1,787 Catholic respondents from Feb. 3 to 9, 2025. All of the respondents were members of the American Trends Panel, a group of people recruited through national, random sampling of residential addresses who have agreed to take surveys regularly. This kind of recruitment gives nearly all U.S. adults a chance of selection. Surveys are conducted either online or by telephone with a live interviewer. The survey is weighted to be representative of the U.S. adult population by gender, race, ethnicity, partisan affiliation, education, and other factors. Read more about the ATP’s Methodology. Here are the questions used for this report , along with responses, and the survey methodology. With the death of Pope Francis, the College of Cardinals is expected to gather May 7 to choose the next head of the Catholic Church. A Pew Research Center survey conducted in early February – before the pope’s hospitalization on Feb. 14 – finds that majorities of U.S. Catholics express views that differ from church teachings on issues such as birth control, marriage and the priesthood. For example: 84% of U.S. Catholics say the church should allow Catholics to use birth control. 83% say the church should allow couples to use in vitro fertilization (IVF) to get pregnant. 68% say the church should allow women to become deacons. 63% say the church should allow priests to get married. 59% say the church should ordain women as priests. When asked to choose which of two contrasting statements comes closer to their view, 60% of U.S. Catholics say the church “should be more inclusive, even if that means changing some of its teachings,” while 37% say the church “should stick to its traditional teachings, even if that means the church gets smaller.” How we worded these questions We used simple, common phrases in the survey questions about some steps that Catholics would – or would not – like to see the church take. Our goal was to make the questions easy to understand for as many respondents as possible. In some cases, the wording of the questions involved a trade-off between broad understandability and theological nuance. For example, one question asks whether the church should “allow priests to get married.” This would not, strictly speaking, be a change in doctrine. The Catholic Church already allows married priests under certain circumstances, such as if a man was married before being ordained in an Eastern Catholic Church. Technically, the church considers the rule of celibacy for priests to be a “discipline” rather than a doctrine. Nonetheless, allowing parish priests to get married and continue in their duties would represent a big change in the everyday life of the church in the United States.  Similarly, another question asks whether the church should allow unmarried Catholics who “are living with a romantic partner” to receive Communion. Actually, Catholicism has no rule against unmarried people living together. The church’s teaching is that sexual activity outside of marriage is a grave sin, and that anyone “conscious of a grave sin” should not take Communion unless they have been to confession. Yet another example concerns contraception. The survey asks whether the church should allow Catholics to “use birth control.” But the church does not object to married couples using natural methods (i.e., abstaining from sex during fertile periods) to “space the births of their children.” Rather, the objection is to using methods that prevent the sexual act from resulting in conception, including “condoms, hormonal birth control pills and sterilization.” On all these topics, there are large differences between the responses of Catholics who go to church at least once a week and those who do not. Those who say they go weekly are: 20 percentage points less likely to favor allowing women to serve as deacons (54% vs. 74%) 20 points less likely to favor allowing priests to get married (49% vs. 69%) 18 points less likely to favor allowing Catholics to use birth control (72% vs. 90%) 17 points less likely to favor allowing couples to use IVF (71% vs. 88%) Slightly more than half of Catholics who attend Mass weekly (56%) say the church should not allow women to become priests, while 66% say the church should not recognize the marriages of gay and lesbian couples. Additionally, Catholics who attend Mass weekly are 22 points more likely than Catholics who don’t go to Mass weekly to say they think the church should stick to its traditional teachings, even if that means the church gets smaller. (Among the U.S. Catholic population overall, roughly three-in-ten say they attend Mass at least once a week, while the remainder say they go less often or not at all. For more information about the religious and demographic characteristics of U.S. Catholics, read “10 facts about U.S. Catholics.”) Still, most weekly Mass attenders say the church should allow Catholics to use birth control (72%) and IVF (71%). A majority (59%) also says the church should permit people to receive Communion even if they are unmarried and living with a romantic partner. And about half favor ordaining women as deacons, allowing priests to marry, and permitting priests to give blessings to same-sex couples. When asked about the influence of women in the church, 51% of U.S. Catholics say women “do not have enough” influence, while 42% say women currently have “about the right amount” of influence. Far fewer (5%) say women have “too much” influence. The survey also finds: Women are somewhat more likely than men to want a “more inclusive” church, and to say women don’t have enough influence in the church. Catholic Republicans and independents who lean Republican tend to take more traditional stances than Catholic Democrats and Democratic leaners on the survey’s questions about ordaining women, allowing priests to get married, allowing Catholics to use birth

Most U.S. Catholics Say They Want the Church To Be ‘More Inclusive’ Read More »

3. Spells, curses and ways to see the future

Many adults around the world believe that spells, curses or other magic can influence people’s lives. Survey respondents in sub-Saharan African countries and in Colombia are especially likely to hold this belief: Seven-in-ten or more adults in those places express belief in spells. But fewer than half of adults surveyed in Europe, North America, East Asia and Australia hold this view. On the other hand, when it comes to trying to see the future – like consulting a fortune teller or horoscope – fewer than a quarter of adults in nearly all 35 countries surveyed say they engage in these practices. South Africa (47%) and India (45%) have the highest shares of adults who say they consult a fortune teller or horoscope to see the future. The survey also finds that: Christians are much more likely than religiously unaffiliated adults to believe that spells and curses can affect people’s lives. Many Hindus, especially in India and Sri Lanka, consult fortune tellers or horoscopes to see the future. In many countries, those who pray daily are more likely than others to believe in spells and curses. By contrast, adults who pray at least daily are not particularly different from other adults when it comes to trying to see the future. Women are more likely than men to believe in the power of spells and to use a fortune teller or horoscope to see the future. Belief in spells, curses or other magic Across 35 countries surveyed, the share of adults who believe that spells, curses or other magic can influence people’s lives varies widely. This belief is broadly held in all four African countries surveyed, by seven-in-ten or more adults in each place. Of all the countries surveyed, Ghana (87%) has the largest share of adults who believe in the power of spells or curses. More than half of all adults in the Latin American countries included in the survey also express this belief – ranging from 72% in Colombia to 56% in Mexico. Substantial shares of adults in South and Southeast Asia also say spells, curses or other magic can influence people’s lives. However, in North America, Australia, East Asia and most of Europe, one-third or fewer of adults hold this view. In the United States, 30% believe spells, curses or other magic can influence people’s lives. In Sweden and Japan, about one-fifth do. Views by religion Christians generally are more likely than religiously unaffiliated adults to say they believe that spells, curses or other magic can influence people’s lives. In Singapore, for instance, 50% of Christians hold this belief, compared with 36% of unaffiliated adults. Half or more of Hindus surveyed in Bangladesh (58%), Sri Lanka (58%) and India (51%) believe spells or curses can influence people’s lives. Within religions, there are some geographic variations on this question. For example, Israeli Jews are almost twice as likely as Jewish Americans to believe that spells, curses or other magic can influence people’s lives (29% vs. 15%). Among Buddhists, those living in South and Southeast Asia are more likely than those living in East Asia to express this belief. Views by rate of prayer Respondents who pray daily are more likely than those who pray less often to say they believe in spells, curses or other magic influencing people’s lives. This is particularly true in Europe. For instance, in Germany, 49% of adults who pray at least daily believe that spells, curses or other magic can influence people’s lives, while 24% of adults who pray less often take the same view. In Ghana, however, the opposite is true: Adults who pray daily are slightly less likely than others to hold this belief (85% vs. 93%). Consulting a fortune teller or horoscope to see the future In most countries surveyed, fewer than a quarter of adults say they consult a fortune teller, horoscope or other way to see the future. In Europe, this ranges from 17% of Hungarians to just 4% of Greeks. In the Americas, it ranges from 16% in Peru to 9% in the U.S. India and South Africa stand out from the other countries surveyed, with 47% of South Africans and 45% of Indians saying they use such methods to try to see the future. Views by religion Hindus are among the most likely to consult a fortune teller or horoscope to see the future, including half or more in India and Sri Lanka (51% and 56%, respectively). In Bangladesh, 36% of Hindus also engage in these practices – far more than the share of Bangladeshi Muslims who do so (9%). While around a third of Buddhists in Singapore, South Korea and Thailand use fortune tellers or horoscopes to see the future, just 16% of Buddhists in Sri Lanka and Japan do so. In general, similar shares of Christians and the religiously unaffiliated in each country use fortune tellers or other ways to see the future. For instance, 10% of both Christians and unaffiliated adults in Australia say they engage in these practices. Views by gender In most countries surveyed – including nearly every European country – women are more likely than men to use a fortune teller, horoscope or other way to see the future. For instance, in Poland, 16% of women do this, while just 2% of men say the same. And in Japan, 25% of women use methods to see the future, compared with 13% of men. However, the pattern is reversed in Colombia: Men are slightly more likely than women to consult fortune tellers and horoscopes to see their futures (14% vs. 8%). source

3. Spells, curses and ways to see the future Read More »

4. Spiritual and religious practices

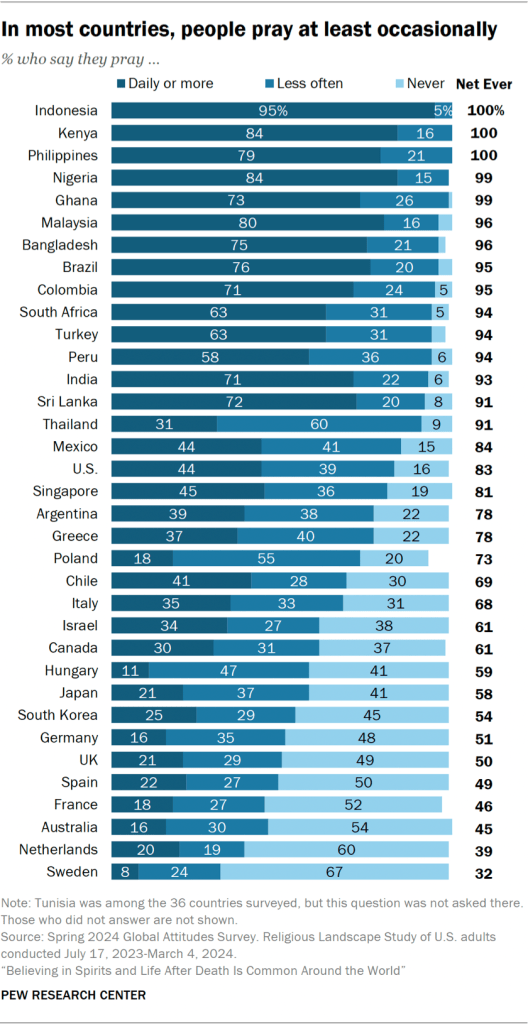
Spiritual and religious practices vary around the world. Some activities, such as prayer, are widespread across many societies. Other practices, such as fasting and lighting incense or candles, are common in some places and rare in others. Within countries, some religious groups are particularly likely to engage in the practices we asked about. For example, in places with enough Muslims to report on, Muslims often are much more inclined than others to say they fast during holy periods. Religiously unaffiliated people – those who say they are atheist, agnostic or have no religion in particular – engage in religious and spiritual practices at lower rates than other adults. For example, relatively few unaffiliated adults say they attend worship services at least monthly. In many countries surveyed, women are more likely than men to participate in religious and spiritual activities. In Italy, for example, roughly twice as many women as men report praying daily. But this gender gap is not universal: In Israel, men are more likely than women both to pray daily and to attend religious services. Generally, adults who pray at least once a day tend to be more likely than other adults to do other spiritual things, including lighting incense (for spiritual reasons) or wearing religious symbols. Prayer In 14 of the 35 countries surveyed, a majority of adults say they pray at least once a day. This includes 95% of Indonesians. Other countries in South and Southeast Asia also have majorities who pray daily, as do Turkey, places in sub-Saharan Africa and parts of Latin America. Meanwhile, in six European countries, as well as in Australia, about half or more of adults say they never pray. Swedes are the least likely among those surveyed to pray: Two-thirds of Swedish adults say they never pray. The United States falls somewhere in the middle of the countries surveyed: 44% of U.S. adults say they pray daily, while 16% never pray. Views by religion In nearly every country with enough Muslims to analyze, Muslims are more likely than members of other religious groups to pray daily. For example, 92% of Sri Lankan Muslims pray at least once a day, compared with 76% of Christians in that country and 69% of both Buddhists and Hindus. Bangladesh is the only country where this pattern does not hold – Hindus in Bangladesh are more likely than Muslims to pray at least daily (87% vs. 73%). In some countries, Buddhists and Jews are among the least likely to pray daily. For example, a quarter of Singaporean Buddhists pray daily, compared with 61% of Singapore’s Christians and 84% of its Muslims. But the religiously unaffiliated are consistently the least likely to pray daily. For instance, in South Africa, 35% of unaffiliated adults say they pray daily, compared with 69% of South African Christians. Views by age Adults ages 50 and older are consistently more likely than the youngest adults surveyed (ages 18 to 34) to pray daily. That’s the pattern across many regions – from Europe and the Americas to Southeast Asia and East Asia. For example, the oldest adults in Mexico are about twice as likely as the youngest adults there to pray at least daily (60% vs. 29%). Likewise, in Thailand, 39% of adults ages 50 and older say they pray daily, compared with 20% of the youngest adults. One exception is France, where adults ages 18 to 34 are more likely than the oldest adults to pray daily (28% vs. 15%). Views by gender Like past research that generally shows women to be more religious or spiritual than men, the new survey finds that women are significantly more likely than men to say that they pray at least once a day in nearly all 35 countries surveyed. For example, half of women in the U.S. say they pray daily, compared with 37% of men. The only exception is Israel, where men are somewhat more likely than women to pray at least once a day (40% vs. 28%). Salah among Muslims In 11 countries with significant Muslim populations, Muslims who say that they pray several times a day were also asked if they pray five salah every day. (This question was not asked in the U.S. this time, though we asked it in a 2017 U.S. survey.) In general, most Muslims say they pray five salah, including 91% in Nigeria and 84% in Indonesia and Sri Lanka. Turkey is the only country surveyed where a minority of Muslims (31%) pray five salah every day. Attending religious services In 18 of the countries surveyed, around half or more of adults say they attend a religious service or go to a house of worship once a month or more often. This includes nearly all adults in Indonesia (99%) and Nigeria (96%). (People from different religions were asked about attending in different religious spaces. For example, Christian respondents were asked about going to church, while Hindus were asked about going to a temple. Refer to the Topline for details.) Adults in East Asia are much less likely than those in South and Southeast Asia to be frequent attenders. For example, 13% of Japanese go to a temple or attend religious services at least once a month, while 86% of Indians do the same. In general, most adults in sub-Saharan Africa frequent a house of worship monthly. By contrast, about one-third or fewer of European adults report being regular attenders. An exception is Poland, where about half of adults (49%) report attending religious services at least monthly. Views by religion Religiously unaffiliated respondents are much less likely than people who are religiously affiliated to attend services and houses of worship monthly or more often. For example, 21% of unaffiliated South Africans say they attend religious services at least monthly, compared with 80% of Christians. In three of the four countries with enough Hindus to analyze – Bangladesh, India and Sri Lanka – overwhelming majorities say they got to a temple once a month or more often.

4. Spiritual and religious practices Read More »

2. Beliefs about the afterlife

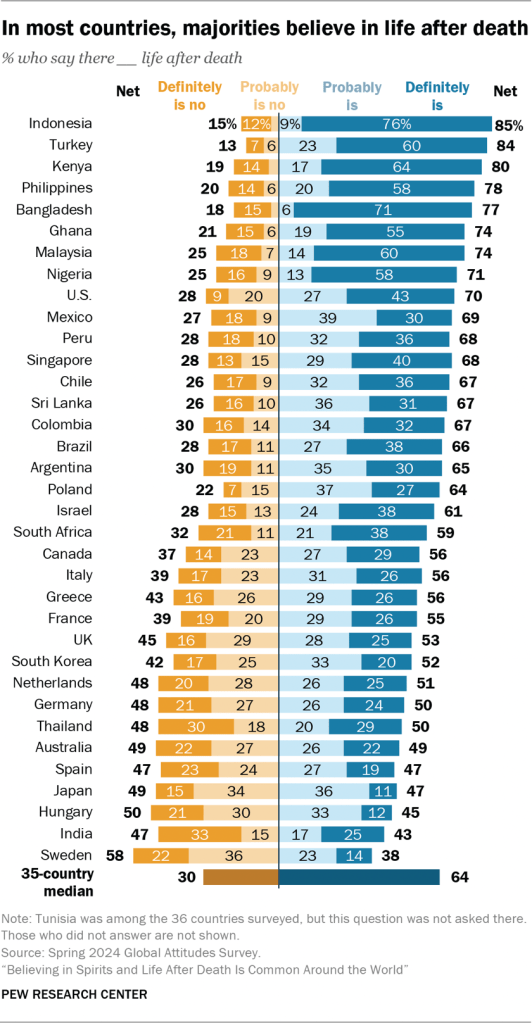
Across the countries surveyed, many adults say there definitely or probably is life after death. People are generally less likely to say that the spirits of ancestors can help or hurt them. And a relatively small percentage of adults in most countries believe in reincarnation. Beliefs on these aspects of life after death vary across regions: Adults in Latin America and sub-Saharan Africa are among the most likely to say there is life after death. They are also, in many cases, more likely than people surveyed elsewhere around the globe to believe in reincarnation and to believe that ancestral spirits can influence their lives. Europeans are consistently among the least likely to hold these beliefs. Views on the afterlife also vary by religion: Most Christians believe there is life after death. And, in many countries, Christians are more likely than religiously unaffiliated people to say the spirits of ancestors can help or harm them. Large shares of Muslims believe in life after death, but in several countries, Muslims are less likely than people in other religious communities to believe in reincarnation or in the influence of ancestral spirits. Buddhists and Hindus are consistently more likely than other religious groups in their countries to believe in reincarnation. Women are somewhat more likely than men to believe in these three concepts, a gender divide that is most pronounced in European countries. Belief in life after death In nearly every country surveyed, half or more of adults say there is definitely or probably life after death. This ranges from 85% of Indonesians to 38% of Swedes. (The survey did not define “life after death” for respondents.) Large majorities in several sub-Saharan African countries say there is life after death. In all six Latin American countries surveyed, roughly two-thirds of adults hold this view. In most European countries surveyed, smaller shares express a belief in life after death, including just under half of adults in both Spain and Hungary. In the Asia-Pacific region, responses on this topic vary more widely. While Indians and Japanese are among the least likely to say there is life after death, about three-quarters of Filipinos and Bangladeshis say this. In the United States, 70% of adults say there is life after death. Views by religion Large shares of Muslims across the world say there is definitely or probably life after death. This is the case in all countries that have sufficiently large samples of Muslims to analyze – except in India, where only 42% of Muslims believe in life after death. In nearly all the countries with enough Christians to analyze, around six-in-ten or more say there is life after death, including 78% of Filipino Christians and 81% of Kenyan Christians who say this. Buddhists’ views on life after death vary, with about half of Buddhists in Thailand and South Korea saying there is life after death, compared with two-thirds or more in Singapore and Sri Lanka. Religiously unaffiliated people typically are less likely than other adults to believe in life after death, though levels of belief vary greatly by region. Around one-third or fewer of unaffiliated adults in Europe say there is life after death, but in Latin America, Singapore and South Africa, half or more of unaffiliated adults believe in an afterlife. Indeed, nearly two-thirds of the unaffiliated in Peru say there is definitely or probably life after death. In the U.S., 42% of religiously unaffiliated adults say they believe in life after death. Views by rate of prayer In most countries surveyed, people who pray at least daily are more likely than those who pray less often to say there is life after death. For example, 69% of Japanese who pray daily say there is definitely or probably life after death, compared with 41% of other Japanese who take this position. And in Spain, 79% of adults who pray daily say there is life after death, while 38% of Spanish adults who pray less often say this. Views by education Belief in life after death does not consistently align with education levels. In some of the 35 surveyed countries, people with higher levels of education are more likely than other adults to say there is life after death. This is true in eight countries and is most common in Latin America. In Colombia, for example, 73% of adults who have completed a secondary education say there is definitely or probably life after death. Among Colombian adults with less education, 58% express that view. On the other hand, in the U.S., the Netherlands and Israel, adults with more education are less likely to say there is life after death. In the remaining countries, there is no clear association between education levels and belief in life after death. Views by age In a handful of countries, adults under 35 are more likely than those ages 50 and older to say there is life after death. For example, in the United Kingdom, 64% of younger adults believe there is definitely or probably life after death, compared with 43% of older adults who believe this. Only in Canada and the U.S. is the opposite true. Older Canadians are more likely than the youngest adults to say there is life after death (60% vs. 50%). And older Americans are slightly more likely than younger Americans to say the same (73% vs. 65%). Can the spirits of ancestors help or hurt people? In most countries surveyed, fewer than half of adults believe that the spirits of ancestors can help or harm them, with a median of 38% across 35 countries expressing this view. Belief in the power of ancestral spirits is most common in the four African countries surveyed, particularly in South Africa (79%) and Ghana (72%). Across the Asia-Pacific region, smaller shares of adults believe that ancestral spirits can help or harm them. In Bangladesh and Malaysia, only about two-in-ten adults say this. But 55% of Indians and 50% of Filipinos believe that such familial spirits can impact their lives.

2. Beliefs about the afterlife Read More »

Methodology: Asian American Fact Sheets

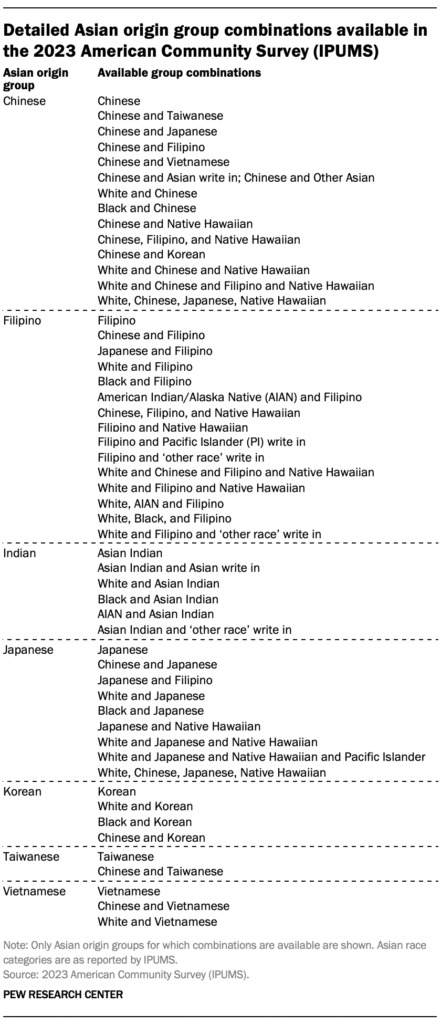
Pew Research Center’s fact sheets on Asians in the U.S. and the accompanying blog post examine the Asian population in the United States overall and by 22 origin groups – Bangladeshis, Bhutanese, Burmese, Cambodians, Chinese, Filipinos, Hmong, Indians, Indonesians, Japanese, Koreans, Laotians, Malaysians, Mien, Mongolians, Nepalese, Pakistanis, Sri Lankans, Taiwanese, Thai, Uzbeks and Vietnamese. These fact sheets provide detailed geographic, social and demographic, and economic characteristics for Asians overall and for each Asian origin group. They are based on the most recent and historical data available from multiple sources, including the U.S. Census Bureau’s decennial census and American Community Survey and Pew Research Center’s 2022-23 survey of Asian American adults. Detailed analysis is only included for groups with an unweighted sample size of 200 or more. Tests of statistical significance are based on the 95% confidence level. For IPUMS data, the 80 person-level replicate weights were used to generate standard errors. All figures in these fact sheets are rounded. For population estimates, figures that are 250,000 or greater are rounded to the nearest 10,000; figures that are less than 250,000 and greater than or equal to 25,000 are rounded to the nearest 5,000; figures that are less than 25,000 and greater than or equal to 1,000 are rounded to the nearest 1,000; figures that are less than 1,000 are rounded to the nearest 100. Proportions are based on unrounded numbers. Figures may not sum to 100% or subtotals due to rounding. Additionally, ranked figures are based on the weighted estimates, and differences between rankings may not be statistically significant. The term “immigrants,” when referring to government data, includes those who were not U.S. citizens at birth – in other words, those born outside the 50 U.S. states or the District of Columbia, Puerto Rico, or other U.S. territories to parents who were not U.S. citizens. When referring to survey respondents, this group only includes those born outside the 50 U.S. states or the District of Columbia, Puerto Rico or other U.S. territories. Similarly, when referring to government data, the term “U.S. born” refers to people who are U.S. citizens at birth, including people born in the 50 U.S. states, the District of Columbia, Puerto Rico, or other U.S. territories, as well as those born elsewhere to at least one parent who is a U.S. citizen. When referring to survey respondents, this group only includes those born in the 50 U.S. states, the District of Columbia, Puerto Rico or other U.S. territories. American Community Survey and decennial census The American Community Survey (ACS) is the largest household survey in the United States, with a sample of more than 3 million addresses. It covers a wide range of topics on social, demographic and economic aspects of the American population. The ACS is designed to provide estimates of the size and characteristics of the resident population, which includes persons living in households and group quarters. For more about the ACS, including the sampling strategy and associated error, refer to the 2023 American Community Survey’s Accuracy of the Data document provided by the Census Bureau. Data from IPUMS The main source for this analysis is a three-year dataset constructed from the public-use files of the 2021, 2022 and 2023 ACS obtained through IPUMS from the University of Minnesota. In order to obtain larger sample sizes and report on more Asian origin groups, this analysis combines the 2021-23 ACS from IPUMS and provides averaged estimates across the three years. These IPUMS public-use files are 1% samples of the U.S. population for each year. Asians are identified as people who report their race to be Asian or any detailed Asian group, such as Hmong, Pakistani or Vietnamese. Self-identification as Asian may not necessarily match a respondent’s country of birth or their parents’ country of birth. Individuals who report Asian race may also report Hispanic origin as well as one or more non-Asian races, such as White or Black. Population estimates are provided for all groups alone or in combination with other races, ethnicities or Asian origins, as available in the data. As a result, there is some overlap in the numbers for the individual Asian groups because people with origins in more than one Asian group are counted in each group to which they belong. For example, an individual identifying as “Chinese and Filipino” would be included in the totals for all Chinese and all Filipinos. For Pew Research Center analysis of ACS data obtained through IPUMS, the alone or in combination populations are used for the seven origin groups for which it is available: Chinese Filipino Indian Japanese Korean Taiwanese Vietnamese The people included in our various populations are limited by the groups reported and coded in the microdata by IPUMS and the U.S. Census Bureau. Not all individual groups, particularly the smaller groups, are coded when in combination with other groups. For example, there is no IPUMS code for “Chinese and Burmese.” Additionally, when an individual reports multiple racial groups, IPUMS sometimes identifies the individual as Asian but does not identify their particular Asian origin. For example, IPUMS identifies the group “White and Black and American Indian/Alaska Native and Asian” but it does not have a distinct group for “White and Black and American Indian/Alaska Native and Japanese.” Because these groups do not identify a particular Asian origin, they are included in the estimates for Asians overall but cannot be coded into any detailed Asian origin group in this analysis. The table below lists all of the Asian origin in combination groups available in the 2023 ACS. Refer to the IPUMS codebook for the detailed race variable for more information and for in combination group available for previous years. Analysis of the remaining 17 individual Asian origin groups identified in the IPUMS ACS data is limited to the origin group alone populations: Bangladeshi Bhutanese Burmese Cambodian Hmong Indonesian Kazakh Laotian Malaysian Mien Mongolian Nepalese Pakistani Sikh Sri Lankan Thai Uzbek The 2023 ACS is the first public dataset to identify Kazakh, Mien, Sikh

Methodology: Asian American Fact Sheets Read More »

2. The United States’ standing in the world

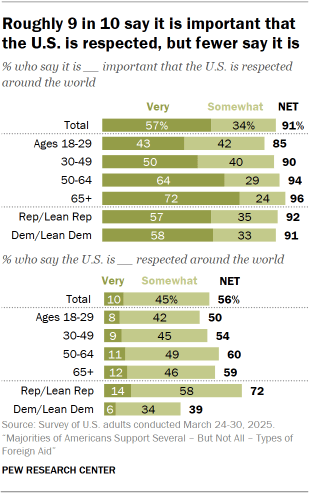
Americans generally see their country as respected and powerful on the world stage, but they think the United States’ global influence is waning. While 91% say it is important for the U.S. to be respected around the world, a much smaller share (56%) say it is respected. 52% of Americans say their country’s influence in the world is getting weaker, roughly the same share as in 2024. But compared with last year, Democrats are much more likely – and Republicans less likely – to say U.S. influence is declining. How important is it that the U.S. is respected globally? Is it respected? About nine-in-ten Americans say it is important that the U.S. is respected around the world. In fact, a 57% majority say this is very important. Fewer, though still a majority of 56%, think the U.S. actually is respected around the world. A relatively small share say the U.S. is very respected (10%), while the same share say it is not respected at all. The share of Americans who believe it’s important that the U.S. is respected has not changed since last year. Nevertheless, opinions vary somewhat by party and age. Party: Republicans (92%) and Democrats (91%) agree that global respect of the U.S. is important. However, roughly seven-in-ten Republicans and Republican-leaning independents (72%) say the U.S. is respected, compared with about four-in-ten Democrats and Democratic leaners (39%). Age: Regardless of age, Americans say it is important that the U.S. is respected globally, but older Americans are more likely to hold this view. Older adults are also more likely than their younger counterparts to say that the U.S. is respected. Views of the United States’ influence in the world While a majority of Americans feel their country is respected around the world, 52% say its global influence has been getting weaker in recent years. Around a quarter of Americans say U.S. influence has stayed about the same (24%) or that it has been getting stronger (22%) in recent years. By comparison, almost three-quarters think China’s influence is on the rise (73%), while almost half say the same about Russia (47%). And more people say that the international influence of Israel, India and Iran are growing than that U.S. influence is getting stronger. The belief that U.S. influence in the world is getting weaker was also the most common view in April 2024. But Americans are somewhat more likely now to say their country’s influence is growing (22% vs. 14% last year).  This increase is at least partly driven by Republicans, who have become much more positive in their views of U.S. global influence: 34% say the country’s influence is getting stronger, compared with 10% in 2024. They’ve also become much less likely to say U.S. influence is getting weaker this (37% vs. 67% last year). Democrats’ views have moved in the opposite direction. Compared with 2024, there’s been a slight decrease in the share of Democrats who say U.S. influence is getting stronger (11% vs. 19% last year), and a large increase in the share who say it’s getting weaker (67% vs. 44%). Adults ages 65 and older (32%) are more likely than those ages 50 to 64 (20%) or under 50 (19%) to say U.S. influence in the world is getting stronger. When rating other countries, one of the biggest shifts since 2024 is in how Americans see the influence of Iran on the world stage. Compared with last year, more Americans now say Iran’s influence is waning (28% vs. 16% then) and fewer Americans say it’s getting stronger (26% vs. 39%). The U.S. as the world’s leading economic and military power Despite the belief of many Americans that the U.S. is losing global influence, most still say the U.S. is the world’s leading military power (76%), and roughly half say it is the leading economic power (48%). The next highest shares say China is the world’s leading economic (38%) and military (14%) power. As with other ratings of the U.S., Republicans generally have more positive views of their country’s standing: 58% say it is the top economic power (compared with 40% of Democrats) while 80% say it is the top military power (73% of Democrats). For more U.S. assessments of the world’s top powers, read “Negative Views of China Have Softened Slightly Among Americans.” source

2. The United States’ standing in the world Read More »