Pew Research Center

What do religious ‘nones’ believe?

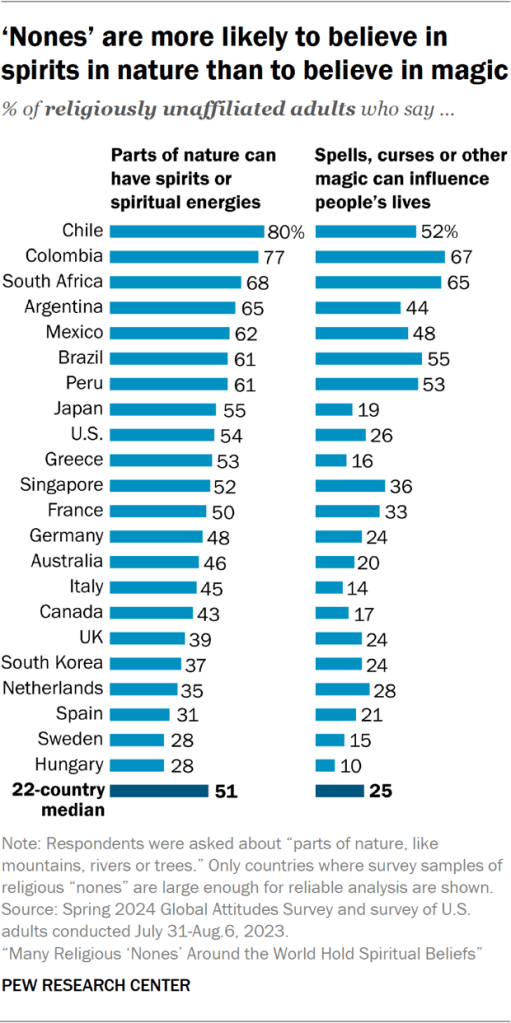
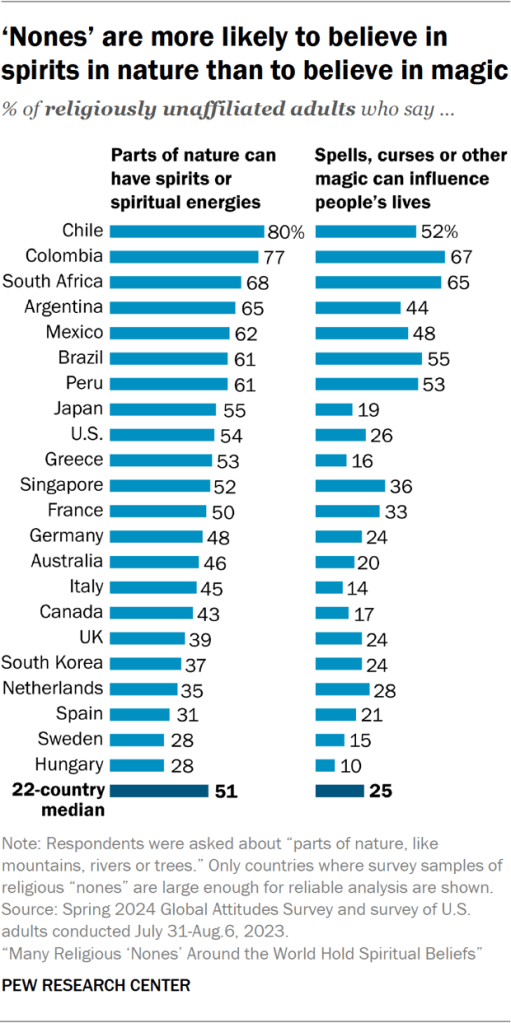
What are religious ‘nones’? “Nones” are adults who describe themselves religiously as atheist, agnostic or “nothing in particular.” This report uses the terms “nones” and “religiously unaffiliated” interchangeably. Many “nones” express a variety of religious or spiritual beliefs. For example, in many of the 22 countries analyzed by Pew Research Center in this report, sizable shares of “nones” say they believe that something spiritual exists beyond the natural world, and that animals and parts of nature can have spirits or spiritual energies. Belief in an afterlife is also relatively widespread among religiously unaffiliated adults in the countries included in the study. Additionally, in a few countries, majorities of “nones” believe in spells, curses or other magic. And roughly a quarter or more of religiously unaffiliated adults in most of the countries discussed in this report believe that the spirits of ancestors can help or harm them. In one country – South Africa – 81% of “nones” express belief in the power of ancestral spirits. In general, religiously unaffiliated people around the world are less likely to hold religious and spiritual beliefs than are people in the same countries who identify with a religion. For example, “nones” are less likely to believe in God than people who identify with a religion in each of the 22 countries where our survey included enough “nones” for reliable analysis. In Italy, for instance, 16% of “nones” believe in God, compared with 91% of religiously affiliated adults – a difference of 75 percentage points. The differences persist, but are smaller, in countries such as Argentina, where most “nones” (62%) and even higher shares of the religiously affiliated (99%) believe in God. Similar patterns prevail on other beliefs the survey measured. Within the broad category of “nones,” people who identify as atheists generally are less likely than people who describe their religion as “nothing in particular” to hold some spiritual and religious beliefs. For example, in Australia, 14% of atheists say there is life after death, while 37% of people who say their religion is “nothing in particular” believe in an afterlife. Self-described agnostics sometimes are similar to atheists and sometimes differ from them on the wide range of beliefs discussed in this report. We have enough agnostics in our survey samples to provide detailed analyses of their views in only five of the 22 countries surveyed. For country-by-country survey results among agnostics, atheists and people who identify religiously as “nothing in particular,” go to the report topline. Within a country’s population of “nones,” there are often wide gaps in belief between two other subgroups: those who say religion is not at all important in their lives, and those who attribute even a little (or more) personal importance to religion. For example, “nones” who view religion as not at all important are much less likely than other “nones” to say there is definitely or probably an afterlife. The survey findings also indicate that women who are “nones” generally are more likely than men who are “nones” to express a variety of beliefs. Among “nones” in Singapore, for instance, women are about twice as likely as men to believe that spirits can inhabit objects such as crystals, jewels or stones (45% vs. 21%). This pattern is consistent with our previous studies showing that women tend to be more religious than men in many countries, particularly within Christian populations. (The religious and spiritual beliefs of “nones” are also discussed in this report’s Overview.) Belief in God In most of the 22 countries analyzed, at least one-in-five religious “nones” say they believe in God. However, among “nones” who describe their religious identity as “nothing in particular,” the share expressing belief in God varies widely by country. For example, people in the “nothing in particular” category in Latin American countries are a lot more likely than those in European countries to believe in God. One possible explanation for these regional differences is that belief in God is more widespread throughout the general populations (including among religiously affiliated adults) in Latin American countries than in European ones. For instance, nearly universal shares of Christians in all six Latin American countries surveyed express belief in God. Smaller majorities of Christians (about three-quarters) express belief in God in France, Germany and Hungary, while in Sweden, just 58% of self-identified Christians say they believe in God. In general, across the countries with survey samples large enough to enable comparisons between atheists and people who say their religion is “nothing in particular,” atheists are less likely than the “nothing in particular” group to believe in God. For example, in the United Kingdom, 8% of atheists express belief in God, compared with 32% of adults who identify with no particular religion. (Even though atheism is commonly understood to mean not believing in God, small shares of respondents in many places say they are atheists in answer to a religious identification question, yet they say they believe in God or affirm other religious or spiritual beliefs in response to other questions. Some scholars of religion argue that inconsistency or “incongruence” actually is the norm, not the exception, when one looks deeply into the religious identities, beliefs and practices of people around the world.) Belief in ancestral spirits In most of the countries analyzed in this report, about 20% to 40% of religiously unaffiliated adults believe that the spirits of ancestors can help or harm them. This includes 36% of “nones” in France, 31% in Canada and 25% in South Korea. Only in South Africa do a majority of “nones” (81%) believe ancestral spirits can affect them. In general, “nones” who say religion is not at all important in their lives are much less likely than other “nones” to believe that ancestral spirits can help or harm them. For example, in France, 27% of “nones” who say religion is not at all important to them believe in the active role of ancestral spirits, compared with 57% of other “nones.” Self-identified atheists are generally less likely than people

What do religious ‘nones’ believe? Read More »
Do ‘nones’ follow religious practices?

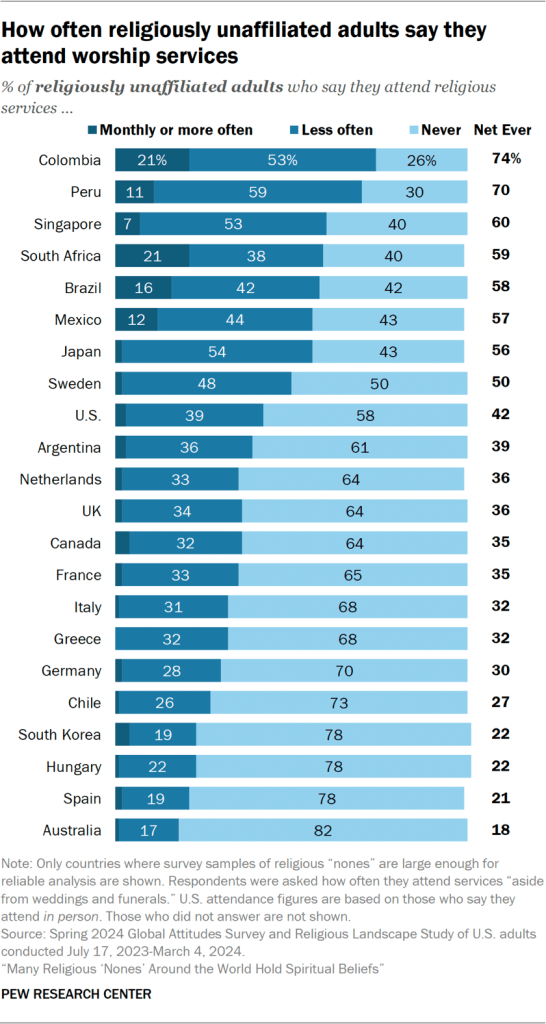
What are religious ‘nones’? “Nones” are adults who describe themselves religiously as atheist, agnostic or “nothing in particular.” This report uses the terms “nones” and “religiously unaffiliated” interchangeably. Overall, religious “nones” are less likely than adults who identify with a religion to engage in religious or spiritual practices. In most of the 22 countries analyzed, majorities of “nones” say they never attend religious services. And those who do attend services tend not to go on a regular basis (meaning, they go less often than once a month). For example, in Germany, 30% of “nones” say they go to religious services at least sometimes, but only 2% say they attend monthly or more often. Even in places where a majority of “nones” attend services, most of them go less often than monthly. In Peru, for instance, 70% of religiously unaffiliated adults say they ever go to church, but only 11% say they attend at least once a month. Similarly, in most of the countries studied, a majority of “nones” say they never pray, including 77% in Germany and South Korea. In general, the countries where “nones” are least likely to pray are in Europe. In Hungary, the Netherlands and Sweden, for example, 87% of “nones” say they never pray. (Other findings show that European countries also tend to have the smallest shares of Christians who say they ever pray.) Most “nones” also do not engage in the other religious and spiritual practices asked about in the survey. In most countries included in this report, no more than about one-fifth of “nones” say they light candles for religious reasons; visit fortune tellers or consult horoscopes to see into the future; wear or carry religious items or symbols; or fast during holy times. Across the countries surveyed, there is no strong pattern of differences on these questions between the three main subgroups of “nones” – atheists, agnostics and people who identify religiously as “nothing in particular.” For country-by-country survey results among all three groups, go to the report topline. Spiritual and religious practices of ‘nones’ In the 22 countries studied, “nones” are significantly less likely than religiously affiliated adults to say they light incense or candles for spiritual or religious reasons. In Peru, 20% of “nones” say they do this, compared with 45% of Peruvian adults with a religious affiliation (mostly Christians). The divide between “nones” and the religiously affiliated on rates of prayer are particularly stark in many places studied. In Italy, for instance, just 13% of “nones” say they ever pray, compared with 85% of religiously affiliated Italians. On the other hand, “nones” in each country are pretty similar to their religiously affiliated compatriots when it comes to the use of fortune tellers, horoscopes and other ways to see the future. In Mexico, for instance, 12% of adults in each group say they use these methods to try to predict the future. How religious practices vary among ‘nones’ “Nones” who say religion is not at all important in their lives are generally less likely than “nones” who ascribe at least a little importance to religion to participate in the religious and spiritual practices asked about in this survey. For instance, in all 15 countries with enough “nones” to analyze in both groups, those who say religion is not at all important are significantly less likely than other “nones” to say they ever pray. In Japan, 30% of “nones” who say religion is not at all important say they ever pray, compared with 58% of those who say religion is at least a little important in their lives. And in the United States, 30% of “nones” who consider religion not at all important say they pray, compared with 82% among other “nones.” Neither age nor education factor meaningfully into how often “nones” engage in religious practices. How the practices of ‘nones’ differ by gender Among “nones” in the analyzed countries, women are more likely than men to say they consult fortune tellers or horoscopes, or try to see the future in other ways. Among Chilean “nones,” for example, women are three times as likely as men to say they use these methods to try to look into the future (27% vs. 9%). This general pattern is present across the countries we surveyed in the Americas, Europe and Asia. Among “nones,” women also are more likely than men to say they light candles or incense for spiritual or religious reasons. In the United States, for instance, 19% of religiously unaffiliated women light candles or incense for spiritual reasons, compared with 7% of unaffiliated men. However, when it comes to the other religious and spiritual practices asked about on the survey, such as attending religious services, there is no strong and consistent pattern of gender differences among religiously unaffiliated adults. source

Do ‘nones’ follow religious practices? Read More »

What do ‘nones’ think is religion’s impact on society?

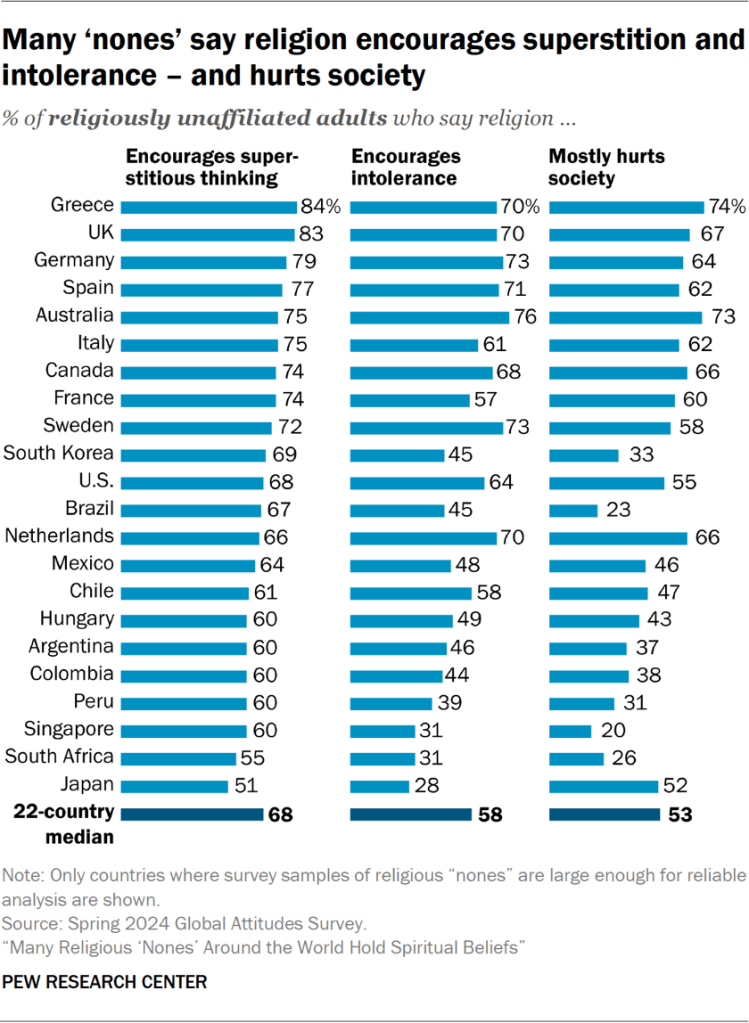
What are religious ‘nones’? “Nones” are adults who describe themselves religiously as atheist, agnostic or “nothing in particular.” This report uses the terms “nones” and “religiously unaffiliated” interchangeably. Negative views about religion’s influence on society are fairly common among “nones” across the 22 countries analyzed in this study. We asked respondents three separate questions about the social impacts of religion: whether religion encourages superstitious thinking; whether religion encourages tolerance or intolerance; and whether religion mostly helps or mostly hurts society. In all 22 countries, at least half of religiously unaffiliated adults say that religion encourages superstitious thinking. This rises to 83% of “nones” in the United Kingdom and 84% in Greece. In about half of the countries, a majority of “nones” also say religion encourages intolerance. This includes 76% of “nones” in Australia and 73% each in Germany and Sweden. “Nones” in Europe tend to be especially likely to voice negative views of religion. For example, most religiously unaffiliated adults in Spain say that religion encourages superstitious thinking (77%) and intolerance (71%), and that it mostly hurts society (62%). However, in a handful of countries in other regions, religiously unaffiliated people are more positive about religion. In Brazil, Singapore and South Africa, for instance, only about a quarter or fewer of “nones” say religion mostly hurts society. Majorities of “nones” in these countries say religion mostly helps society. As a general pattern around the world, though, “nones” are much more likely than adults with a religious affiliation to express negative views about religion. In Greece, for example, 74% of “nones” say religion mostly hurts society, compared with 23% of people identifying with a religion (mostly Christianity) who say this. “Nones” also are more likely than the religiously affiliated to say religion encourages superstition and intolerance. They are less likely than the affiliated to view religious traits as important for national leaders, and less inclined to say that religious texts should influence national laws. Views of ‘nones’ on the religion of their country’s leader Relatively few “nones” (a median of 13% across the 22 countries covered in this report) say it is important for the leader of their country to have religious beliefs that are the same as their own. Similarly low shares (16% median) say it’s important for their national leader to have strong religious beliefs, even if those beliefs differ from their own. Overall, slightly higher shares of “nones” say it is important to have a leader who stands up for people with their religious beliefs (28% median). For example, in the Netherlands, 7% of “nones” say it’s important for the prime minister to share their beliefs, while 16% say it is important for the prime minister to have strong religious beliefs, and 24% say it is important for the prime minister to stand up for people with their religious beliefs (i.e., the religiously unaffiliated respondent’s beliefs). South Africa stands out as the only country where half or more of “nones” say all three measures are important, including 68% who say it is important for the president to stand up for people with their religious beliefs. What ‘nones’ say about religion’s influence on their country’s laws The survey also asked how much influence religious texts or teachings currently have on the laws of each country, and whether respondents think these sacred texts or teachings should have that much influence. The specific text mentioned in the question depended on the historically predominant religion in each country. In many of the 22 countries covered here, “nones” are significantly more likely to say that religious texts do play a role in their country’s laws than to say that those texts should play a role. In South Korea, for example, “nones” are three times as likely to say the Bible currently has a great deal or fair amount of influence on the laws of their country as they are to say the Bible should have that level of influence on their laws (34% vs. 11%). A similar pattern occurs when South Korean “nones” are asked about the influence of Buddhist dharma on their country’s laws (30% vs. 10%). In almost all countries analyzed, a quarter or fewer of “nones” say that religious texts or teachings should have a great deal or a fair amount of influence on laws. However, Brazil, Colombia, Peru and South Africa stand out as exceptions; in these countries, close to half of “nones” say the Bible should have at least a fair amount of influence on their country’s laws. Greece and the United States are the only places where a majority of “nones” say the Bible currently has at least a fair amount of influence on the laws in their country. The unaffiliated in Hungary, Mexico, Singapore and Sweden are the least likely to say that a religious text has influence over their laws; in those four countries, only about a fifth or fewer of “nones” take that position. Differences in the views of ‘nones’ Overall, “nones” who say religion is not at all important to them are much more likely than “nones” who ascribe at least a little importance to religion to view religion’s role in society negatively. For example, in Canada, 74% of “nones” who say religion is not at all important in their lives also express the view that religion mostly hurts society. Among other Canadian “nones,” 48% say religion mostly hurts society. And in most surveyed countries where we have enough “nones” in both groups to make the comparison, “nones” who view religion as not at all important in their lives are significantly less likely than “nones” who say religion is at least a little important to think that religious texts should influence their country’s laws. In Chile, for instance, just 8% of “nones” who say religion is not at all important to them want the Bible to have at least some influence on their laws. Among other “nones” in Chile, about three times as many hold this view. Similar divides emerge between “nones”

What do ‘nones’ think is religion’s impact on society? Read More »

1. What do religious ‘nones’ believe?

What are religious ‘nones’? “Nones” are adults who describe themselves religiously as atheist, agnostic or “nothing in particular.” This report uses the terms “nones” and “religiously unaffiliated” interchangeably. Many “nones” express a variety of religious or spiritual beliefs. For example, in many of the 22 countries analyzed by Pew Research Center in this report, sizable shares of “nones” say they believe that something spiritual exists beyond the natural world, and that animals and parts of nature can have spirits or spiritual energies. Belief in an afterlife is also relatively widespread among religiously unaffiliated adults in the countries included in the study. Additionally, in a few countries, majorities of “nones” believe in spells, curses or other magic. And roughly a quarter or more of religiously unaffiliated adults in most of the countries discussed in this report believe that the spirits of ancestors can help or harm them. In one country – South Africa – 81% of “nones” express belief in the power of ancestral spirits. In general, religiously unaffiliated people around the world are less likely to hold religious and spiritual beliefs than are people in the same countries who identify with a religion. For example, “nones” are less likely to believe in God than people who identify with a religion in each of the 22 countries where our survey included enough “nones” for reliable analysis. In Italy, for instance, 16% of “nones” believe in God, compared with 91% of religiously affiliated adults – a difference of 75 percentage points. The differences persist, but are smaller, in countries such as Argentina, where most “nones” (62%) and even higher shares of the religiously affiliated (99%) believe in God. Similar patterns prevail on other beliefs the survey measured. Within the broad category of “nones,” people who identify as atheists generally are less likely than people who describe their religion as “nothing in particular” to hold some spiritual and religious beliefs. For example, in Australia, 14% of atheists say there is life after death, while 37% of people who say their religion is “nothing in particular” believe in an afterlife. Self-described agnostics sometimes are similar to atheists and sometimes differ from them on the wide range of beliefs discussed in this report. We have enough agnostics in our survey samples to provide detailed analyses of their views in only five of the 22 countries surveyed. For country-by-country survey results among agnostics, atheists and people who identify religiously as “nothing in particular,” go to the report topline. Within a country’s population of “nones,” there are often wide gaps in belief between two other subgroups: those who say religion is not at all important in their lives, and those who attribute even a little (or more) personal importance to religion. For example, “nones” who view religion as not at all important are much less likely than other “nones” to say there is definitely or probably an afterlife. The survey findings also indicate that women who are “nones” generally are more likely than men who are “nones” to express a variety of beliefs. Among “nones” in Singapore, for instance, women are about twice as likely as men to believe that spirits can inhabit objects such as crystals, jewels or stones (45% vs. 21%). This pattern is consistent with our previous studies showing that women tend to be more religious than men in many countries, particularly within Christian populations. (The religious and spiritual beliefs of “nones” are also discussed in this report’s Overview.) Belief in God In most of the 22 countries analyzed, at least one-in-five religious “nones” say they believe in God. However, among “nones” who describe their religious identity as “nothing in particular,” the share expressing belief in God varies widely by country. For example, people in the “nothing in particular” category in Latin American countries are a lot more likely than those in European countries to believe in God. One possible explanation for these regional differences is that belief in God is more widespread throughout the general populations (including among religiously affiliated adults) in Latin American countries than in European ones. For instance, nearly universal shares of Christians in all six Latin American countries surveyed express belief in God. Smaller majorities of Christians (about three-quarters) express belief in God in France, Germany and Hungary, while in Sweden, just 58% of self-identified Christians say they believe in God. In general, across the countries with survey samples large enough to enable comparisons between atheists and people who say their religion is “nothing in particular,” atheists are less likely than the “nothing in particular” group to believe in God. For example, in the United Kingdom, 8% of atheists express belief in God, compared with 32% of adults who identify with no particular religion. (Even though atheism is commonly understood to mean not believing in God, small shares of respondents in many places say they are atheists in answer to a religious identification question, yet they say they believe in God or affirm other religious or spiritual beliefs in response to other questions. Some scholars of religion argue that inconsistency or “incongruence” actually is the norm, not the exception, when one looks deeply into the religious identities, beliefs and practices of people around the world.) Belief in ancestral spirits In most of the countries analyzed in this report, about 20% to 40% of religiously unaffiliated adults believe that the spirits of ancestors can help or harm them. This includes 36% of “nones” in France, 31% in Canada and 25% in South Korea. Only in South Africa do a majority of “nones” (81%) believe ancestral spirits can affect them. In general, “nones” who say religion is not at all important in their lives are much less likely than other “nones” to believe that ancestral spirits can help or harm them. For example, in France, 27% of “nones” who say religion is not at all important to them believe in the active role of ancestral spirits, compared with 57% of other “nones.” Self-identified atheists are generally less likely than people

1. What do religious ‘nones’ believe? Read More »
Republicans’ Views of Justice Department, FBI Rebound as Democrats’ Views Shift More Negative

The U.S. Department of Justice headquarters in Washington, D.C., on April 30, 2025. (J. David Ake/Getty Images) How we did this Pew Research Center conducted this study to understand Americans’ attitudes toward federal government agencies and departments. For this analysis, we surveyed 3,554 adults from Aug. 4 to 10, 2025. Everyone who took part in this survey is a member of the Center’s American Trends Panel (ATP), a group of people recruited through national, random sampling of residential addresses who have agreed to take surveys regularly. This kind of recruitment gives nearly all U.S. adults a chance of selection. Interviews were conducted either online or by telephone with a live interviewer. The survey is weighted to be representative of the U.S. adult population by gender, race, ethnicity, partisan affiliation, education, presidential vote (among voters) and other factors. Read more about the ATP’s methodology. Here are the questions used for this report, the topline and the survey methodology. As the Trump administration works to reshape and refocus the federal bureaucracy, Republican views of several key departments and agencies – the Department of Justice, the FBI, the Department of Homeland Security and the Department of Health and Human Services – have grown considerably more positive than they were a year ago. Democratic views of these agencies have shifted in the opposite direction over this period, and in some cases even more starkly. Though overall public ratings of these agencies are only modestly changed from 2024, there have been big shifts in which Americans view them positively and negatively, according to a new Pew Research Center survey conducted Aug. 4-10 among 3,554 adults. For instance, 39% of Americans view the Department of Justice favorably, while 46% view it unfavorably. Last year, 43% had a favorable view, 44% an unfavorable one. But 51% of Republicans and Republican leaners now rate the DOJ favorably, up 18 percentage points from last year. The trend is the opposite among Democrats, and the movement sharper: 28% of Democrats and Democratic leaners view the DOJ favorably, down 27 points from last year. Partisans’ views of the FBI, a component agency of the Justice Department, have shifted to a similar degree. And while 68% of Republicans – and just 26% of Democrats – now view the Department of Homeland Security (DHS) positively, last year Democrats were more likely than Republicans to rate DHS favorably. The partisan gap in views of U.S. Immigration and Customs Enforcement, a component agency of DHS, is even wider: Roughly seven-in-ten Republicans (72%) express a favorable view of ICE, while 21% see the agency unfavorably. In contrast, Democrats overwhelmingly rate ICE negatively (13% favorable, 78% unfavorable). In Center surveys conducted by telephone through 2020, partisans’ views of the departments of Justice and Homeland Security also tended to become more positive when the presidency was held by their party, though the gaps in these views are now more pronounced. There were also relatively modest partisan gaps in evaluations of the FBI during that period. Note that, because of differences in question wording and survey mode, the specific percentages in recent web surveys and past telephone surveys are not directly comparable. Refer to the drop-down box below for more information. Changes in question wording and mode differences between online and phone surveys This survey marks the third time Pew Research Center has measured public attitudes about federal government agencies on our online American Trends Panel. We previously did so in 2024 and 2023. Earlier surveys measuring views of federal agencies, including polls fielded in 2020 and 2019, were conducted by telephone. The findings in our 2025, 2024 and 2023 web surveys are not directly comparable with those past telephone surveys for two reasons: The web surveys use different question wording than past telephone surveys. Online survey respondents receive an explicit “Not sure” response option. Telephone respondents, by contrast, had to volunteer that they did not have an opinion about an agency. This change generally results in a larger share of respondents declining to offer an opinion. Surveys conducted online and by telephone often produce different results because respondents sometimes answer similar questions differently across modes. This is called a “mode effect.” These two factors mean that point estimates (for instance, the share of respondents who express a favorable opinion about a single agency in our new survey and in a prior phone survey) should not be directly compared to measure change over time. Doing so would conflate question wording and mode differences with change over time. Despite this limitation, some broad comparisons can be made. For example, if a wide partisan gap is evident for one agency but was not apparent in past surveys – compared with partisan gaps that have remained relatively stable for other agencies – that change is likely not only a result of the transition to online polling from phone polling. Many other federal agencies continue to get positive ratings both overall and across the political spectrum. On balance, Americans rate 13 of the 16 federal agencies asked about in the survey more favorably than unfavorably. Of those 13 agencies, nine have net favorable ratings of 15 points or more. Topping the list are: The National Park Service: 76% of Americans give it a favorable rating, including 78% of Republicans and 79% of Democrats. The National Weather Service: 76% of Americans view it favorably, including 75% of Republicans and 81% of Democrats. The U.S. Postal Service, NASA, the Social Security Administration and the Department of Veterans Affairs are also all viewed more positively than negatively overall and among both Republicans and Democrats. Still, Democrats’ ratings of most of these agencies are more positive than Republicans’ ratings. How partisans view federal agencies As has been the case in previous years, there are wide partisan gaps in Americans’ views of several federal agencies. In addition to Immigration and Customs Enforcement, the Department of Homeland Security, the Department of Justice and the FBI, Republicans are now more likely than Democrats to see the State Department positively: 57% of Republicans

Republicans’ Views of Justice Department, FBI Rebound as Democrats’ Views Shift More Negative Read More »

3. How Americans view journalists and their role in society

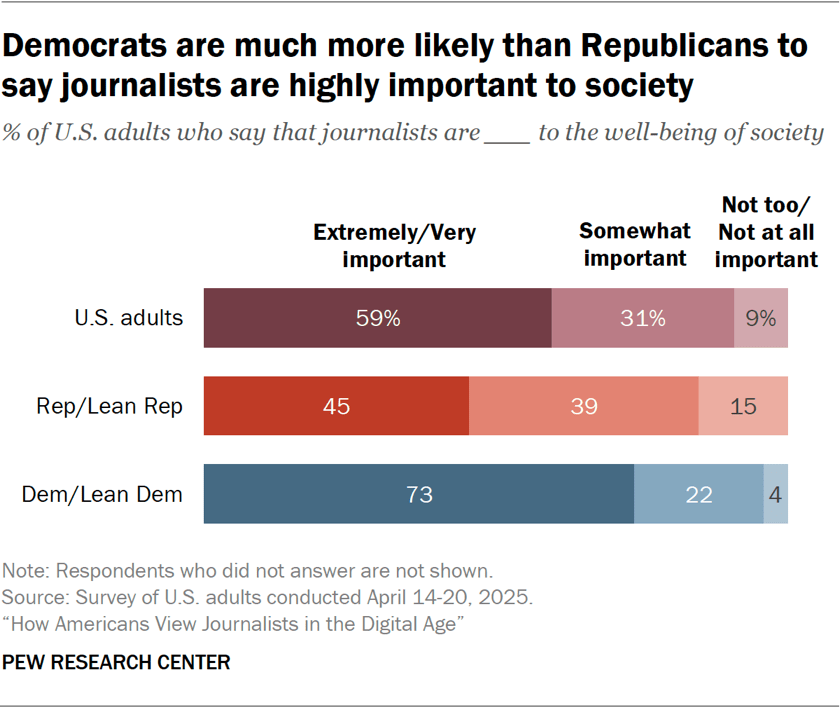
This is the third of four detailed sections in a report on Americans’ views about the role of journalists in the digital age. The report also includes an overview of the key findings. In both the survey and the focus groups that were part of this study, we asked several questions to better understand how Americans think about journalists broadly, as well as the role they play – or should play – in society. A majority of Americans (59%) say journalists are extremely or very important to the well-being of society. An additional 31% say journalists are somewhat important, while just 9% say they are not too or not at all important. These findings mirror those from our focus groups, where participants largely agreed that journalists play, or at least should play, a critical role in informing society about what’s happening in the world. One woman in her 50s said, “I think [journalists’ role is] to make sure that we are informed … to open the door for more questions, more answers, and a deeper understanding of what is happening, whatever it is, whether it’s medical or political or whatever’s happening.” A woman in her 20s said the role journalists should play in society is of a “watchdog and informer, to let the public know when something’s wrong, to raise the alarm, raise the alert … even things that aren’t an alert, but just things that we need to know to function.” Some groups of Americans are more likely to say journalists are highly important to the well-being of society: Democrats and independents who lean Democratic are far more likely than Republicans and GOP leaners to say that journalists are extremely or very important to the well-being of society (73% vs. 45%). Americans who consume news more often also see journalists as more important: 63% of those who say they follow the news at least some of the time say journalists are highly important to society, while 43% of those who follow the news less often say the same. About two-thirds of college graduates (68%) say journalists are extremely or very important to society’s well-being, versus 58% of Americans with some college education and 51% of those with a high school diploma or less education. Many Americans see journalists as losing influence At the same time, about half of Americans say journalists are losing influence in society (49%). This is much higher than the share who say journalists are gaining influence (15%). Roughly a third (36%) say they are neither gaining nor losing influence. Democrats and Republicans are both much more likely to say that journalists are losing – rather than gaining – influence in society. However, perceptions vary among Americans with different levels of formal education. A majority of those with at least a college degree (62%) say journalists are losing influence. About half of those with some college education (48%) and roughly a third of those with a high school diploma or less (36%) say the same. Many of our focus group participants agreed that the rise of alternative news sources has, to some extent, affected the influence of journalists in society. Because people have access to so many sources in the digital age, one woman in her 20s said, “I feel like anyone can do it, in a way. There’s a lot of people out there just starting their own channels taking a little bit of the importance of somebody maybe who went to school to do that. … It can make it feel like a journalist isn’t as important. Although, they are the ones that are really skilled in that job.” Some participants also noted that this digital shift has lowered barriers to entry for news providers, with consequences for both journalists and their audiences. As one man in his 60s explained: “That’s made the journalism job harder in a good way, in that the truth will hopefully get to it quicker, if you will. If they don’t say something that’s accurate, there’s a lot more folks that are fact-checking and checking things out. And I appreciate that it has made journalism harder, but navigating it for us also makes [our job] harder because who are you listening to becomes more of an issue. There are so many sources out there.” Public confidence in journalists While most Americans see journalists as at least somewhat important to society, our recent surveys have not found widespread confidence in journalists to act in the best interests of the public across several years. In our past surveys, journalists have been less trusted than several other institutions and professions, such as the military, scientists and police officers. In the new survey, fewer than half of U.S. adults (45%) say they have a great deal or fair amount of confidence in journalists to act in the best interests of the public. Four-in-ten U.S. adults have not too much confidence in journalists, and 14% have no confidence at all. Democrats remain far more likely than Republicans to express confidence in journalists. However, party differences have decreased somewhat since 2020. The share of Democrats who say they have at least a fair amount of confidence in journalists to act in the best interests of the public has fallen over the past five years, from 70% in April 2020 to 62% in April 2025. Meanwhile, the share of Republicans who say this has increased slightly during the same period, from 23% to 27%. When explaining why they do not have a lot of confidence in journalists to act in the best interests of the public, many focus group participants discussed corporate or political influence. One woman in her 50s mentioned journalists being influenced by “the money they’re going to make by what they say or the punishment they’re going to receive for what they say by the government or consumers or whatever.” This aligns with prior Pew Research Center surveys finding that large majorities of Americans believe U.S. news organizations are at least somewhat

3. How Americans view journalists and their role in society Read More »

Majority of Americans Continue to Back Expanded Early Voting, Voting by Mail, Voter ID

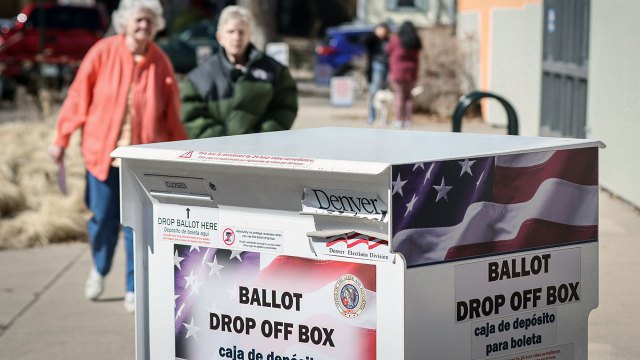
A ballot drop-off box in Denver on March 25, 2024. (Marc Piscotty/Getty Images) How we did this Pew Research Center conducted this study to understand how Americans view voting policies and procedures in the United States. For this analysis, we surveyed 3,554 adults from Aug. 4 to 10, 2025. Everyone who took part in this survey is a member of the Center’s American Trends Panel (ATP), a group of people recruited through national, random sampling of residential addresses who have agreed to take surveys regularly. This kind of recruitment gives nearly all U.S. adults a chance of selection. Interviews were conducted either online or by telephone with a live interviewer. The survey is weighted to be representative of the U.S. adult population by gender, race, ethnicity, partisan affiliation, education, presidential vote (among voters) and other factors. Read more about the ATP’s methodology. Here are the questions used for this report, the topline and the survey methodology. President Donald Trump’s recent pledge to “lead a movement” to end mail-in voting comes as a 58% majority of Americans favor allowing any voter to cast their ballot by mail if they want to. But Democrats and Republicans continue to hold starkly different views: Today, 83% of Democrats and Democratic-leaning independents support no-excuse voting by mail, while 68% of Republicans and Republican leaners oppose it. Several other proposals related to the U.S. electoral system win widespread support across the political spectrum, according to a new Pew Research Center survey of 3,554 adults conducted Aug. 4-10, prior to Trump’s announcement. Among the most-supported proposals: Requiring electronic voting machines to print a paper backup of a voter’s ballot (84% in favor) Requiring all voters to show government-issued photo identification (83%) Making early, in-person voting available for at least two weeks prior to the election (80%) Making Election Day a federal holiday (74%) Each of these draws support from majorities in both partisan coalitions. Of the 10 proposals included in the survey, just two are more opposed by Americans than favored: 52% oppose banning groups from collecting completed ballots from a large number of voters to return them to election officials. (This is sometimes called “ballot harvesting” by opponents of the practice and it is currently illegal in about half of states.) 56% oppose removing people from registration lists if they haven’t voted recently or responded to efforts to confirm their registration and address. Automatic voter registration, same-day registration, early voting and voting by mail In addition to making in-person early voting available for two weeks and mail-in voting available to any registered voter who wants it, about six-in-ten Americans favor automatic voter registration for eligible citizens (59%) and same-day voter registration (58%). As has long been the case, there is more support for each of these proposals among Democrats than Republicans. 77% of Democrats and 42% of Republicans support automatic voter registration. Similarly, 72% of Democrats and 43% of Republicans favor allowing registration at the polls on Election Day. The partisan gap over in-person early voting is narrower, and support has grown among Republicans since last year. Today, majorities in both parties (89% of Democrats, 71% of Republicans) favor at least two weeks of early, in-person voting. In contrast, there is a wide gap of 51 percentage points in partisans’ support for mail-in voting. And this gap is substantially wider than it was five years ago – the result of a steep drop in support among Republicans. In April 2020, during the early months of the COVID-19 pandemic, 70% of Americans favored allowing any voter who wanted to cast a ballot via mail to do so. This included nearly half of Republicans (49%) and nearly nine-in-ten Democrats (87%). Now, 58% of Americans support allowing voters to cast ballots by mail, including 32% of Republicans and 83% of Democrats. Voting by mail is more widespread today than it was before the pandemic, though the share of voters who cast their ballots in person in 2024 was greater than the share who did so in the pandemic election of 2020. According to Pew Research Center’s study of validated voters, voters in the 2024 presidential election were roughly equally likely to have voted in person on Election Day (34%), early in person (32%) or by mail (34%). Trump voters were more likely to vote in person on Election Day (38% of his voters did so) than voters who supported then-Vice President Kamala Harris (29%). Voting by mail and state election rules While support for no-excuse absentee voting is strongly associated with party, both Republicans and Democrats living in states where mail-in voting is more common are more likely to support the practice than those living in states where absentee and mail-in voting is more restricted. In states with universal mail-in voting – like California, Colorado and Nevada, where ballots are mailed to all voters before the election – 73% favor allowing any voter to vote by mail, including 91% of Democrats and 46% of Republicans. In states where voters can request an absentee ballot for any reason, but ballots aren’t automatically sent to them – like Florida, New York and Pennsylvania – 58% favor allowing any voter to cast a ballot by mail. Support for mail-in voting is lowest in states where voters can only cast a mail ballot if they have a valid excuse. (For example, in Texas, excuses include being 65 years of age or older, illness or disability, or a legitimate reason for being out of one’s home county on Election Day.) In these states, 45% favor allowing anyone to vote by mail, including 22% of Republicans and 71% of Democrats. Other proposals: Voter ID, paper backups, removing inactive voters and ballot collections Broad bipartisan majorities continue to support requiring electronic voting machines to print a paper backup of the ballot: 84% of all U.S. adults favor this, including 87% of Republicans and 82% of Democrats. Voter ID Support for photo ID requirements also remains widespread in both parties. More than nine-in-ten Republicans (95%) and

Majority of Americans Continue to Back Expanded Early Voting, Voting by Mail, Voter ID Read More »

4. How do Americans think journalists should act?

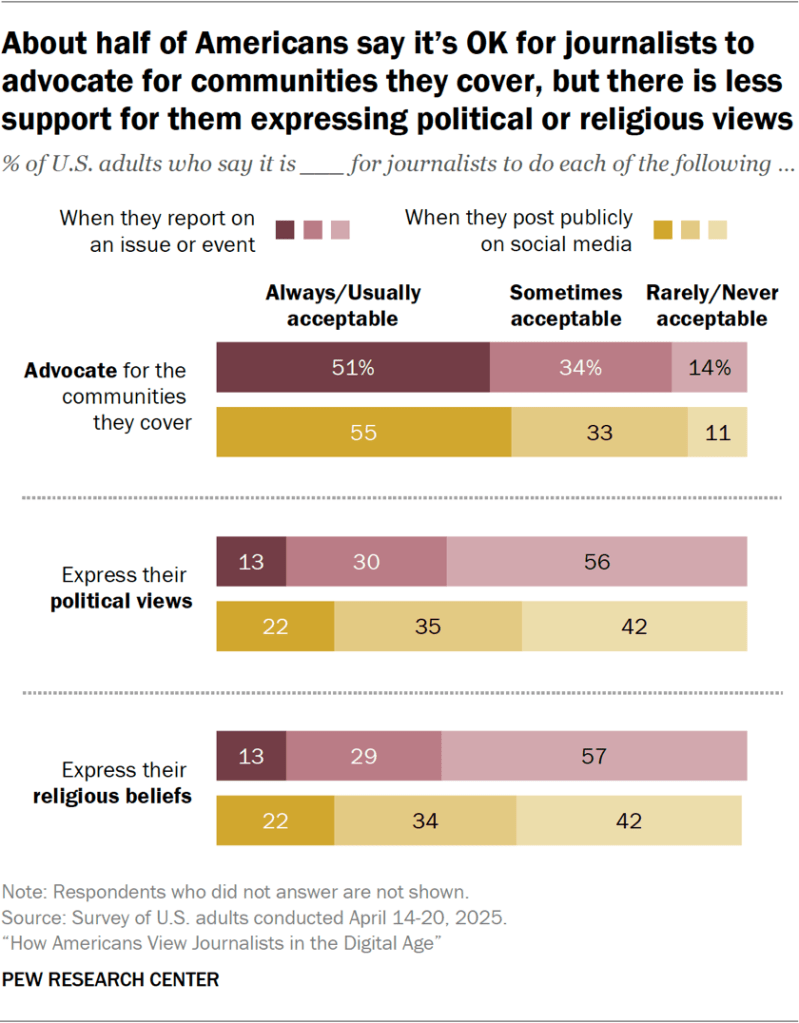
This is the fourth of four detailed sections in a report on Americans’ views about the role of journalists in the digital age. The report also includes an overview of the key findings. This section includes several questions we asked Americans (in both a survey and focus groups) about how acceptable it is for journalists to advocate for the communities they cover or express their own personal views and beliefs – both in the context of their work and in public social media posts. With these questions, we hoped to speak to an ongoing debate about the traditional concepts of objectivity and neutrality in journalism. We also asked about how people think journalists should handle some of the decisions they encounter in their day-to-day job. Attitudes toward journalists advocating for communities they cover and expressing personal views Americans express mixed views about the role of advocacy in journalists’ work and social media presence. About half of U.S. adults (51%) say that when journalists are reporting on an issue or event, it is always or usually acceptable for them to advocate for the communities they cover. About a third (34%) say this is sometimes acceptable, while 14% say it is rarely or never acceptable. People express similar views when asked if it’s acceptable for journalists to advocate for communities they cover when they post publicly on social media. However, Americans are far less likely to find it acceptable for journalists to express personal views when they are reporting on issues or events. Equal shares of U.S. adults – 13% each – say it’s always or usually acceptable for journalists to express their political views or religious beliefs when reporting on issues or events. Majorities of Americans say this is rarely or never acceptable (56% and 57%, respectively). People are somewhat more accepting of journalists sharing political or religious views publicly on social media: 22% think it is always or usually acceptable for journalists to do this in both cases, and about a third (35% and 34%, respectively) say it’s sometimes acceptable. But in each case, the most common view is that it’s rarely or never acceptable for journalists to post these kinds of views publicly on social media. When asked about journalists advocating for the communities they’re covering or for social or political change, focus group participants expressed mixed views. Some took a hard line against advocacy: As one man in his 30s said, “If you’re a journalist, let’s stick to journalism. And if you want to be an influencer or a social change warrior or whatever, just stick to that … when you expect them to be a journalist, you expect them to be neutral.”   Others felt advocacy could be acceptable in some cases, as long as journalists are, first and foremost, finding and reporting the facts. As one woman in her 50s said, journalists “should remain neutral until they get all the facts in.” A woman in her 20s said about journalists sharing opinions, “I think good, have it, express it, but just you can’t make the news your opinion. You still have to convey the facts and then explain why your opinion is what it is. … I just think if it’s too mixed, you erase the news and hide it behind a position.” Some of those who are open to advocacy by journalists described it as serving communities’ needs or speaking for those who don’t have power. One man in his 4os said, “I think the stories that journalists tell are supposed to be reflective of the people that consume the news, so if they’re advocating for certain communities that watch and tune in, look for that type of content, I think it makes sense.” One woman in her 50s said advocacy by journalists can start broader conversations in society, adding, “The ultimate goal, I guess, in reporting is to make our society the best it can be. Or that’s what it should be.” Some also suggested advocacy is more acceptable in particular types of journalistic work, such as investigative reporting, or when discussing topics they see as “nonpartisan.” One woman in her 20s said, “If it’s something everyone can agree on, like a natural disaster or a mass shooting … there’s a same kind of opinion that it’s sad or those victims should get help.” Overall, the survey found that younger adults are more likely than older people to say it is always or usually acceptable for journalists to advocate for communities they cover and express their views – but these age differences are particularly stark when it comes to social media: 63% of Americans ages 18 to 29 say it’s always or usually acceptable for journalists to advocate for the communities they cover when posting publicly on social media, compared with 45% of those 65 and older. About three-in-ten adults under 30 think it’s generally acceptable for journalists to express their political views (32%) or religious beliefs (31%) publicly on social media, roughly double the share of adults 65 and older who say the same (15% on both). When it comes to political party, Democrats and independents who lean Democratic are more likely than Republicans and Republican leaners to say it is always or usually acceptable for journalists to advocate for communities they cover, both in reporting and on social media. At the same time, Republicans are slightly more likely than Democrats to see it as acceptable for journalists to express their religious beliefs. (Republicans also tend to be more religious than Democrats by a variety of measures.) Do Americans think journalists can separate their personal views from their reporting? While many Americans say it is rarely or never acceptable for journalists to express personal views when reporting, people also commonly express skepticism about whether it’s even possible for journalists to separate their views from their reporting. More Americans think journalists are often unable to separate their personal views from what they report on (56%) than think they are largely able to do

4. How do Americans think journalists should act? Read More »

2. What makes someone a journalist?

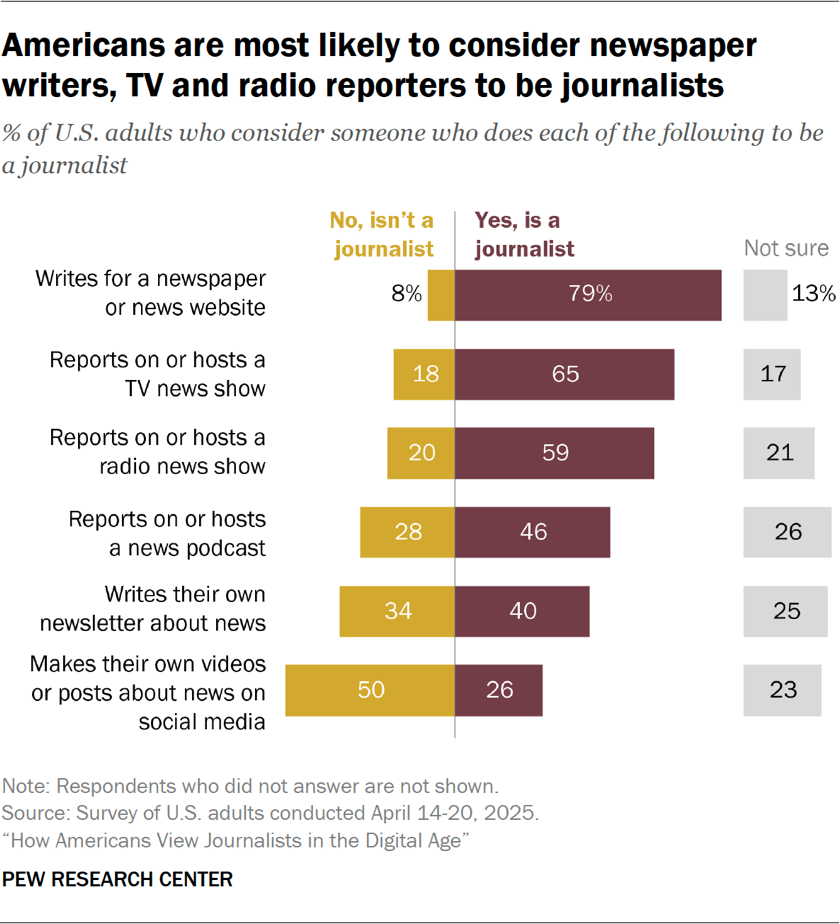
This is the second of four detailed sections in a report on Americans’ views about the role of journalists in the digital age. The report also includes an overview of the key findings. People increasingly get news from a wide range of sources online. With that in mind, the questions in this section were intended to explore what makes someone a journalist in the eyes of the American public. We approached this from multiple angles, including the platforms that news providers use and the types of news content they produce. Americans largely think of people who work on news content in “traditional” media as being journalists, while there is less consensus about those in “new” media. Majorities of U.S. adults say they consider someone who writes for a newspaper or news website (79%), reports on or hosts a TV news show (65%), or reports on or hosts a radio news show (59%) to be a journalist. Fewer say the same about people who host a news podcast (46%), write their own newsletter about news (40%) or post about the news on social media (26%). In each of these cases, roughly a quarter of Americans say they aren’t sure whether these people are journalists, perhaps reflecting the wide variety of individuals engaged in these practices. Focus group participants indicated – and some of our survey respondents volunteered – that there are some people who do these things who they would consider journalists, and others they would not. Focus group participants expressed mixed perspectives on individuals sharing news content via podcasts or social media, though many distinguished them from “journalists.” Some considered these sources “entertaining” but not necessarily accurate. Others appreciated the depth of storytelling individuals can offer via new media formats like podcasts and said these sources’ “hands aren’t tied like traditional media, so they’re able to … get into subjects that main news channels or specific people wouldn’t be willing to talk about.” Our survey finds that these perceptions vary widely by age. Younger adults tend to be much more likely than older Americans to say that people who report on or host a news podcast, write their own newsletter about news, or make posts about news on social media are journalists. For example, 41% of adults ages 18 to 29 say someone who posts about news on social media is a journalist, while just 14% of those 65 and older say the same. Some younger participants in our focus groups illustrated these differences when discussing their own news sources. For instance, one woman in her 30s said, “Back when I was a little kid, I always looked at the journalists on TV and I’m like, oh, OK, this is my news source, this is who my grandparents, my mom … went to to find out information. But now as I’m coming up as a Millennial looking at the news source, I don’t have to rely on them. I can rely on these podcasters and influencers who are actually reporting on every little thing that’s going on that I didn’t know was going on because mainstream [media] didn’t tell me about it.” Meanwhile, differences by political party are modest. Majorities of both Republicans and Democrats agree that someone who writes for a newspaper or a news website would be considered a journalist: 83% of Democrats and Democratic-leaning independents say this, as do 76% of Republicans and Republican leaners. Republicans are slightly more likely than Democrats to consider people who host podcasts about the news (50% vs. 43%) or write a newsletter about the news (43% vs. 38%) to be journalists. In addition to asking about the medium someone uses to discuss the news, the survey also asked respondents whether they think people who produce various types of news content are journalists. Americans are most likely to see those who primarily conduct their own reporting (59%) as journalists. Smaller shares say they consider those who compile and share other people’s reporting on current events (36%) or offer opinions or commentary on current events (28%) to be journalists. Younger Americans are far more likely than older groups to consider each of these three types of news content producers to be journalists. For instance, seven-in-ten adults under 30 say they would consider someone who primarily conducts their own reporting on current events to be a journalist, versus 47% of those 65 and older. Again, some respondents express uncertainty: In each case, roughly one-in-five Americans say they are not sure if they would consider someone who primarily produces each kind of content to be a journalist. Focus group participants largely agreed that conducting “original reporting” is an important expectation they hold for journalists specifically. Several participants described compiling news as a “game of telephone,” where information can easily get “lost in translation” or opinions or bias can be introduced. As one man in his 40s explained, “Everybody whispers to the next person one word, and by the time it comes out, it’s a completely different word. When you’re just rephrasing or rewording something that’s already been out there, you lose translation there and sometimes stuff gets inaccurate. So being the first source with info is usually, in my opinion, best.” At the same time, people’s expectations of what news providers more broadly can reasonably do vary depending on the type of source, their size and resources, and what type of news they’re covering. One woman in her 30s noted that “they all hold different thresholds.” A woman in her 20s said, “I hold [traditional sources] to that standard. Like, they should have the resources so they should do original reporting. They should check their own facts, be involved in all of that. I don’t think I would hold smaller sources to that same standard because otherwise, if it’s one person creating their podcast, which I think is great because then they have more freedom of … not being bound by sponsors or other editing influences. But then they’re naturally more limited. They can’t

2. What makes someone a journalist? Read More »

Methodology C: Definitions and concepts

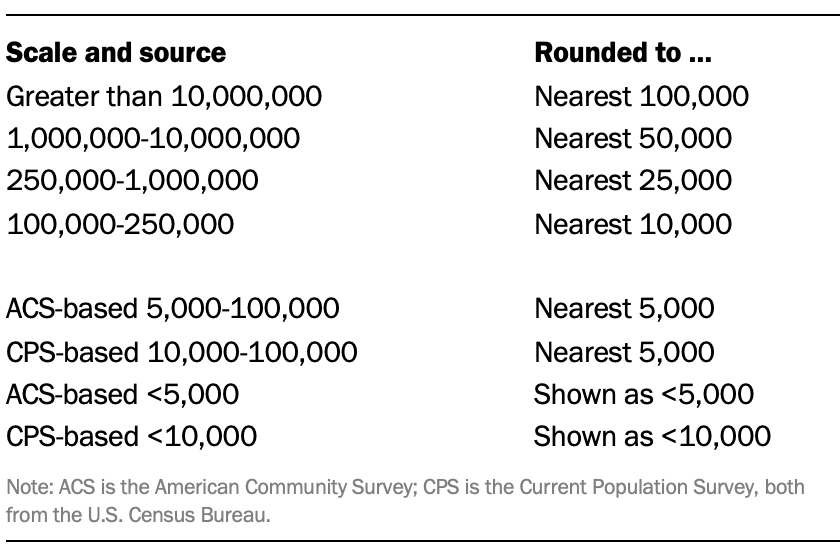
This report presents estimates of the number of unauthorized immigrants in the United States as of July 2023 and for earlier years. These estimates supersede all previously published Pew Research Center estimates. This appendix provides details on how the estimates are rounded and definitions of various concepts used in the report. This methodology section is the third of three. Two others describe other parts of the report’s methodology. The first (Methodology A) describes the methods used to produce the estimates of the unauthorized immigrant population and its characteristics. The second section (Methodology B) describes the principal survey data used to produce the estimates and modifications made to the underlying surveys. Rounding of population estimates All estimates for unauthorized immigrant populations are presented as rounded numbers to avoid the appearance of unwarranted precision in the estimates. The rounding conventions for unauthorized immigrant estimates, dependent somewhat on data sources, are: Estimates for 1990 are based on the 1990 decennial census and use rounding conventions based on the American Community Survey (ACS). These same conventions are used to round the 90% confidence interval limits, presented as “Range (+ or -),” with one exception: limits that round to less than 5,000 are rounded to the nearest 1,000. For state- and national-level data on the total population or total foreign-born population, figures are rounded to the nearest 10,000. Unrounded numbers are used for significance tests, for plotting charts and for computations of differences and percentages. Where differences are reported, they are computed from unrounded estimates and then rounded. Because each figure is rounded separately, the rounded estimates may not add to rounded totals. Similarly, percentages computed from rounded numbers may differ from the percentages shown in this report. Countries and regions of birth The estimates presented in this report are based on Census Bureau data from the American Community Survey (ACS) and Current Population Survey (CPS). Accordingly, the countries of birth we report are limited to those for which survey data is provided. Defining regions of the world and, in some cases, specific countries using the various data sources requires grouping areas into identifiable units and “drawing lines” on the world map. We have defined our geographic groups using the United Nations and DHS definitions, plus Census Bureau groupings for racial groups (e.g., Asian and Middle Eastern-North African). Countries and areas as reported by the ACS (IPUMS) and the CPS  are grouped into the regions used in this report as. Note that the list below uses the country names directly from the IPUMS and CPS codes and may differ from geographic naming and grouping conventions used in other Pew Research Center publications: Mexico – Reported separately because of its prominence in migration flows to the U.S. Central America – Belize, Costa Rica, El Salvador, Guatemala, Honduras, Nicaragua, Panama, Central America Caribbean – Antigua-Barbuda, Bahamas, Barbados, Cuba, Dominica, Dominican Republic, Grenada, Haiti, Jamaica, Puerto Rico, St. Kitts-Nevis, St. Lucia, St. Vincent, Trinidad & Tobago, U.S. Virgin Islands, Caribbean not specified, West Indies not specified, Americas not specified  South America – Argentina, Bolivia, Brazil, Chile, Colombia, Ecuador, Guyana, Paraguay, Peru, Uruguay, Venezuela, South America not specified Canada-North America – Bermuda, Canada, North America Europe – Albania, Armenia, Austria, Azerbaijan, Azores, Belgium, Bosnia, Bulgaria, Belarus, Croatia, Cyprus, Czechia, Czechoslovakia, Denmark, England, Estonia, Finland, France, Germany, Great Britain, Greece, Holland, Hungary, Iceland, Ireland, Italy, Kosovo, Latvia, Lithuania, Macedonia, Moldavia, Montenegro, Netherlands, Northern Ireland, Norway, Poland, Portugal, Republic of Georgia, Romania, Russia, Scotland, Serbia, Slovakia, Spain, Sweden, Switzerland, Ukraine, United Kingdom, USSR, Yugoslavia, Europe not specified Asia – Afghanistan, Bangladesh, Bhutan, Burma, Cambodia, China, Hong Kong , India, Indonesia, Japan, Kazakhstan, Kirghizia, Korea, Laos, Malaysia, Mongolia, Nepal, North Korea, Pakistan, Philippines, Singapore, Sri Lanka, South Korea, Taiwan, Thailand, Uzbekistan, Vietnam, Asia not elsewhere classified (n.e.c.), East Asia not specified Middle East-North Africa (MENA) – Algeria, Egypt, Iran, Iraq, Israel, Jordan, Kuwait, Lebanon, Libya, Morocco, Palestine, Saudi Arabia, Syria, Tunisia, Turkey, United Arab Emirates, Yemen Arab Republic, Middle East, North Africa not specified Sub-Saharan Africa – Cameroon, Cape Verde, Congo, Eritrea, Ethiopia, Gambia, Ghana, Guinea, Ivory Coast, Kenya, Liberia, Nigeria, Rwanda, Senegal, Sierra Leone, Somalia, South Africa (Union of), South Sudan, Sudan, Tanzania, Togo, Uganda, Zaire, Zambia, Zimbabwe, Africa not specified or n.e.c., Eastern Africa not specified or n.e.c., Other Africa, Western Africa not specified Oceania and other – American Samoa, Australia, Fiji, Guam, Marshall Islands, Micronesia, New Zealand, Northern Mariana Islands, Samoa, Tonga, Elsewhere, Other n.e.c. This list represents only those countries and areas identified in the microdata for the ACS (from IPUMS) and the CPS; it does not include all countries. For the CPS, individuals originally reported as born “Elsewhere” were assigned specific countries of birth to ensure that all foreign-born respondents are classified by country or region of birth. The assignment process uses reported countries of birth of respondents’ parents, other family members and information on race and Hispanic origin. Not all individuals born in these areas outside the 50 states and the District of Columbia are part of the foreign-born or immigrant population. Some of the areas above are U.S. territories, and people born in those areas are U.S. citizens. In addition, individuals born outside the U.S. and its territories are citizens at birth if they have a U.S.-citizen parent. This group is known as “born abroad of American parents” and is not part of the foreign-born population. Specific countries of birth For this report, several specific countries are combined for both geopolitical reasons and reporting in the surveys. China, Hong Kong and Taiwan are combined and reported as “China” because of potential inconsistencies between the administrative data sources and the surveys and because of concerns over consistency of reporting on the part of respondents. “Korea” includes responses of Korea, North Korea and South Korea; the vast majority of Korean immigrants in the U.S. are from South Korea. “Dominican Republic” includes persons born in the Dominican Republic and a very small number reported as born in Dominica. Most of the respondents in the latter group appear to have been miscoded. When data

Methodology C: Definitions and concepts Read More »