Pew Research Center

Public Trust in Scientists and Views on Their Role in Policymaking

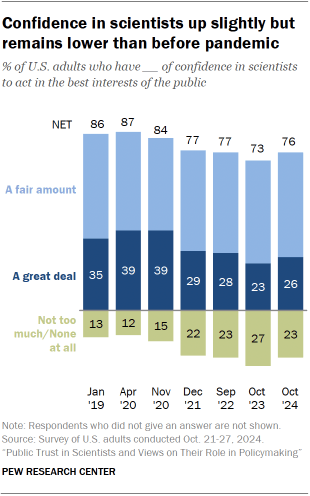
Trust moves slightly higher but remains lower than before the pandemic Pew Research Center conducted this study to understand how Americans view scientists and their role in making public policy. For this analysis, we surveyed 9,593 U.S. adults from Oct. 21 to 27, 2024. Everyone who took part in the survey is a member of the Center’s American Trends Panel (ATP), a group of people recruited through national, random sampling of residential addresses who have agreed to take surveys regularly. This kind of recruitment gives nearly all U.S. adults a chance of selection. Surveys were conducted either online or by telephone with a live interviewer. The survey is weighted to be representative of the U.S. adult population by gender, race, ethnicity, partisan affiliation, education and other categories. Read more about the ATP’s methodology. Here are the questions used for this report, the topline and the survey methodology. A majority of Americans say they have confidence in scientists to act in the public’s best interests. Confidence ratings have moved slightly higher in the last year, marking a shift away from the decline in trust seen during the COVID-19 pandemic. A new Pew Research Center survey of 9,593 U.S. adults conducted Oct. 21-27, 2024, takes a close look at the public image of scientists, who serve as one potential source of information for Americans navigating complex policy debates and everyday decisions around things like their personal health and wellness. Key findings 76% of Americans express a great deal or fair amount of confidence in scientists to act in the public’s best interests. This is up slightly from 73% in October 2023 and represents a halt to the decline seen during the COVID-19 pandemic. Scientists continue to enjoy strong relative standing compared with the ratings Americans give to many other prominent groups, including elected officials, journalists and business leaders. Majorities view research scientists as intelligent (89%) and focused on solving real-world problems (65%). In addition, about two-thirds (65%) view research scientists as honest and 71% view them as skilled at working in teams. Communication is seen as an area of relative weakness for scientists. Overall, 45% of U.S. adults describe research scientists as good communicators. A slightly larger share (52%) say this phrase does not describe research scientists well. Another critique many Americans hold is the sense that research scientists feel superior to others; 47% say this phrase describes them well. Americans are split over scientists’ role in policymaking. Overall, 51% say scientists should take an active role in public policy debates about scientific issues. By contrast, nearly as many (48%) say they should focus on establishing sound scientific facts and stay out of public policy debates. Americans also aren’t convinced scientists make better policy decisions on science issues than other people – just 43% think this is the case. Democrats continue to express more confidence than Republicans in scientists, but ratings within the GOP have edged higher in the last year. A larger majority of Democrats than Republicans express confidence in scientists to act in the public’s best interests (88% vs. 66%). Though the partisan gap in trust remains sizable, Republicans’ overall level of confidence in scientists is up 5 percentage points compared with a year ago – the first uptick in trust among Republicans since the start of the pandemic. Partisans also differ over scientists’ role in policy debates, with Democrats far more supportive than Republicans of active engagement in making policy on scientific issues. Trends in trust in scientists In recent years, the scientific community has engaged with the public’s declining trust directly, and there are multiple organizations working on ways to support trust in science and improve communication with wider audiences. About three-quarters of Americans say they have either a great deal (26%) or a fair amount (51%) of confidence in scientists to act in the best interests of the public. This share is up slightly since last year. Still, levels of confidence in scientists remain lower than in April 2020 – at the outset of the COVID-19 pandemic. At that time, 87% expressed at least a fair amount of confidence in scientists, including 39% who said they had a great deal of confidence. Trust in scientists compared with trust in other groups In an era of low public trust in institutions, scientists continue to be held in higher regard than several other prominent groups we’ve asked about, including journalists, elected officials, business leaders and religious leaders. Confidence ratings for scientists are even slightly higher than those for public school principals and police officers – two groups that receive positive overall ratings. Go to the Appendix for more detailed views of these groups. The Appendix also includes views of medical scientists, whose ratings are very similar to those for scientists generally. Differences in confidence by party Roughly nine-in-ten Democrats and Democratic-leaning independents (88%) express a great deal or fair amount of confidence in scientists to act in the public’s best interests. The share of Democrats with at least a fair amount of confidence in scientists is similar to levels seen prior to the pandemic. However, the share of Democrats who express a great deal of confidence in scientists stands at 40%, significantly below the peak in strong trust seen during the pandemic’s first year. In April 2020, 52% of Democrats expressed a great deal of confidence in scientists, and in November 2020, that share reached 55%. Republicans’ views follow a different pattern. Two-thirds of Republicans and Republican leaners say they have a great deal or a fair amount of confidence in scientists to act in the public’s best interest. About a third (34%) express distrust, saying they have not too much or no confidence at all in scientists. In April 2020, an 85% majority of Republicans said they had a great deal or fair amount of confidence in scientists, compared with just 14% who had little or no confidence. While GOP ratings of scientists remain much lower than they were before the pandemic, there has been a slight

Public Trust in Scientists and Views on Their Role in Policymaking Read More »
2024 National Public Opinion Reference Survey Methodology

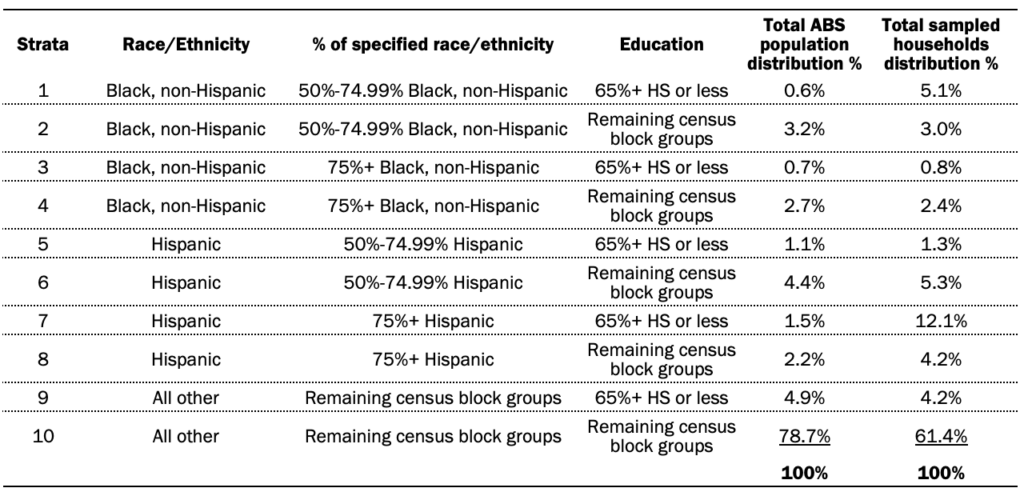
Summary SSRS conducted the National Public Opinion Reference Survey (NPORS) for Pew Research Center using address-based sampling and a multimode protocol. The survey was fielded from Feb. 1, 2024, to June 10, 2024. Participants were first mailed an invitation to complete an online survey. A paper survey was later mailed to those who did not respond. Additionally, the mailings invited participants to call a toll-free number to take the survey over the phone with a live interviewer. In total, 2,535 respondents completed the survey online, 2,764 respondents completed the paper survey, and 327 respondents completed the survey over the phone (total N=5,626). The survey was administered in English and Spanish. The American Association for Public Opinion Research (AAPOR) Response Rate 1 was 32%. Sample definition The sample was drawn from the U.S. Postal Service Computerized Delivery Sequence File and was provided by Marketing Systems Group (MSG). Occupied residential addresses (including “drop points”) in all U.S. states (including Alaska and Hawaii) and the District of Columbia had a nonzero chance of selection. The draw was a national, stratified random sample, with differential probabilities of selection across the mutually exclusive strata. SSRS designed the sample plan as shown in the table below. Mailing protocol SSRS sent initial mailings in a 9-by-12-inch window envelope via first-class mail to the 18,834 sampled households. These packets included two $1 bills (visible from the outside of the envelope) and a letter that asked a member of the household to complete the survey. The letter provided a URL for the online survey; a toll-free call-in number; a password to enter on the online survey’s landing page or to read to the telephone interviewers if they chose to call in; and a FAQ section printed on the reverse side. If two or more adults were in the household, the letter asked the adult with the next birthday to complete the survey. Nonresponding households were later sent a reminder postcard and then a reminder letter via first-class mail. After the web portion of the data collection period had ended, SSRS sent nonresponding households with a deliverable address a 9-by-12-inch Priority Mail window envelope. The Priority envelope contained a letter with a FAQ section printed on the reverse side, a visible $5 bill, a paper version of the survey and a postage-paid return envelope. The paper survey was one 11-by-17-inch page folded booklet-style. The within-household selection instructions were identical to those used in the earlier online survey request. The same households were later sent a second envelope containing another copy of the paper questionnaire by first-class mail. The initial mailing was sent out in two separate launches: soft launch and full launch. The soft launch made up 5% of the sample and was sent out several days earlier than the full launch. The full launch consisted of the remaining sample. Pew Research Center developed the questionnaire in consultation with SSRS. The online questionnaire was tested on both desktop and mobile devices. The test data was analyzed to ensure the logic and randomizations were working as intended before the survey was launched. Questionnaire development and testing Pew Research Center developed the questionnaire in consultation with SSRS. The online questionnaire was tested on both desktop and mobile devices. The test data was analyzed to ensure the logic and randomizations were working as intended before the survey was launched. Weighting The survey was weighted to support reliable inference from the sample to the target population of U.S. adults. The weight was created using a multistep process that includes a base weight adjusting for differential probabilities of selection and a raking calibration that aligns the survey with the population benchmarks. The process starts with the base weight, which accounted for the probability of selection of the address from the U.S. Postal Service Computerized Delivery Sequence File frame, as well as the number of adults living in the household, and incorporated an adaptive mode adjustment for cases that responded in an offline mode. Then the base weights are calibrated to population benchmarks using raking, or iterative proportional fitting. The raking dimensions and the source for the population parameter estimates are reported in the table below. All raking targets are based on the noninstitutionalized U.S. adult population (ages 18 and older). These weights are trimmed at the 1st and 99th percentiles to reduce the loss in precision stemming from variance in the weights. Design effect and margin of error Weighting and survey design features that depart from simple random sampling tend to result in an increase in the variance of survey estimates. This increase, known as the design effect, or “deff,” should be incorporated into the margin of error, standard errors and tests of statistical significance. The overall design effect for a survey is commonly approximated as one plus the squared coefficient of variation of the weights. For this survey, the margin of error (half-width of the 95% confidence interval) incorporating the design effect for full sample estimates at 50% is plus or minus 1.8 percentage points. Estimates based on subgroups will have larger margins of error. It is important to remember that random sampling error is only one possible source of error in a survey estimate. Other sources, such as question wording and reporting inaccuracy, may contribute additional error. A summary of the weights and their associated design effect is reported in the table below. The following table shows the unweighted sample sizes and the error attributable to sampling that would be expected at the 95% level of confidence for different groups in the survey. Sample sizes and sampling errors for other subgroups are available upon request. In addition to sampling error, one should bear in mind that question wording and practical difficulties in conducting surveys can introduce error or bias into the findings of opinion polls. A note about the Asian adult sample This survey includes a total sample size of 231 Asian adults. The sample primarily includes English-speaking Asian adults and therefore may not be representative of the overall Asian adult population.

2024 National Public Opinion Reference Survey Methodology Read More »

Why Many Parents and Teens Think It’s Harder Being a Teen Today

HARDER: social media “Social media has made it a nightmare and contributes to teens’ anxiety and depression.” MOTHER, 50s HARDER: internet/being online “The internet, simple as that. Now kids are constantly always on the internet doing stupid stuff.” MOTHER, 30s HARDER: the world/country has changed in a bad way “Kids can’t just be kids anymore and there is lots of crap that they shouldn’t have to deal with, like gender issues – that’s bulls—.” MOTHER, 30s HARDER: internet/being online “They also have to be more careful of who they share information [with] online.” MOTHER, 50s HARDER: more pressures and expectations “There is a lot of pressure put on kids to do everything and be as busy as possible.” MOTHER, 40s HARDER: more pressures and expectations “There is much more pressure to “fit in.”” FATHER, 40s HARDER: more pressures and expectations “I think that there is more peer pressure today on teenagers.” MOTHER, 50s HARDER: phones/smartphones “Nowadays, teenagers just want to be on their phones and be lazy.” MOTHER, 30s HARDER: social media “Social media affects how teenagers view themselves and they determine their self-worth based on others’ experiences.” MOTHER, 40s HARDER: more pressures and expectations “Too much pressure to be like something or someone else. It’s hard to be yourself.” FATHER, 50s HARDER: kids acting differently “Children and teenagers these days are weak, spoiled and lazy.” FATHER, 50s EASIER: the way of parenting today “Parents seem better equipped to help their children to try to give them a better life than what they had.” MOTHER, 50s EASIER: phones/smartphones “They have access to lots of things with their cellphone. We had to go places to do research for schoolwork or had to make up schoolwork after school instead of while at home.” MOTHER, 30s HARDER: more pressures and expectations “More pressure to succeed.” MOTHER, 40s HARDER: social media “I think the pressure social media puts on kids is hard. Info can get out very fast. Also, info is permanently out there.” MOTHER, 50s HARDER: the world/country has changed in a bad way “Ungodliness is being pushed harder than ever before.” FATHER, 40s HARDER: social media “Social media puts more pressure to be perfect than it did when I was younger.” MOTHER, 30s HARDER: the world/country has changed in a bad way “Other kids and people have lower moral standards.” MOTHER, 30s HARDER: violence and drugs “There wasn’t as much violence as nowadays and the streets were safer to walk on at night. There is also a lot of different dangerous drugs as well that we didn’t have before.” MOTHER, 40s EASIER: fewer pressures and expectations “The education system has been dumbed down. Rather than have students achieve a high standard, they have lowered the standard so that more students can achieve them. I believe they call it equity. The same with sports – everyone is a winner.” FATHER, 50s HARDER: violence and drugs “Today, teenagers have to worry about being shot at – it’s too many people who are getting shot.” FATHER, 30s HARDER: social media “Very simply, the difference is social media.” FATHER, 40s EASIER: technology in general/other technology “Everything is at their fingertips now with all this technology.” FATHER, 50s EASIER: mental health concerns “I think mental health is taken more seriously, so parents are more in tune with their childrens’ emotions.” MOTHER, 30s HARDER: exposure to bad influences “Much more access to things that are not appropriate for teenagers.” FATHER, 40s EASIER: fewer pressures and expectations “Kids are spoon-fed nowadays.” FATHER, 60s HARDER: mental health concerns “The amount of mental health in this world is out the roof. Not much support to the youth.” FATHER, 40s HARDER: social media “Because of social media, it’s harder for kids to make friends. And kids are just meaner and they are expected to look a certain way or act a certain way just to fit in.” MOTHER, 30s EASIER: phones/smartphones “They have cellphones that pretty much do everything for them so they don’t have to think on their own.” FATHER, 40s HARDER: more pressures and expectations “Teenagers trying to fit in and be acceptable in their circles.” MOTHER, 40s HARDER: social media “Social media has put more pressure on teens.” MOTHER, 40s HARDER: social media “Social media has made it hard for today’s youth. You’re never truly alone. Your peers are always watching.” FATHER, 40s EASIER: more resources/information available to them “They have more access to things that we didn’t.” MOTHER, 30s HARDER: more pressures and expectations “There are so many people telling them who to be and what to think and not letting them be themselves.” MOTHER, 40s HARDER: bullying “There is too much bullying [and] kids picking on kids.” MOTHER, 40s HARDER: technology in general/other technology “Technology. Teens today have the world – the good and the bad – at their fingertips.” MOTHER, 30s HARDER: the world/country has changed in a bad way “It’s harder today because of all the woke, LBGQT alphabet people garbage that is being rammed down children’s throats in school and society.” FATHER, 50s HARDER: phones/smartphones “Social media accounts and everyone’s access to smartphones or electronic devices allows for the information to be distributed to a large amount of recipients faster.” MOTHER, 40s HARDER: more pressures and expectations “Being a teenager today means a lot of academic stress and homework, as well as tons of extracurricular activities. It is very hard for teenagers to efficiently manage their time while getting enough sleep.” MOTHER, 40s HARDER: social media “Poisonous social media!!!” FATHER, 50s EASIER: phones/smartphones “We didn’t have smartphones when I was a teenager. Nowadays, teenagers have all the answers in the palm of their hand.” FATHER, 40s EASIER: technology in general/other technology “The technology has advanced so much that they have more access to information.” MOTHER, 40s HARDER: the world/country has changed in a bad way “There is more discrimination.” MOTHER, 30s HARDER: social media “Social media makes teenagers easier to bully, more likely to compare and more difficult to manage.” FATHER, 30s HARDER:

Why Many Parents and Teens Think It’s Harder Being a Teen Today Read More »

The Pew Charitable Trusts

One of the great challenges of our time is saving the natural environment and the rich array of life it supports on land and in the sea. The Pew Charitable Trusts’ conservation efforts—both in the U.S. and abroad—help to preserve wild places and rivers, restore biodiversity, and increase the understanding of ocean ecology. On land, we focus on conserving wildlife corridors, shorelines, and pristine landscapes, as well as advancing policies that prioritize investments in flood-ready infrastructure and national park maintenance. Pew also works to minimize the consequences of overfishing, pollution, warming waters, and loss of habitat. Our conservation goals are based on facts from science and data research. source

The Pew Charitable Trusts Read More »

2. Confidence in voting access and integrity; expectations for whether and when the election results will be clear

Ahead of the November election, voters overwhelmingly express the importance of several items related to voting access and the outcome of the election. Wide majorities of voters say it is very or somewhat important that: People who are qualified to vote are able to cast a ballot (98%) and that people who try to intimidate or threaten voters at polling places are stopped (96%). People who are not legally qualified to vote are prevented from doing so (89%). It is clear who won after all votes are counted (98%) and that the outcome of the presidential race is known within a day or two (92%). And while sizable majorities of supporters of Vice President Kamala Harris and former President Donald Trump both view these objectives as important, they tend to differ in how confident they are that each will happen. Ballot access and voter intimidation Nearly all Harris and Trump supporters (99% each) say it’s at least somewhat important that people who are legally qualified and want to vote are able to cast a ballot, while nearly as many say that it’s important that people who try to intimidate or threaten voters at polling places are stopped. About nine-in-ten among each candidate’s supporters are also very or somewhat confident that eligible voters who want to cast a ballot will be able to do so. Harris’ supporters are slightly more likely than Trump’s to express confidence that people trying to intimidate voters will be stopped (73% of Harris supporters vs. 64% of Trump supporters are at least somewhat confident). A clear winner and timely outcome Harris (99%) and Trump (98%) supporters are nearly unanimous in their belief that it’s at least somewhat important that it be clear who won the election after all votes are counted, with about nine-in-ten in each group saying this is very important. But Trump supporters are much less likely than Harris supporters to express confidence that it will be clear who won. While 58% of Trump supporters are very or somewhat confident it will be clear who won after all votes are counted, a much larger majority of Harris supporters (85%) are confident the result will be clear. Large majorities of both Trump (95%) and Harris (89%) supporters say it is important that Americans know who won the race within days of Election Day. However, Trump supporters are more likely than Harris supporters to say this is very important (75% vs. 60%). Harris supporters (69%) are more likely than Trump supporters (59%) to express confidence that the winner will be promptly known, although about four-in-ten each are only somewhat confident that this will happen. Ensuring only eligible citizens cast ballots Nearly identical majorities of all voters say it is very or somewhat important to stop noncitizens from voting (90%) and to prevent people who are not qualified to vote from doing so (89%). While large shares of both Harris and Trump supporters view the prevention of ineligible voters from casting ballots as at least somewhat important, Trump supporters are more likely to say this is very important. Harris supporters are far more confident than Trump supporters that people who are not legally qualified to vote will be prevented from voting.  Harris supporters (87%) overwhelmingly express confidence that people who are not qualified to vote will be prevented from doing so, with 52% saying they’re very confident in this. Harris supporters express similar confidence that noncitizens will not be able to vote. By contrast, just 35% of Trump supporters are confident that noncitizens will be stopped from voting, while 30% say the same of blocking voting access for all those not legally qualified to vote. How voters’ views today compare with opinions in 2020 Citizens casting ballots As was the case in 2020, there is close agreement on the importance of eligible Americans who want to vote being able to cast a ballot. But 2024 Harris supporters (89%) are more likely than 2020 Biden supporters (77%) to say they are at least somewhat confident this will happen. Trump supporters’ confidence on this item has changed little compared with four years ago. Timeliness of the outcome Voters today (92%) are more likely than voters in 2020 (82%) to say it’s important that Americans know the result of the presidential election quickly. This shift is concentrated among Democratic candidate supporters. Today, 89% of Harris supporters say it is very (60%) or somewhat (29%) important that this happens. That’s up from the 73% of Biden voters who said this was at least somewhat important in 2020. But both Harris and Trump supporters are more likely to express confidence that this will happen than Biden and Trump supporters were in 2020. While 69% of Harris supporters are at least somewhat confident that Americans will know the election results within a couple of days, 59% of Trump supporters are. This compares with about half of Biden and Trump supporters in 2020. source

2. Confidence in voting access and integrity; expectations for whether and when the election results will be clear Read More »

3. American voters’ expectations for voting this year

A majority of registered voters (62%) say they will or already have cast their ballot in person in the 2024 general election, with 38% planning to vote on Election Day and 24% planning to vote at an early voting location (or already having done so). Meanwhile, 28% of voters say that they expect to cast their vote by absentee or mail-in ballot (or already have). Trump supporters are more likely than Harris supporters to plan to vote in person, while Harris supporters are more than twice as likely as Trump supporters to plan to vote by mail. 74% of Trump supporters say they’ll vote in person, including 48% who say they will do so on Election Day (26% say they will vote early in person). By contrast, 52% of Harris supporters say they plan to vote in person (29% on Election Day, 23% early). 39% of Harris supporters expect to vote absentee or by mail, while just 17% of Trump supporters expect to use this method. These differences in vote method largely echo patterns seen in both the 2020 presidential election and the 2022 midterm election. Overall, the share of voters who intend to use each method of voting is only modestly different from the 2022 midterm election. But voters are substantially less likely to say they are planning to vote by mail than they were at this time in the 2020 campaign (when 39% of voters expected to vote that way) amid concerns about the coronavirus pandemic. How easy will it be to vote this year? About eight-in-ten voters (81%) expect it to be easy for them to vote in this year’s election, including 43% who say it will be very easy and 38% who say it will be somewhat easy. About two-in-ten (19%) say they expect it to be difficult to vote this year. These perceptions are roughly on par with the 2022 and 2018 elections. In 2020, about a third of voters (35%) expected that voting would be difficult that year. Today, large majorities of both Republican (83%) and Democratic (80%) candidate supporters say voting will be easy for them in November. How demographic groups view voting Across demographic groups, registered voters generally expect voting to be easy this year, with relatively modest differences in these views. Race and ethnicity Seven-in-ten Black voters say voting will be at least somewhat easy this year, compared with 75% of Hispanic voters, 82% of Asian voters and 84% of White voters. White voters are particularly likely to say it will be very easy to vote (47%). By comparison, 35% of Hispanic voters, 31% of Black voters and 29% of Asian voters say voting will be very easy. Age Voters under 30 are less likely than those in other age groups to say voting this year will be very easy: 31% say this, compared with 47% of voters 50 and older and 41% of those 30 to 49. Education Across education levels, large majorities of voters expect voting in November to be easy. Voters with a college degree, however, are more likely than those without one to expect voting to be very easy. About half of voters with at least a four-year college degree (48%) say voting will be very easy, compared with 39% of those with some college or less education. source

3. American voters’ expectations for voting this year Read More »

5. How Americans see differences between men and women

Most Americans, including majorities of men, women, Republicans and Democrats, say men and women are different in many ways. But there are gaps by gender and partisanship when it comes to views of whether biology or societal expectations are driving these differences. About two-thirds of U.S. adults or more say men and women are basically different in: How they express their feelings Their physical abilities Their approach to parenting Their hobbies and personal interests A majority (57%) say men and women are basically similar when it comes to the things they are good at in the workplace. Still, a sizable share (43%) sees men and women as different in this area. Views of whether men and women are different or similar vary modestly, if at all, by gender. There are wider gaps in these views by party. By margins of 14 percentage points or more, Republicans and Republican-leaning independents are more likely than Democrats and Democratic leaners to say men and women are basically different when it comes to: Their physical abilities (89% vs. 73%) Their hobbies and personal interests (75% vs. 61%) The things they are good at in the workplace (53% vs. 32%) Compared with 2017, when we last asked this question, Americans are now more likely to say men and women are different when it comes to their approach to parenting (+7 points), the things they are good at in the workplace (+6) and their physical abilities (+5). The role of biology and societal expectations in gender differences Among those who see differences between men and women, there is little agreement about whether these differences are mostly based on biology or on societal expectations. For example, of those who say men and women are different in their hobbies and personal interests, their approach to parenting, and the things they are good at in the workplace, about half say these differences are rooted in biology. Similar shares say they are based on societal expectations for men and women in these areas. Differences by gender On each of the items asked about, women are more likely than men to say differences between the two genders are mostly based on societal expectations. Men tend to point to biology as the reason. Gaps are particularly wide when it comes to differences in how men and women express their feelings, their approach to parenting, and the things they are good at in the workplace. On these items, there is at least a 10-point gap in the shares of women and men who point to societal expectations versus biologyas the basis for gender differences (among those who see differences). Differences by party Partisan gaps are even wider. On all items we asked about, majorities of Republicans point to biology as the main driver of differences between men and women (among those who say there are differences). In turn, on nearly every item, majorities of Democrats say differences between men and women are mostly based on the expectations society has for the two genders. The only exception is when it comes to differences in physical abilities. Most Democrats (79%) say this is mostly based on biological differences between men and women. Differences by gender within each party Across the five items in the survey, Republican men are more likely than Republican women to point to biology as the basis for differences between men and women. Still, on nearly every item, majorities of Republican women say these differences are mainly based on biology. When it comes to what drives differences in how men and women express their feelings, Republican women are about evenly divided: 51% point to biology and 48% point to societal expectations. Among Democrats, women are more likely than men to say societal expectations are the basis the differences between the two genders. Though for the most part, Democratic men are more likely to point to societal expectations than to biology as the reason for these differences. Are mothers or fathers better at handling certain parenting duties? While Americans largely say that men and women are different in their approach to parenting, they also tend to see them as equally capable when it comes to certain parenting duties. Shares ranging from 66% to 81% say that, generally, in families with a mother and a father raising children together, both parents would be equally good at: Teaching moral values Helping children with their schoolwork Playing or doing activities with children Disciplining children To the extent that people see a difference, more say the mother would do a better job helping children with schoolwork (20%) than say the father would be better at this (5%). In turn, more say the father would do a better job disciplining children (26%) than say this about the mother (8%). While there are some differences by gender and by party, majorities of men, women, Democrats and Republicans say mothers and fathers would be equally good at these aspects of parenting. The public’s views are more split when it comes to comforting children when they’re sad or upset and to managing the children’s schedules. On these, similar shares say the mother would be better as say both parents would be equally good. Parents of children younger than 18 and those who don’t have young children offer similar views on each of the aspects of parenting we asked about. Differences by gender within each party Differences in views by gender and by party on this question tend to be modest, but Republican men stand out on two items. Comforting children: 59% of Republican men say the mother would be better at this, compared with 50% of Republican women, 43% of Democratic women and 42% of Democratic men. Disciplining children: 43% of Republican men say the father would be better at this, compared with 24% of Republican women, 23% of and Democratic men and 16% of Democratic women. source

5. How Americans see differences between men and women Read More »