Pew Research Center

How Americans View Journalists in the Digital Age

Reporters interview House Majority Leader Steve Scalise, R-La., on his way to the House Chamber at the U.S. Capitol on July 2, 2025. (Kevin Dietsch/Getty Images) How we did this Pew Research Center has been studying how Americans get news and information for many years, and it has become clear that journalists’ place in society has been changing amid major political and technological shifts. So we asked everyday people for their views on this topic, including how they define a “journalist,” how they view journalists’ role in America, and what they want from their news providers more broadly (whether they are journalists or not). We used two different methods to explore Americans’ understandings of what it means to be a journalist in the digital age: Survey We surveyed 9,397 U.S. adults from April 14 to 20, 2025. Everyone who took part in this survey is a member of the Center’s American Trends Panel (ATP), a group of people recruited through national, random sampling of residential addresses who have agreed to take surveys regularly. This kind of recruitment gives nearly all U.S. adults a chance of selection. Interviews were conducted either online or by telephone with a live interviewer. The survey is weighted to be representative of the U.S. adult population by gender, race, ethnicity, partisan affiliation, education and other factors. Read more about the ATP’s methodology. Here are the questions used for this report, the topline and the survey methodology. Focus groups Pew Research Center worked with PSB Insights to conduct nine 90-minute online focus groups with a total of 45 U.S. adults from June 10 to 18, 2025. These discussions are not nationally representative, and the results are not framed in quantitative terms. This report includes findings and quotes from the focus groups to help illustrate and add nuance to the survey findings. Quotes were lightly edited for spelling, punctuation and clarity. To learn more, refer to the methodology. As Americans navigate an often-overwhelming stream of news online – some of it coming from nontraditional news providers – what it means to be a journalist has become increasingly open to interpretation. That is apparent in several ways in a new Pew Research Center study. Who Americans see as a “journalist” depends on both the individual news provider and the news consumer, similar to the variety of ways people define “news.” There is a lack of consensus – and perhaps some uncertainty – about whether someone who primarily compiles other people’s reporting or offers opinions on current events is a journalist, according to a new Center survey. Americans are also split over whether people who share news in “new media” spaces like newsletters, podcasts and social media are journalists. In some ways, Americans’ ideas about journalists are still tied to what the news industry looked like in the 20th century. When asked who comes to mind when they think of a journalist, many everyday Americans who participated in our focus groups said they think of traditional TV newscasters like Walter Cronkite and Tom Brokaw, modern anchors like Lester Holt and Anderson Cooper, and even fictional characters like Clark Kent. Most Americans say journalists are at least somewhat important to the well-being of society. At the same time, many are critical of journalists’ job performance and say they are declining in influence, an opinion that follows years of financial and technological turmoil in the news industry. And many views toward journalists continue to be sharply divided by political party, with Republicans taking a more skeptical view of the profession than Democrats. As part of our broader study of how Americans get news and information nowadays, we wanted to know what people think about the role of journalists in the digital age – including what makes someone a journalist, what Americans think is important for journalists to do in their daily work, and what backgrounds and attributes people are looking for in their news providers broadly (whether they are journalists or not). So earlier this year, we posed these questions in a survey of more than 9,000 Americans and in online focus groups with 45 U.S. adults. Americans want honesty, accuracy and topical knowledge from their news providers What do people want their news providers to be like, regardless of whether they are journalists? Honesty, intelligence and authenticity are the top three traits in our survey that respondents say are important for the people they get news from to display in their work. However, as our focus group discussions illustrate, people hold differing views of what the term “authenticity” means when it comes to news providers – and some aren’t entirely sure. Americans also care more that someone they get news from has deep knowledge of the topics they cover than whether they are employed by a news organization or have a university degree in journalism. Most Americans agree that the people they get news from should definitely report news accurately (84%) and correct false information from public figures (64%) in their daily work. But there is less consensus around several other job functions – and relatively few say their news providers should express personal opinions about current events. Refer to Chapter 1 for more details on what Americans want from their news providers. Who counts as a journalist? Most Americans (79%) agree that someone who writes for a newspaper or news website is a journalist – higher than the share who say the same about someone who reports on TV (65%), radio (59%) or any other medium. There is less consensus about whether people who work in newer media are journalists. Fewer than half of U.S. adults say someone who hosts a news podcast (46%), writes their own newsletter about news (40%) or posts about news on social media (26%) is a journalist. In each of these cases, roughly a quarter of Americans say they aren’t sure whether these people are journalists. This pattern aligns somewhat with how long each format has been around: Newspapers were associated with journalism for centuries

How Americans View Journalists in the Digital Age Read More »

U.S. Unauthorized Immigrant Population Reached a Record 14 Million in 2023

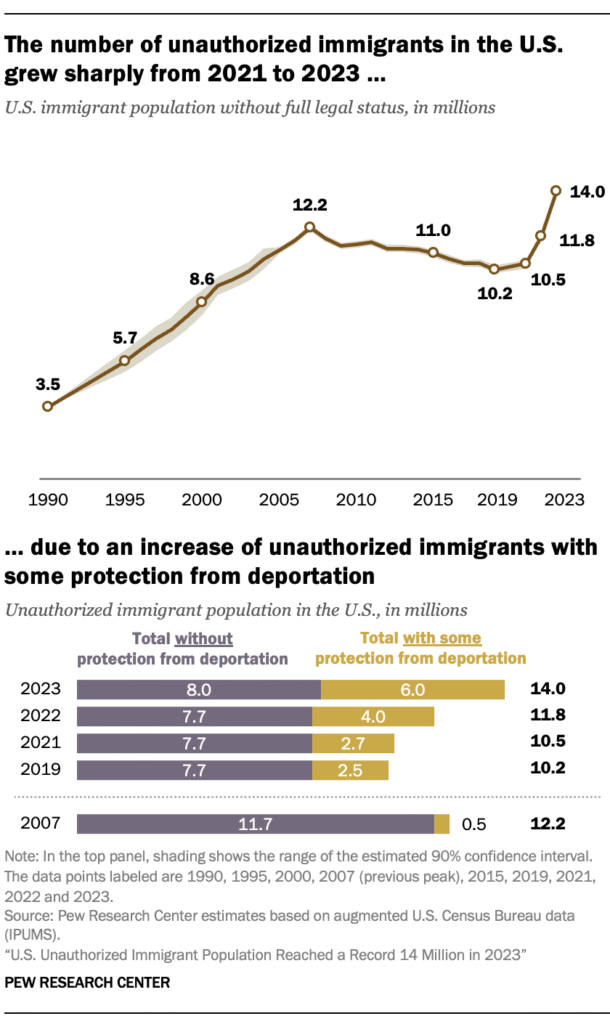
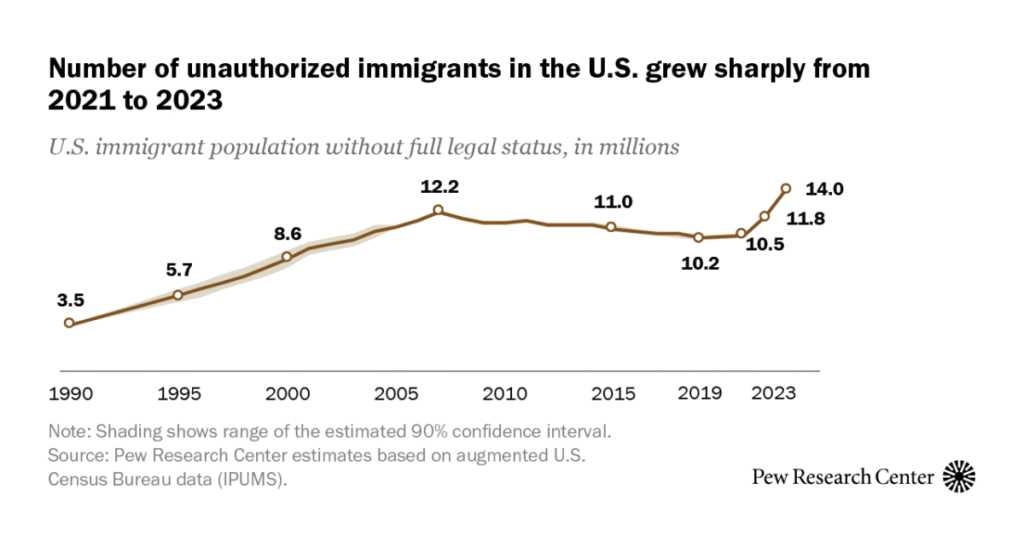
How we did this Pew Research Center conducted this research to understand changes in the unauthorized immigrant population in the United States. The Center has published estimates of the U.S. unauthorized immigrant population for more than two decades. This report presents estimates of the number of unauthorized immigrants in the U.S. as of July 2023, a revised estimate for 2022, and for previous years back to 1990. These estimates supersede all previously published Pew Research Center estimates. The Center uses a “residual method” to estimate the size the unauthorized immigrant population. The method is similar to those used by the U.S. Department of Homeland Security’s (DHS) Office of Homeland Security Statistics and nongovernmental organizations, including the Migration Policy Institute and the Center for Migration Studies of New York. Those organizations’ estimates are generally consistent with ours. Our estimates also align with official U.S. data sources, including birth records, school enrollment figures and tax data, as well as Mexican censuses and surveys. Our residual method includes these steps: Estimate the total number of immigrants living in the country in a particular year using data from U.S. censuses and government surveys such as the American Community Survey (ACS) and the Current Population Survey (CPS). Estimate the number of immigrants living in the U.S. legally using official counts of immigrant and refugee admissions together with other demographic data (for example, death and out-migration rates). Subtract our estimate of lawful immigrants from our estimate of the total immigrant population. This provides an initial estimate of the unauthorized immigrant population. Our final estimate of the U.S. unauthorized immigrant population, as well as estimates for lawful immigrants, includes an upward adjustment. We do this because censuses and surveys tend to miss some people. Undercounts for immigrants, especially unauthorized immigrants, tend to be higher than for other groups. More details on how we produced our estimates are in Methodology A: Unauthorized immigrant estimates. New Census Bureau population estimates, released in December 2024, greatly increased their measure of international migration for mid-2021 to mid-2023. We have incorporated the bureau’s revised immigration estimates into the ACS. Our new estimate of the unauthorized immigrant population for 2023 and the updated estimate for 2022 reflect this new information. More details about the survey data we used in our estimates are in Methodology B: Survey data on immigrants. The term “unauthorized immigrant” reflects many academic researchers’ and policy analysts’ standard and customary usage. The DHS Office of Homeland Security Statistics has also used it and similar terms. The term means the same thing as “undocumented immigrants,” “illegal immigrants” and “illegal aliens.” To learn who is and who is not included in the unauthorized immigrant population, read “Who are unauthorized immigrants?” later in this report. More information on concepts used in this report and how we round our population estimates is in Methodology C: Definitions and concepts. In the years after the COVID-19 pandemic, U.S. immigration policy changes fueled a sharp rise in both legal and illegal immigration. Lawful admissions jumped, as did encounters at the U.S.-Mexico border between migrants and U.S. authorities. The number of unauthorized immigrants in the United States reached an all-time high of 14 million in 2023 after two consecutive years of record growth, according to a new Pew Research Center estimate. The increase of 3.5 million in two years is the biggest on record. Data from 2023 is the most recent available for developing a comprehensive and detailed estimate. The label “unauthorized immigrants” captures a complex array of statuses, including immigrants who entered the U.S. legally. While the label is not perfect, it groups together immigrants living in the country with impermanent, precarious statuses. The term has been used for decades by researchers who develop estimates of the population and is generally used in this report. The increase from 2021 to 2023 was driven primarily by growth in the number of unauthorized immigrants who were living in the U.S. with some protections from deportation, such as immigrants paroled into the country and asylum seekers. About 6 million immigrants without full legal status had some protection from deportation in 2023, up from 2.7 million in 2021. In 2007, when the total unauthorized immigrant population was at its previous high (12.2 million), about 500,000 had some protection from deportation. The total number with temporary protections from deportations increased after 2021 following policy changes made by the Biden administration that allowed many immigrants to arrive in the U.S. with protected status and others to gain protection shortly after arriving. Unauthorized immigrants with some protection from deportation accounted for more than 40% of those without full legal status in 2023. These protections can be, and in some cases have been, removed by the federal government, sometimes with little notification. To understand which groups are considered unauthorized immigrants in this analysis, read “Who are unauthorized immigrants?” later in this report. In 2023, unauthorized immigrants accounted for 27% of all U.S. immigrants, up from 22% in 2021. The group’s share of the U.S. population increased from 3.1% to 4.1% during this time. Changes to the unauthorized immigrant population, 2024-25 Through early 2024, the overall unauthorized immigrant population continued to grow at a record pace, according to a Center review of preliminary and incomplete data sources. After mid-2024, policy decisions spanning the Biden and Trump administrations again changed this population. Growth slowed considerably in the last half of 2024 after the Biden administration stopped accepting asylum applications at the border and paused parole programs. In 2025, the unauthorized immigrant population has probably started to decline, due in part to increased deportations and reduced protections under the Trump administration. As of mid-2025, the unauthorized immigrant population likely remains above 2023 levels. Still, we won’t know the full impact of these policy shifts until more complete data becomes available. Learn more about how the unauthorized immigrant population may have changed in 2024-25, according to preliminary, incomplete data. Overview of this report This report explores the dynamics shaping the population of immigrants living in the U.S. without full lawful status.

U.S. Unauthorized Immigrant Population Reached a Record 14 Million in 2023 Read More »

3. Terrorism as a threat

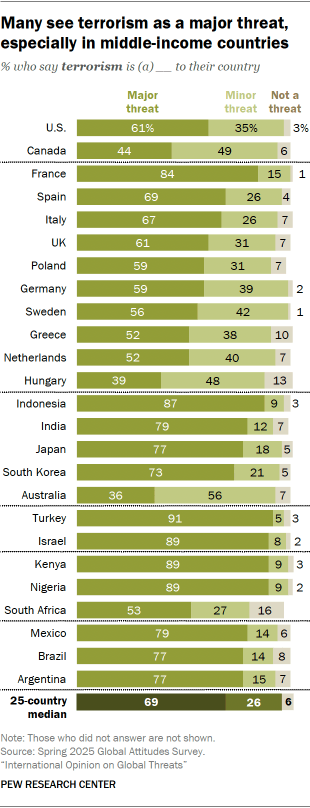
Across 25 nations, a median of 69% of adults say terrorism is a major threat. Another 26% say it is a minor threat, and 6% say it is not a threat to their country. People in middle-income countries are more likely than those in high-income countries to see terrorism as a major threat. A median of 79% across nine middle-income countries surveyed say terrorism is a major threat, compared with 60% across 16 high-income countries. (Read Appendix A for more information on how we classify high- and middle-income countries.) Concern about terrorism is highest among older adults and people on the ideological right, including supporters of right-leaning populist parties. And in some countries, people with less education are more likely to be concerned than those with more education. Many people view terrorism as a major threat to their nation, including large majorities in almost all of the middle-income countries surveyed. About nine-in-ten adults in Kenya, Indonesia, Nigeria and Turkey express this view, as do roughly eight-in-ten in Argentina, Brazil, India and Mexico. These views of terrorism are also common in some high-income countries such as France, Japan and South Korea: About three-quarters of adults or more in each of these nations call it a major threat. In Israel, 89% see terrorism as a major threat to their country.  Views over time In 12 high-income countries, we last asked people about their views of terrorism as a threat in 2020. The share of Americans who say terrorism is a major threat has declined 9 points since March 2020. Fewer Australians also see terrorism as a major threat to their country today than in June 2020 (-7 points). But in South Korea and Sweden, people are somewhat more likely to see terrorism as a major threat today than five years ago. Views by age In about half of the countries surveyed, older people are more likely than younger people to see terrorism as a major threat. For instance, three-quarters of Americans ages 50 and older say terrorism poses a major threat to their country, compared with 44% of U.S. adults under 35. Views by education In 10 mostly high-income countries, people with less education are more likely than those with more education to see terrorism as a major threat. For instance, 58% of Greeks without a postsecondary education hold this view, compared with 40% among those who have a postsecondary education. Views by ideology In 15 nations, people who place themselves on the ideological right are particularly concerned about the threat terrorism poses to their country. Almost half of right-leaning Australians (47%) say terrorism is a major threat. This is more than double the share of left-leaning Australians (20%) who take this stance. Similarly, in Canada, roughly half of those on the right (49%) and a similar share of those in the center (46%) see terrorism as a major threat, compared with about a quarter of those on the left (28%). Other large differences by ideology are found in the U.S., Israel and many of the European countries surveyed.  Views by support for right-wing populist parties Across Europe, supporters of right-wing populist parties are more likely than nonsupporters to see terrorism as a major threat to their country. (Read Appendix B for more information on how we classify populist parties.) For example, French adults with a favorable view of the right-wing National Rally party are more likely than those with an unfavorable view of the party to call terrorism a major threat. This is also the case among supporters and nonsupporters of Alternative for Germany (AfD), Fidesz in Hungary, Forza Italia and Brothers of Italy (FdI), Party for Freedom (PVV) in the Netherlands, Vox in Spain, Sweden Democrats, and Reform UK. Conversely, supporters of centrist and left-leaning populist parties in France, Italy and Spain are less likely than nonsupporters to be concerned about the threat posed by terrorism. The only exception is left-wing Syriza in Greece: People with a favorable view of that party are more likely than those with an unfavorable view to see terrorism as a major threat to their country. source

3. Terrorism as a threat Read More »

2. Global economic conditions as a threat

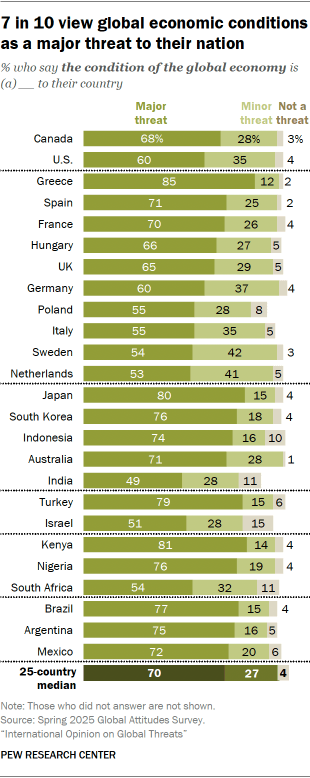
A median of 70% of adults across 25 countries say global economic conditions pose a major threat to their country, while 27% say they pose a minor threat. Only 4% say global economic conditions do not pose a threat. About half of adults or more in all countries surveyed say global economic conditions are a major threat. These shares range from 85% in Greece to 49% in India (where respondents are less likely to offer an opinion). Concern is higher in middle-income countries than high-income ones. A median of 75% across the nine middle-income countries surveyed say global economic conditions are a major threat, while a median of 65% say the same across 16 high-income countries. (Read Appendix A for more information on how we classify high- and middle-income countries.) Views over time Since we first asked this question in 2017, the share of adults who say global economic conditions are a major threat has gone up significantly in 21 countries. One of the largest changes is in Germany, where the share of adults who see this as a major threat has risen 38 points. There have also been increases of 30 points or more in Canada, Sweden, the Netherlands and Poland over this period. Views by opinion of national economic conditions In most countries, people with a negative view of national economic conditions are more likely to consider global economic conditions a major threat to their country. In the U.S., for example, seven-in-ten adults who say the domestic economic situation is bad also say the state of the global economy poses a major threat to their country. This compares with 42% among those who say the U.S. economy is in good shape. Related: Americans’ views of global threats differ by party, age Views by education and age Views on this question also differ by age and educational background. In 11 countries, respondents with more education tend to perceive global economic conditions as a greater threat. In Brazil, for instance, 86% of people with more education view global economic conditions as a major threat to their country, compared with 65% among Brazilians with less education. However, in many countries, people with less education are also less likely to answer the question. In eight countries, younger respondents (ages 18 to 34) are more likely than their older counterparts (ages 50 and older) to view global economic conditions as a major threat. In Hungary, for example, these younger adults are 25 points more likely than those in the older group to say global economic conditions are a major threat (83% vs. 58%). There are differences of 15 points or more in Brazil, Canada and Indonesia. (In Brazil, older adults were less likely to provide a response.) CORRECTION (Aug. 21, 2025): A previous version of this report included an incorrectly labeled chart. This has been updated, and none of the report’s findings are affected. source

2. Global economic conditions as a threat Read More »

Methodology A: Unauthorized immigrant estimates

This report presents estimates of the number of unauthorized immigrants in the United States as of July 2023 and for previous years back to 1990. These estimates supersede all previously published Pew Research Center estimates. Although this report draws largely on U.S. Census Bureau surveys, our estimates generally will not agree exactly with data published by the bureau because we include adjustments for survey omissions and corrections for various types of survey errors and anomalies. The methods used to produce the estimates of the unauthorized immigrant population and its characteristics are described below (Methodology A). Two other methodology sections describe other parts of the report’s methodology. The second (Methodology B) describes the principal data sources used to produce the estimates and modifications made to the underlying surveys. The third section (Methodology C) provides details on how the estimates are rounded and definitions of various concepts used in the report. Overview The estimates for the U.S. unauthorized immigrant population presented in this report are based on a residual estimation methodology that compares a demographic estimate of the number of immigrants residing legally in the country with the total number of immigrants as measured by either the American Community Survey (ACS) or the Annual Social and Economic Supplement (ASEC) to the March Current Population Survey (CPS). The difference is the estimated number of unauthorized immigrants in the survey, a figure that later is adjusted for omissions from the survey (read below). The basic estimate is calculated as: The lawful resident immigrant population is estimated by applying demographic methods to counts of lawful admissions covering the period since 1980 obtained from the Department of Homeland Security’s Office of Homeland Security Statistics and its predecessors, the DHS Office of Immigration Statistics and the Immigration and Naturalization Service, with projections to current years, when necessary. Initial estimates are calculated separately for age-gender groups in six states (California, Florida, Illinois, New Jersey, New York and Texas) and the balance of the country; within these areas, the estimates are further subdivided into immigrant populations from 35 countries or groups of countries by period of arrival in the United States. Variants of the residual method have been widely used and are generally accepted as the best current estimates (e.g., DHS, Migration Policy Institute, Center for Migration Studies of New York, and earlier work at the Center). The overall estimates for unauthorized immigrants build on these residuals by adjusting for survey omissions in these six states and the balance of the country, subdivided for Mexican immigrants and other groups of immigrants (remainder of Latin America, South and East Asia, and rest of world), depending on sample size and state. Once the residual estimates have been produced, individual foreign-born respondents in the survey are assigned a specific status (one option being unauthorized immigrant) based on the individual’s demographic, social, economic, geographic and family characteristics in numbers that agree with the initial residual estimates for the estimated lawful immigrant and unauthorized immigrant populations in the survey. These status assignments are the basis for most characteristics reported (including, for example, specific countries of birth, detailed state estimates, period of arrival and household-family relationships). A last step in the weighting-estimation process involves developing state-level estimates that account for trends over time in the estimates. Since the estimates are ultimately based on Census Bureau surveys, the unauthorized immigrant estimate and other population groups represent the number in the country as of the date of the survey. The reference date for the ACS is July 1 for the year of the survey; for the CPS-ASEC, it is March 1 for the survey year. Thus, our unauthorized immigrant population estimates for 2005-2023 represent the number in the country as of July 1 of each year. The 1995-2003 estimates are the number of unauthorized immigrants as of March 1. The 1990 estimates are for Census Day, or April 1, 1990. Lawful immigrant population The estimate of the lawful immigrant population (“L” in the estimation equation) is based on official counts of immigrant and refugee admissions. The principal source for the data is the Yearbook of Immigration Statistics published by DHS and its predecessor, the Immigration and Naturalization Service. The main groups of lawful immigrants arriving are: Lawful permanent residents (LPR or green card holders) New arrivals: This group is counted as arriving in the year they acquire their green card. Adjustments of status: These immigrants are already in the U.S. but have some status other than LPR. They are counted as lawful immigrants only as of the year they acquire their green card but their “year of arrival” is adjusted to an earlier date based on when they first arrived in the U.S. Some LPRs adjusting status have already been counted as lawful immigrants on arriving in the U.S. (e.g., refugees noted below), so they are not added when they adjust status to avoid double-counting them. Refugees: These immigrants, admitted from abroad because of humanitarian concerns in their home country, are counted as lawful immigrants in their year of admission. Virtually all refugees eventually become LPRs. When they “adjust status” to LPR, they are not counted again. Asylees: These immigrants, already in the U.S. when they are granted asylum for humanitarian concerns, are also counted as lawful immigrants in their year of admission. They are excluded from the LPR count when they adjust status. Former unauthorized immigrants granted legal residence under the 1986 Immigration Reform and Control Act: These immigrants were counted as lawful immigrants when their applications were approved, mainly in the late 1980s. They are overwhelmingly Mexican, and most entered the U.S. before 1980. They are not counted when they adjust status to LPR, but virtually all of them became LPRs before 2000. Published tables for the DHS Yearbook of Immigration Statistics and some related sources provide the basic data for these groups. The data for arrivals is subdivided by country or region of birth, year or period of arrival, age, sex and state of residence. For each year, the previous year’s population estimate is updated with

Methodology A: Unauthorized immigrant estimates Read More »

Methodology B: Survey data on immigrants

This report presents estimates of the number of unauthorized immigrants in the United States as of July 2023 and for earlier years. As noted earlier in this report, the estimates presented here supersede all previously published Pew Research Center estimates. The principal survey data used to produce the estimates and modifications made to the underlying surveys is described below (Methodology B). Two other methodology sections describe the other parts of the report’s methodology. The first (Methodology A) describes the methods used to produce the estimates of the U.S. unauthorized immigrant population and its characteristics. The third section (Methodology C) provides details on how the estimates are rounded and the definitions of various concepts used in the report. Overview Estimates of the size and characteristics of the unauthorized immigrant population rely on official U.S. Census Bureau surveys – the American Community Survey (ACS) and the Current Population Survey (CPS). These surveys provide information on the total foreign-born population and detailed characteristics of immigrants. They, in turn, rely on official Census Bureau population estimates for survey weights and population numbers. This methodology chapter describes the role of the population estimates and how we have incorporated the bureau’s normal revisions to these estimates into our estimates of the unauthorized immigrant population. The estimates of the unauthorized immigrant population for 2005-2019 and 2021-2023 use the ACS, while those for 1995-2003 use the Annual Social and Economic Supplement (ASEC) to the March CPS. The estimates for 1990, which cover only state totals and selected countries of birth, use the 1990 decennial census. The estimates for the unauthorized immigrant population that we produce from these surveys are comparable across all years. This allows for tracking trends over time in the size and characteristics of the unauthorized immigrant population. However, to achieve this consistency, we made modifications to some of the surveys. Each year’s surveys, as released by the Census Bureau, agree with population figures they develop for that year. But these population estimates may not be consistent with previous years because of changes in the bureau’s methods for estimating population and because of breaks in the population series that occur when the results of a new decennial census are introduced into the population estimates. This section of the report highlights the causes of specific discontinuities in the Census Bureau’s population estimates which lead to inconsistencies in the population figures from the surveys. It also describes the methods we have used at Pew Research Center to make modifications that allow for comparisons across years. The modifications bring the underlying bureau surveys in line with actual population changes over the more than three decades covered by our estimates of unauthorized immigrants. We focus in some detail on revisions to the 2022 and 2023 population estimates that affect recent ACS data. (More details regarding the survey designs and sample sizes of the ACS and CPS are described below.) Official population estimates and surveys The Census Bureau regularly issues new estimates of the U.S. population as of July 1. Initial estimates for the nation and states are released in December of every non-decennial census year. The annual estimates are referred to by their “vintage,” or the year they are released. For example, the population estimates for July 1, 2024, are released in December 2024 and are called the Vintage 2024 population estimates. Each annual release also updates the previous vintage and includes population estimates for July 1 of every year since the most recent decennial census. During the ensuing year, the bureau releases additional estimates with more demographic detail (age, sex, race/Hispanic origin) and more geographic detail (counties, cities, places). These estimates are also referred to as “postcensal” population estimates because they update the population from the last decennial census. The postcensal estimates are used to weight the Census Bureau’s surveys. Each year’s ACS is consistent with the official population estimates released in the year of the survey. For example, the 2023 ACS is consistent with the Census Bureau’s Vintage 2023 population estimates released in December 2023. That is, the weights in the survey produce population figures from the survey that agree with the Vintage 2023 populations for states and smaller areas subdivided by age, sex, race and Hispanic origin. Similarly, each year’s March CPS ASEC is weighted to the most recent Census Bureau population estimates, but in this case the weights are from the previous year’s vintage. So, for example, the weights for the March CPS ASEC for 2003 are based on the Census Bureau’s Vintage 2002 population estimates for states and age, sex, race and Hispanic origin groups. When the Census Bureau updates their postcensal population estimates for the years since the previous decennial census, they almost never update the weights for previous surveys. In most years, the revisions to the time series of population data are fairly small, so any potential updates to the previous surveys would be negligible. However, when revisions to population estimates are large – as they were for Vintage 2024 – the impact on recent surveys can also be big. This was the case for the Vintage 2024 population estimates and the 2022 and 2023 ACS. Large revisions can result in major discontinuities and inconsistencies in estimates of the unauthorized immigrant population that are based on these surveys. After each decennial census, the bureau assesses the quality of population estimates for the previous decade based on how closely the estimates series matched the census count. The bureau then issues a set of population estimates for the previous decade that are consistent with both the previous decennial census and the new one. These are called “intercensal” population estimates because they align with two censuses. The intercensal population estimates can sometimes result in very large discrepancies from the previous postcensal estimates. However, regardless of the magnitude of any disagreement between postcensal and intercensal population estimates, the Census Bureau has generally not updated its surveys and their weights to be consistent with the new intercensal population estimates. To address these inconsistencies, Pew Research Center has developed updated survey weights that

Methodology B: Survey data on immigrants Read More »

International Opinion on Global Threats

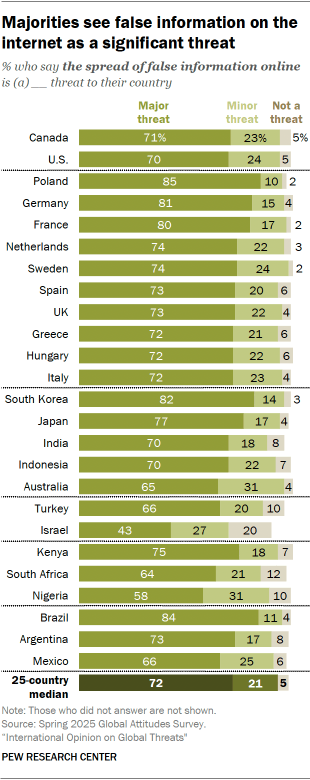
From left: A container ship docks in Shenzhen, China, on April 11, 2025 (Cheng Xin/Getty Images); relatives of victims of the 2002 Bali bombings pray in front a memorial on on Oct. 12, 2024, the 22nd anniversary of the attacks (Johanes P. Christo/NurPhoto via Getty Images); a passenger uses a laptop on an intercity train in Miami, Florida (Jeffrey Greenberg/UCG/Universal Images Group via Getty Images) How we did this This Pew Research Center analysis focuses on public perceptions of global threats in 25 countries across the Asia-Pacific region, Europe, Latin America, the Middle East-North Africa region, North America and sub-Saharan Africa. Views of global threats are examined in the context of long-term trend data. For non-U.S. data, this analysis draws on nationally representative surveys of 28,333 adults conducted from Jan. 8 to April 26, 2025. All surveys were conducted over the phone with adults in Canada, France, Germany, Greece, Hungary, Italy, Japan, the Netherlands, Poland, South Korea, Spain, Sweden and the United Kingdom. Surveys were conducted face-to-face in Argentina, Brazil, India, Indonesia, Israel, Kenya, Mexico, Nigeria, South Africa and Turkey. In Australia, we used a mixed-mode probability-based online panel. In the United States, we surveyed 3,605 U.S. adults from March 24 to 30, 2025. Everyone who took part in this survey is a member of the Center’s American Trends Panel (ATP), a group of people recruited through national, random sampling of residential addresses who have agreed to take surveys regularly. This kind of recruitment gives nearly all U.S. adults a chance of selection. Surveys were conducted either online or by telephone with a live interviewer. The survey is weighted to be representative of the U.S. adult population by gender, race, ethnicity, partisan affiliation, education and other categories. Read more about the ATP’s methodology. Here are the questions used for this analysis, along with responses, and the survey methodology. In a world facing a range of difficult issues, adults across 25 countries see the spread of false information online, the condition of the global economy and terrorism as major threats today. And while many people remain concerned about climate change and the spread of infectious diseases, fewer view these as major threats now than did in recent years. These findings come from the latest Pew Research Center analysis of perceived global threats, which follows similar studies conducted in 2013, 2016, 2017, 2018, 2020 and 2022. Overall, a median of 72% of adults across 25 nations surveyed in spring 2025 say that the spread of false information online is a major threat to their country. A further 21% say it is a minor threat, while 5% say it is not a threat at all. In seven countries – Germany, the Netherlands, Poland, Sweden, the United Kingdom, the United States and South Korea – more people view the spread of false information as a threat than any other issue asked about. Germans and Poles, who voted in competitive national elections within the last year, see this as the top threat by a considerable margin. Related: Widespread global public concern about made-up news A median of 70% of adults across the countries surveyed view the condition of the global economy as a major threat. Another 27% say it’s a minor threat, and 4% say it is not a threat. People in two countries – Greece and Australia – view the global economy as the top threat of those included in the survey. Meanwhile, the share of adults who see global economic conditions as a major threat has increased in 21 countries since 2017. Concerns about the world economy are generally tied to views of national economic conditions. In 23 countries, people with a more negative view of their nation’s economy are more likely to say that the condition of the global economy is a major threat. What is a median? In this analysis, median scores are used to help readers see overall patterns in the data. The median percentage is the middle number in a list of all percentages sorted from highest to lowest. A 25-country median of 69% of adults view terrorism as a major threat, while 26% characterize it as a minor threat and 6% say it is no threat at all. People in four countries – India, Israel, Nigeria and Turkey – see terrorism as the top threat of the five issues asked about. In Israel, concerns about terrorism especially outweigh concerns about the other issues. And Jewish Israelis are far more likely than Arab Israelis to see terrorism as a major threat to their country (96% vs. 61%). The survey was fielded about a year and a half after Hamas’ Oct. 7, 2023, attack on Israel. People in middle-income countries are generally more likely than those in high-income countries to see terrorism as a major threat (79% median vs. 60% median). Concerns about terrorism also tend to be higher among older adults, people with less education and those on the ideological right, including supporters of right-leaning populist parties. (Read Appendix A for more information on how we classify high- and middle-income countries, and read Appendix B for more information on how we classify populist parties.) A median of 67% of adults across the nations surveyed see global climate change as a major threat. Another 24% say it is a minor threat, and 9% say it is no threat. In no survey country is climate change the single greatest perceived threat. On balance, however, concerns about climate change are higher than in 2013, both in advanced economies and middle-income countries. The share of people who view it as a major threat has increased sizably in France (+24 percentage points since 2013), Turkey (+23), Mexico (+22), the UK (+18), Kenya (+15), Nigeria (+13), Israel (+12), Australia (+11), the U.S. (+11), Germany (+11) and Poland (+10).  As in previous years, people on the ideological left are more concerned than those on the right about climate change. Meanwhile, just a few years after the COVID-19 pandemic, a median of 60% adults across the

International Opinion on Global Threats Read More »

1. False information online as a threat

A median of 72% of adults across 25 nations say the spread of false information online is a major threat to their country. A median of 21% consider it a minor threat, and a median of 5% say it is not a threat. Concern about false information on the internet is widespread in both high- and middle-income countries, and has remained relatively stable over time. (Read Appendix A for more information on how we classify high- and middle-income countries.) Older people and those on the ideological left are particularly likely to see false information online as a major threat. Majorities in 24 of the 25 countries surveyed see the spread of false information online as a major threat. Only in Israel do fewer than half of adults (43%) hold this view. An additional 27% of Israelis say false information is a minor threat, and 20% do not consider it a threat to their country. Related: Widespread global public concern about made-up news Views over time We last asked about the threat posed by false information online in 2022. Since then, public perceptions in most places have not moved much. Of the 16 countries where this trend data is available, we see significant changes in six. The share of adults who say false information is a major threat has grown in Poland (+20 points), Sweden (+10), Hungary (+9), France (+6) and Germany (+6). (In 2022, the Hungary and Poland surveys were conducted face-to-face; they are now conducted over the phone.) In Greece, the share with this view has shrunk 7 points, from 79% in 2022 to 72% today. Views by age In several countries, adults ages 50 and older are more likely than those ages 18 to 34 to see the spread of false information online as a major threat. This is the case in Argentina, Australia, Canada, Japan, Kenya, Poland, Sweden and the U.S. But in Brazil and Turkey, the opposite is true: Older adults are less likely than younger adults to consider false information a major threat. In both countries, however, older adults are also slightly less likely to answer the question. Views by ideology In most countries, majorities across all ideological groups consider the spread of false information online a major threat. But in nine countries, people who place themselves on the ideological left are more likely than those on the right to say this. Some of the biggest differences are in Germany and the U.S. For example, 82% of liberal Americans say the spread of false information on the internet is a major threat, compared with 60% of conservatives. Here, too, Israel is an exception. It is the only country surveyed where people on the left are less likely than those on the right to see the spread of false information online as a major threat. Views by support for populist parties In several European countries, concern about the spread of false information online is considerably lower among supporters of right-wing populist parties than among nonsupporters. (Read Appendix B for more information on how we classify populist parties.) For example, 55% of Germans with a favorable view of Alternative for Germany (AfD) say the spread of false information is a major threat, compared with 89% of those who have an unfavorable view of AfD. We find similar gaps between supporters and nonsupporters of right-wing populist parties in Hungary, the Netherlands, Poland, Sweden and the UK. But Spanish supporters of Podemos – which is classified as a left-leaning populist party – are more concerned than nonsupporters about the threat of false information online (83% vs. 71%). source

1. False information online as a threat Read More »

1. What do Americans want from their news providers?

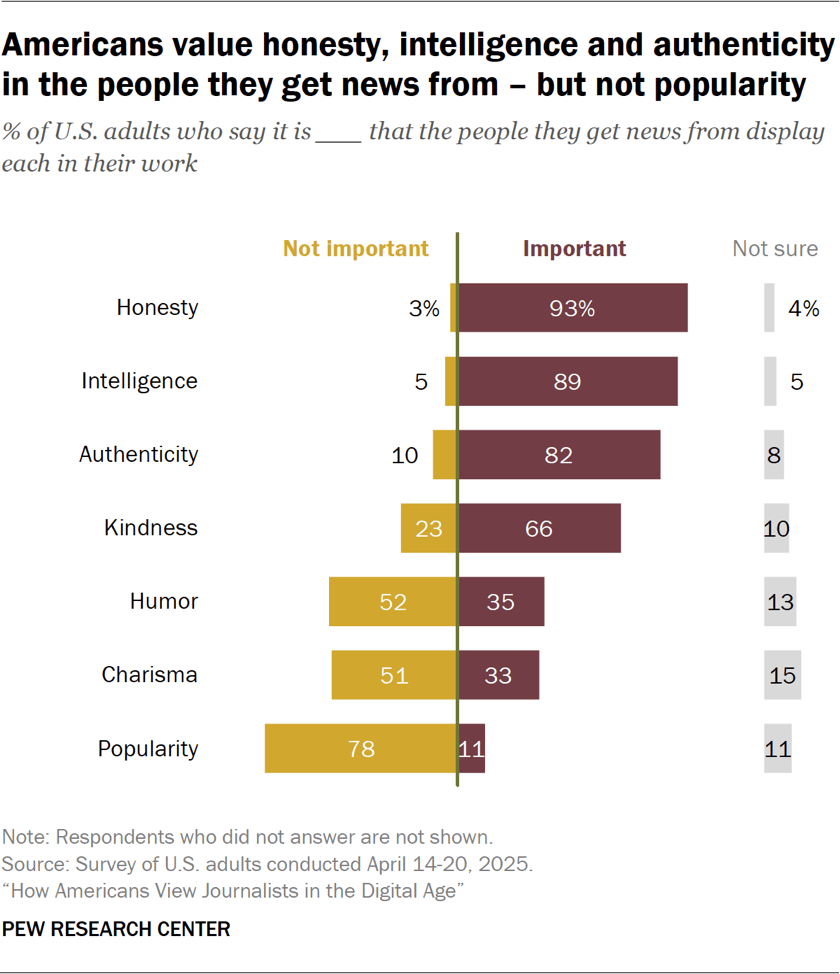
This is the first of four detailed sections in a report on Americans’ views about the role of journalists in the digital age. The report also includes an overview of the key findings. This report explores several facets of how the public thinks about “journalists” today: what makes someone a journalist, what their role is in society and how they are expected to act. But as our focus groups with everyday Americans reveal, and as other Pew Research studies have shown, people get news from a wide range of sources online – some of whom they consider journalists, and others they don’t. This section looks at what people want from the “people they get news from” more broadly, without explicitly using the journalist label. What traits do Americans value in their news providers? Large majorities of Americans in our survey say it’s important for the people they get news from to display honesty (93%), intelligence (89%) and authenticity, or “being their true selves” (82%), in their work. About two-thirds of U.S. adults (66%) also say it’s important that the people they get news from display kindness. Far smaller shares say humor (35%), charisma (33%) and popularity (11%) are important in the work of their news providers. In our focus groups, several participants discussed the role of charisma in news providers’ work, especially when it comes to the style of presentation and how a story is delivered. For instance, one man in his 30s said, “I guess you’d say the cadence, the charisma, the voices …. Is it calm? Is it inviting? Or is the person’s voice an absolute ratchet you just want to turn off?” Some groups are more likely to value certain traits in their news providers’ work: Younger Americans find it more important than their older peers for the people they get news from to display charisma in their work (38% of adults under 50 vs. 28% of those 50 and older). Hispanic (44%) and Black (38%) Americans also are more likely than White (30%) and Asian (28%) adults to see this as important. Women (73%) are more likely than men (58%) to say kindness is important for their news providers to display in their work. The value of ‘authenticity’ from news providers It’s clear that most Americans value authenticity in their news providers. But what exactly is authenticity? We posed this question to our focus group participants. While many participants said they do value authenticity in their news providers, they hold differing views of (or aren’t entirely sure) what the term means. Authenticity is perceived by some people as integrity and accountability, reflecting “that the person is who they say they are.” By others, it’s “truthfulness”: As one man in his 40s put it, “minimum Pinocchios.” Several participants see authenticity as the inclusion of “a human touch” and the sharing of personal experience – bringing “your original personal touch to what you’re reporting.” “I think it’s presenting the humanity behind the news,” one man in his 30s said. One woman in her 50s explained it as a “window” into the journalist’s personal experience with a news story: “You have this window, and you can see how the information is coming to them as well as how it’s even affecting them emotionally.” Participants also discussed differing perceptions of authenticity between journalists and other news providers. Some mentioned caring more about whether they feel an influencer is authentic than whether a journalist is, because they only need or expect the facts from journalists. Others said they think nontraditional news providers have more freedom in general to show their authentic selves than journalists do. “Podcasts, I think they may be more authentic because they have more freedoms, where if someone’s on a national network or corporately produced newscast, they’re more controlled and could not be as authentic,” one woman in her 50s said. What roles do Americans expect their news providers to fulfill? The survey also asked U.S. adults whether they think the people they get news from should perform a variety of functions or responsibilities in their daily work. Most Americans agree that the people they get news from should definitely report the news accurately (84%) and correct false or misleading information from public figures (64%) in their daily work. And about half (51%) say their news providers definitely should give people the information they need to make decisions. Smaller shares say the people they get news from definitely should keep an eye on powerful people (41%), give a voice to people often underrepresented in the news (34%) or advocate for the communities they cover (32%). Americans are least likely to say the people they get news from definitely should seek out audience input (19%) or express personal opinions about current events (8%). In fact, about half of Americans say their news providers probably (27%) or definitely (22%) should not express personal opinions about the news. Many participants in our focus groups, regardless of party affiliation or age, expressed the view that personal opinion should beseparate from the facts of the news. As one man in his 20s said, “I just want to know the news, not how people feel. If I want to hear how people feel, I’ll go on Facebook comments or something and see everybody argue or whatever.” Like when we asked about journalists advocating for communities, several participants said that journalists expressing personal views or opinions is acceptable as long as they are explicitly distinct from – and follow – the facts. One man in his 60s said, “If somebody passes off their opinion as news, they’re going to lose a lot of credibility with me.” “I think it’s OK for journalists to show emotion and to show … their own perspective if they have reported the facts,” a woman in her 50s said. “That brings a human touch to it.” In other cases, participants candidly admitted they are more accepting of opinions they agree with. When asked when, if ever, it’s acceptable for

1. What do Americans want from their news providers? Read More »

4. Global climate change as a threat

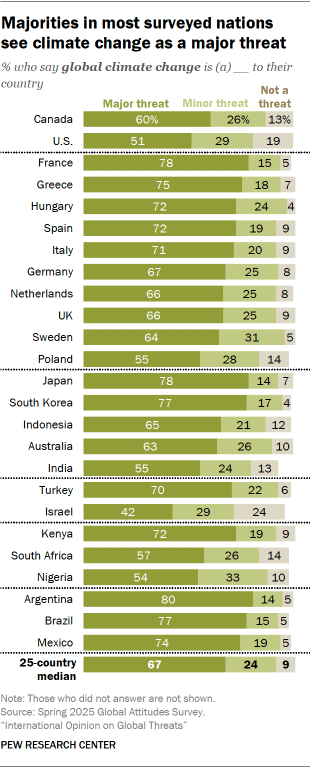
A median of 67% of adults across 25 nations say global climate change is a major threat to their country. Another 24% say it is a minor threat, and 9% say it is not a threat. In many of the high-income countries we surveyed in both 2022 and 2025, the share of adults who see climate change as a major threat has decreased significantly. Majorities in all but three countries – Israel, Nigeria and the U.S. – see climate change as a major threat. Around eight-in-ten hold this view in Argentina, Brazil, France, Japan and South Korea. About a quarter of Israelis (24%) say climate change is not a threat – the largest share to take this stance across the countries surveyed. In the U.S., about a fifth of adults (19%) say the same. Views over time The share of adults who say climate change is a major threat has increased in many places since 2013, when we first asked this question internationally. In Turkey, for example, 47% of adults thought of climate change as a major threat in 2013. This year, 70% of Turks express this view. However, since 2022, the share of people who view climate change as a major threat has decreased in many of the 16 high-income countries surveyed. This is especially the case in Greece, Italy and the Netherlands, where people are 11 points less likely today than in 2022 to see climate change as a major threat. (Read Appendix A for more information on how we classify high- and middle-income countries.) Views by ideology In 15 surveyed countries, people who place themselves on the ideological left are much more likely than those on the right to view climate change as a major threat. The largest difference is in the U.S., where liberals are more than four times as likely as conservatives to say this (84% vs. 20%). People on the right have become less likely since 2022 to call climate change a major threat in several countries. In Poland, for example, 40% of those on the right say this today, down from 63% three years ago. Views by support for right-wing populist parties Europeans who support right-wing populist parties tend to be much less likely than nonsupporters to say climate change is a major threat. This is the case across all right-wing populist parties we analyzed. (Read Appendix B for more information on how we classify populist parties.) For example, a quarter of Germans with a favorable view of Alternative for Germany (AfD) say climate change is a major threat, compared with 78% of those who have an unfavorable view of AfD. Views by age In several countries – including Australia, France, Turkey and the U.S. – adults under 35 are more likely than those ages 50 and older to see climate change as a major threat. But the reverse is true in Argentina, Japan, South Korea and Sweden. source

4. Global climate change as a threat Read More »