Pew Research Center

3. Views of China in middle-income countries

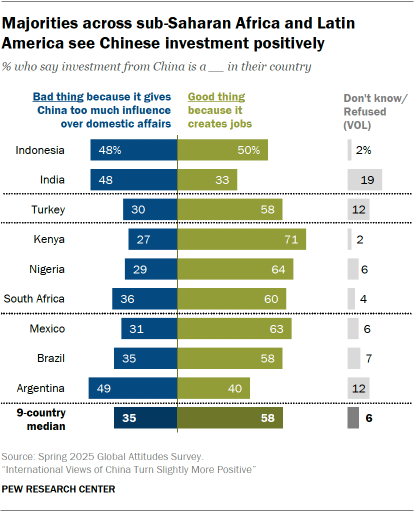
In nine middle-income countries, we asked additional questions about relations with China and the U.S.  People in most of the middle-income countries surveyed say investment from China is more of a good thing than a bad thing for their nation. In four countries, people are more likely to describe investment from China as a good thing than to say the same about investment from the U.S. In India, the reverse is true. Out of five specific issues we asked about, people are most likely to describe the debt their country owes to China as a very serious problem. Other problems – including economic competition with China – tend to be seen as less serious for their nation. In most countries and across most issues, people are more likely to describe problems with the U.S. as very serious than to say the same about problems with China, or otherwise view problems with the U.S. and China in a similar light. Views of investment from China Across the nine middle-income nations surveyed, a median of 58% say investment from China is a good thing because it creates jobs in their country. In comparison, a median of 35% say such investment is a bad thing because it gives China too much influence over their domestic affairs. Kenyans are the most positive about investment from China: 71% see it as good for their country. Around six-in-ten adults or more agree in five other countries. Conversely, people in Argentina and India are more likely to describe investment from China as bad than good. Opinions in Indonesia are roughly divided. Views over time Evaluations of investment from China have changed in some countries since the question was last asked in 2019. For example, people in Turkey have become 20 points more likely to say investment from China is good for their country. Views have also turned more positive in Indonesia, Kenya and India. Nigeria stands out as the only country that has soured on investment from China. The share of Nigerians who call it a good thing has declined 18 points since 2019. Comparing views of investment from China and the U.S. People see investment from China more favorably than investment from the U.S. in four of the nine countries where we asked these questions. For instance, Turks are 19 points more likely to say investment from China is good for their country than to say the same about investment from the U.S. Chinese investment also gets higher ratings in Mexico, Indonesia and South Africa. The opposite is true in India, where 33% say investment from China is a good thing, compared with 59% who say the same about investment from the U.S. In four countries, investment from both countries is seen in a similar light. Related: How people in 9 middle-income countries see relations with the U.S., China Views of bilateral issues with China In the middle-income countries surveyed, we also asked about five potential problems that might exist in their relations with China. People were asked whether each issue is very serious, somewhat serious, not too serious or not at all serious.  Overall, around half of adults or more tend to say each issue is at least somewhat serious. But far fewer describe each as very serious. (The latter responses are what we analyze here, consistent with our 2022 study based on a similar survey question that was asked in high-income countries.)  In five countries, people are most likely to describe the amount of debt their country owes to China as a very serious issue. These include Kenya, Indonesia, Nigeria and Brazil, where six-in-ten adults or more say debt to China is a very serious problem. Overall, a median of 50% across all nine middle-income countries consider debt to China a very serious problem. Aside from debt, no problem is seen as very serious by a majority in any country. In general, only around a third of adults or fewer see each of the other problems as very serious.  A median of 35% consider China’s military power to be a very serious problem for their country. The shares describing China’s military power as a very serious issue range from 50% in Brazil to 22% in Mexico.  A similar median of 34% consider China’s involvement in their country’s politics to be a very serious problem. This view is most widely held in Indonesia (45%) and Brazil (44%).  Conversely, people in Mexico (17%) and Turkey (18%) are the least likely to say China’s involvement in their politics is a very serious problem. A 32% median consider economic competition with China to be a very serious problem. Again, these views are particularly common in Indonesia (49%) and Brazil (46%).  China’s human rights policies tend to be one of the issues of least concern in the middle-income countries surveyed, with a median of 28% saying they are a very serious problem. In Brazil, 39% describe China’s human rights policies as a very serious problem, but elsewhere, around a third of adults or fewer take this stance. People in India were additionally asked about China’s territorial disputes with India, which 46% say are a very serious problem. This issue and China’s military power concern Indians the most, labeled very serious problems by around four-in-ten or more. Their views of these territorial disputes are largely unchanged since we first asked this question in 2016: At that time, 45% called them a very serious problem. (Trend data for other countries is not available.) Comparing concerns about China and the U.S. We asked these same questions about the U.S., too, and can compare what problems people see in their country’s relationship with each superpower.  In most countries and across most issues, people are more likely to describe problems with the U.S. as very serious than to say the same about problems with China – or otherwise view them in a similar light. For example, more adults in Mexico, South Africa and Turkey say U.S. human rights policies are a very serious problem for their country than say the same about Chinese human rights policies. In Mexico, this gap is particularly sizable at 20 points. 

3. Views of China in middle-income countries Read More »
4. Where China is seen as an ally or threat

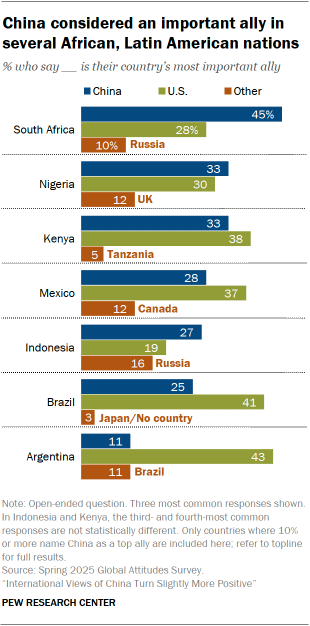
We asked respondents in 25 nations to name the country they see as the most important ally to their own and, separately, which country poses the greatest threat. Both questions were open-ended, so respondents were able to name anything that came to mind. In many countries, China ranks among the top allies and top threats.  In every country surveyed in sub-Saharan Africa and Latin America, China is one of the top three most-mentioned allies. In some middle-income nations, China is more likely to be seen as an ally now than it was in 2019, when we asked a similar question. China particularly stands out as a top threat in the Asia-Pacific countries surveyed. Still, it’s among the top three threats named in most places surveyed. In general, people who think China poses the greatest threat to their nation tend to see it as both an economic and security threat.  China as an ally China ranks among the top three most-mentioned allies in eight countries, including all of those surveyed in sub-Saharan Africa and Latin America.  In Indonesia and South Africa, China is named more than any other country.  In Kenya and Nigeria, similar shares name China and the U.S. In Brazil and Mexico, about a quarter of adults name China as their top ally (second to the U.S.). Fewer Argentines see China as an important ally, though it is still the second most-mentioned country (tied with Brazil).  Views over time We asked a similar question in 2019: “Which country can your country most rely on as a dependable ally in the future?”  While the 2019 question is a bit different than this year’s version, the balance of opinion has shifted markedly in some countries. For instance, South Africans today are significantly more likely to name China than the U.S. as their country’s most important ally. (45% vs. 28%). But in 2019, the U.S. was the most common response, followed by China.  The trend in Indonesia is similar. In 2019, Indonesians were more than twice as likely to name the U.S. than China as their country’s top ally (16% vs. 6%). But today, more name China than the U.S. China as a threat When asked which country poses the greatest threat to their own, relatively large shares in several countries name China.  This is especially the case in the Asia-Pacific region: About half of adults in Japan and Australia say China poses the greatest threat to their country, making it by far the most common response. In South Korea and India, one-third call China their top threat, second to North Korea and Pakistan, respectively. And roughly two-in-ten Indonesians say China is their greatest threat, second to the U.S.  In each of the Latin American countries surveyed, China ranks in the top three threats, though never as the top threat. China is the second-most commonly named threat in Brazil (15%) and Argentina (13%), after the U.S. In Mexico, a notable 68% majority say the U.S. poses the greatest threat to their country, compared with 5% who say it’s China.  China is the third-most commonly mentioned threat, behind Russia and the U.S., in several high-income European countries surveyed. In the U.S. and Canada, it ranks first and second, respectively.  For more on perceived threats across regions, read “People in Many Countries Consider the U.S. an Important Ally; Others See It as a Top Threat.” Views over time We asked a similar question in 2019: “What country or group poses the greatest threat to your country in the future?” In some countries, how China ranks relative to the U.S. has shifted. For example: In Indonesia, more called China a threat than the U.S. in 2019. Today, the opposite is true. In South Africa, roughly equal shares in 2019 described China and the U.S. as threats. Now, the U.S. is far and away the most commonly named threat. In Canada, more named China than the U.S. in 2019, while the opposite is true – and by a sizable margin.  In the U.S., where we asked the same question in both 2023 and 2025, views of China as a threat have tempered slightly, though in both years it was named more than any other country. This decline is particularly steep among Democrats and Democrat-leaning independents (-12 points). In fact, Democrats are now more likely to name Russia as the greatest threat to the U.S., rather than China. Related: Negative Views of China Have Softened Slightly Among Americans China as an economic and security threat We asked those who name China as their country’s greatest threat to rate how much of an economic threat China poses to their own and, separately, how much of a security threat it poses. In most countries where China is a common enough response for us to analyze, it’s seen as both an economic and security threat.  For example, 64% of Americans who say China is their country’s greatest threat say it poses a great deal of economic threat, while 61% say it’s a threat to national security. Views are similar in Argentina, Australia, Brazil, Canada, India, Indonesia, Kenya, South Africa, South Korea and the UK.  In Italy and Nigeria, China is perceived as more of an economic threat than a threat to national security. For instance, 43% of Nigerians who see China as the top threat think it poses a major threat to their country’s economy; just 19% say it poses a major threat to national security.  Japan is the lone country where there is greater concern about China as a security threat an economic one (54% vs. 41%, among those who name China as their top threat).  source

4. Where China is seen as an ally or threat Read More »

Appendix B: How people in middle-income countries see bilateral issues with the U.S. and China (detailed tables)

ABOUT PEW RESEARCH CENTER Pew Research Center is a nonpartisan, nonadvocacy fact tank that informs the public about the issues, attitudes and trends shaping the world. It does not take policy positions. The Center conducts public opinion polling, demographic research, computational social science research and other data-driven research. Pew Research Center is a subsidiary of The Pew Charitable Trusts, its primary funder. source

Appendix B: How people in middle-income countries see bilateral issues with the U.S. and China (detailed tables) Read More »

2. China’s economic power and economic relations

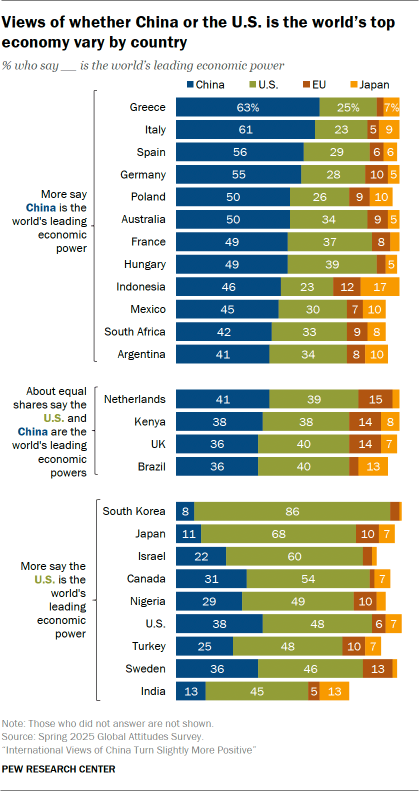
We asked people in 25 nations whether they think the U.S., China, Japan or the European Union is the world’s leading economic power. We also asked with which country – the U.S. or China – they see as a more important economic partner to their own nation. In most countries, people either view China as the world’s top economy or their opinions are split between China and the U.S. In 10 countries, the share of people who view China as the top economy has increased significantly since 2023. In most places surveyed, people prioritize close economic ties with the U.S. over China, though the share who prioritize China has increased in most countries while the share who prioritize economic ties with the U.S. has shrunk as of recently. People on the ideological left are more likely than those on the right to prioritize a close economic relationship with China. Which country is the world’s top economy? China is viewed as the top economy in 12 countries spanning regions and income levels. This is the most common view in most European countries surveyed, held by majorities in Germany, Greece, Italy and Spain, and by roughly half of adults in France, Hungary and Poland. By comparison, the U.S. is seen as the top economy in nine countries –including the U.S. itself, where 48% of adults hold this view. Majorities in Israel, Japan and South Korea agree. Opinion is split in Brazil, Kenya, the Netherlands and the UK, where similar shares call China and the U.S. the top economy.  Relatively few in any country surveyed point to Japan or the EU as the world’s top economic power. Views over time The balance of opinion on which country is the world’s leading economic power has shifted toward China in recent years. In 10 countries, the share of people who say China is the world’s top economy has increased since 2023. In India and Turkey, where we last asked this question in 2019, the share of adults who see China as the top economy has also increased slightly. In eight countries, the share of people who see the U.S. as the world’s top economic power has decreased since 2023. In India, it has decreased since the last time we asked in 2019. Canada is a notable exception. Today, Canadians are 10 points more likely than in 2023 to call the U.S. the leading economic power – and 9 points less likely to name China. When comparing the share of people in each country who name China as the top economy and the share who name the U.S., a clear trend emerges: In many countries with available data, the balance of opinion is shifting in China’s direction.  For example, in 2023, 35% of Indonesians said the U.S. was the world’s leading economic power, while 16% said China – a gap of 19 points in favor of the U.S. This year, 23% of Indonesians name the U.S., while twice as many (46%) name China – a gap of 23 points in favor of China. In 2023, people in Argentina, France and South Africa were about equally likely to name the U.S. and China as the world’s top economy. Today, they are significantly more likely to name China than the U.S. And in Germany, Greece, Italy and Spain, people were already more likely to name China in 2023, but the gap is even wider today. In Sweden, people still view the U.S. as the world’s leading economic power, but the margin over China has shrunk significantly. And in Kenya, the gap has disappeared entirely.  In India and Turkey, we last asked this question in 2019. Adults in both countries were, and remain, more likely to view the U.S. is the top economy, though the margin is now smaller.  In some countries, the balance of opinion increasingly favors the U.S. This is true in Canada, Japan and Nigeria. Canadians were about equally as likely to name China and the U.S. as the top economy in 2023. Now, they’re 23 points more likely to name the U.S. (The Canadian survey was conducted during a time of rapidly shifting policies affecting U.S. tariffs on Canada and Canadian tariffs on the U.S. For more on our survey fieldwork timeline, refer to Appendix A.)    There has been no significant change in the balance of opinion in the Netherlands, where China and the U.S. are seen as equally powerful economies. And adults in Israel, South Korea and the U.S. itself have been consistent in their belief that the U.S. is the world’s leading economy. Economic ties with the U.S. seen as more important than ties with China Though China is increasingly seen as the world’s top economy, people in most nations surveyed say it is more important for their country to have strong economic ties with the U.S.  Majorities in nine countries say ties with the U.S. are more important, while roughly half of adults say the same in another nine.  In Kenya and Mexico, opinion is split: Roughly equal shares prioritize close economic ties with the U.S. and with China.  Only in Australia, Indonesia and South Africa do the largest share of adults say economic ties with China are more important than ties with the U.S. Notably, roughly a quarter of adults or more in Germany, Hungary, Israel and Nigeria volunteer that ties with both China and the U.S. are important to their country. Views over time In nearly all of the high-income countries surveyed, majorities continue to prioritize close economic ties with the U.S. Though in most of these places the shares who say ties with China are more important has grown since 2021. In several middle-income countries, the balance of opinion has shifted since 2019, when the question was last asked.  For example, Indonesians and South Africans in 2019 were as likely to prioritize economic ties with the U.S. as they were to prioritize ties with China. Now, their economic relationship with China holds significantly more importance.  In Kenya and Mexico, where the U.S. was once seen as

2. China’s economic power and economic relations Read More »

People in Many Countries Consider the U.S. an Important Ally; Others See It as a Top Threat

Left: The U.S. and European Union flags are displayed ahead of a European Council meeting at the EU headquarters in Brussels on March 24, 2022. (Nicolas Maeterlinck/Belga Mag/AFP via Getty Images) Right: Polish soldiers stand by as a U.S. Army tank drives off a German-British rig during a NATO military exercise near Gniew, Poland, on March 4, 2024. (Sean Gallup/Getty Images) How we did this For this Pew Research Center analysis, we asked respondents in 25 nations which country they think is the most important ally to their own. Then we asked which country they think poses the greatest threat to their own.  People could name anything that came to mind for both questions. We asked about countries specifically but recorded all non-country responses (such as “European Union”). Follow-ups to the threat question asked respondents to think about the country, or entity, they had just named.  For non-U.S. data, this analysis draws on nationally representative surveys of 28,333 adults conducted from Jan. 8 to April 26, 2025. All surveys were conducted over the phone with adults in Canada, France, Germany, Greece, Hungary, Italy, Japan, the Netherlands, Poland, South Korea, Spain, Sweden and the United Kingdom. Surveys were conducted face-to-face in Argentina, Brazil, India, Indonesia, Israel, Kenya, Mexico, Nigeria, South Africa and Turkey. In Australia, we used a mixed-mode probability-based online panel.  In the United States, we surveyed 3,605 U.S. adults from March 24 to March 30, 2025. Everyone who took part in this survey is a member of the Center’s American Trends Panel (ATP), a group of people recruited through national, random sampling of residential addresses who have agreed to take surveys regularly. This kind of recruitment gives nearly all U.S. adults a chance of selection. Interviews were conducted either online or by telephone with a live interviewer. The survey is weighted to be representative of the U.S. adult population by gender, race, ethnicity, partisan affiliation, education and other categories. Read more about the ATP’s methodology.  Here are the questions used for this analysis, along with responses, and the survey methodology. When asked which country is the most important ally to their own, many people around the world name the United States. This is the most common response in 12 of the 24 non-U.S. countries included in a new Pew Research Center survey. It is tied for the top response in three additional countries. But others say the U.S. is their nation’s greatest threat. This is the most common response in six countries and tied for top in two others.  In neighboring Canada and Mexico, as well as in Argentina, Brazil and Kenya, the U.S. is the top response on both the ally and threat questions.  Respondents could name anything that came to mind for these questions. We did not ask them to choose from a list.  Russia and China also emerge as key threats Russia is the most commonly named threat in eight of the 10 European countries surveyed. (It ties with the U.S. in one more: Spain.) In France, Germany, the Netherlands, Poland, Sweden and the United Kingdom, roughly half of adults or more say Russia is their country’s greatest threat. In the U.S. and in several Asia-Pacific countries, people tend to see China as their greatest threat. It’s the most common response in Australia, Japan and the U.S., and the second-most common in India and South Korea. In Indonesia, China is tied with Israel for the second-most common response. In general, proximity and historical conflict both seem to play an important role in which countries people see as significant threats to their own. For this analysis, we surveyed 31,938 adults in 25 countries, including the U.S., from Jan. 8 to April 26, 2025. The survey was conducted prior to the start of the Israel-Iran war in June, and before the U.S. attack on Iran’s nuclear facilities. Refer to Appendix A for more details about the survey field period.  Views of the U.S. As an ally Israeli adults are especially likely to name the U.S. as their country’s most important ally. Israelis also stand out for their particularly positive ratings of the U.S. and its president, the same Center survey found.  Japanese and South Koreans, too, overwhelmingly agree that the U.S. is their most important ally. Very few name any other country.  And roughly half of adults or more in Canada and the UK name the U.S. as their most important ally. For their part, 18% of Americans see the UK as their top ally (the most common response) while 12% name Canada (the second-most common).  Related: Americans’ views of allies and threats Though fewer than half of people in Argentina, Australia, Brazil, India, Italy, Mexico and Poland name the U.S. as their most important ally, it is still the most common response in each of these nations. In Kenya, as well as in Nigeria, similar shares see the U.S. and China as top allies. And in Hungary, similar shares name the U.S. and the European Union.  In countries where the U.S. is not the most common response, there are a few others that tend to rise to the top: Germany is the most common response in France and the Netherlands. France is the most common response in Germany and Greece. In Indonesia and South Africa, more people name China than any other country.  Read more about views of allies in Chapter 1. As a threat Though the U.S. is seen as an important ally in many places, people in eight countries most frequently name it as their top threat. Majorities in both Canada and Mexico view the U.S. this way, as do roughly a quarter of adults or more in Argentina, Brazil, Indonesia and South Africa. In Kenya and Spain, the U.S. ties for the top response on this question.  In an additional 10 countries, including many in Europe, the U.S. is the second-most common response, or tied for second.  Views of the U.S. as a threat over time We asked a version of this question in 2019, with slightly different – but comparable – wording. Since then, the share of Canadians naming the U.S. as their country’s greatest

People in Many Countries Consider the U.S. an Important Ally; Others See It as a Top Threat Read More »

2. Who do people think is their country’s greatest threat?

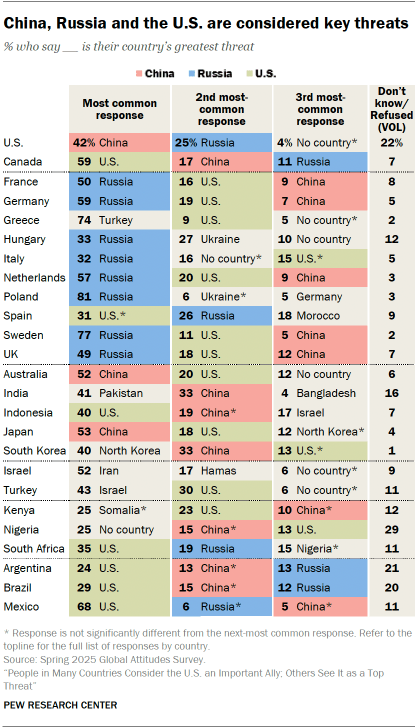
China, Russia and the U.S. are the countries most widely viewed as international threats across 25 nations surveyed. In fact, one of these countries appears in the top three most common responses from every nation included in our survey, except Israel. Still, sizable shares in some places say there is no country that poses the greatest threat to their own.  In the U.S., people most often point to China as their country’s greatest threat, followed by Russia. In Canada, however, a majority say their top threat is the U.S., with smaller shares naming China and Russia. Canada is one of several nations where the U.S. is considered both a top threat and a top ally. Across Europe, respondents most consistently say Russia poses the greatest threat to their country. Notably, three-quarters of adults or more in Poland and Sweden take this stance.  The shares naming Russia as a threat in Europe today are much larger than when we asked a similar question in 2007 in a subset of these countries. In the UK, for example, people at that time were more likely to name Iran, Iraq, China and the U.S. as threats. Fewer than 10% of Britons saw Russia as a significant threat, compared with 49% today. The U.S. is also seen as a threat across Europe. It is the second-most common response in six of the 10 European countries surveyed, and tied with Russia at the top in Spain. China is the third-most common answer in five European countries. Greece is the only European country where fewer than a quarter of adults name Russia as their country’s greatest threat; a 74% majority name Turkey. In Hungary and Poland, the U.S. does not appear among the top three responses. Instead, Ukraine emerges as the second-most common threat in Hungary (27%) and ties for second in Poland (6%). In the Asia-Pacific, China looms large. It is the most common or second-most common response in all five nations surveyed in that region, and tops the list in some places by quite a wide margin: Roughly half of adults in Australia and Japan say China is the greatest threat to their country, followed by about two-in-ten who name the U.S.  In the case of India and South Korea, proximity and historical conflict seem to shape respondents’ views. In India, 41% of adults say Pakistan poses the most significant threat to their country. Another third say China – the next-most common response. (The India survey was conducted Feb. 7-April 21, 2025, before the recent deadly conflict between India and Pakistan.)  Meanwhile, South Koreans most frequently name North Korea as the greatest threat to their country, at 40%. In Israel, about half of people say Iran is their greatest threat, followed by 17% who say Hamas. Turks, on the other hand, most commonly name Israel (43%), followed by the U.S. (30%).  In sub-Saharan Africa, the U.S. is commonly seen as a significant threat: 35% of South Africans, 23% of Kenyans and 13% of Nigerians take this stance. Another quarter of Kenyans say neighboring Somalia is their country’s greatest threat (not statistically different from the share who name the U.S.). The most common response among Nigerians, given by 25%, is that no country is their greatest threat.  In each of the three Latin American countries surveyed, the U.S. is the most common response. Mexicans are especially likely to say the U.S. poses the greatest threat to their country, with 68% holding this view.  Views by ideology  In about half of the countries surveyed, those who place themselves on the left are more likely than those on the right to say the U.S. is their country’s greatest threat. For example, 34% of Australians on the left name the U.S., compared with 18% in the center and 5% on the right.  In nine countries, those on the right are more likely than those on the left to say China is their country’s greatest threat.  Views of these countries as economic, national security threats After respondents named the country they think poses the greatest threat to their own, we asked them to rate how much of an economic threat and national security threat that country is. Overall, the U.S. is seen mostly as an economic threat, while Russia is seen mostly as a security threat. U.S. as an economic threat Those who say the U.S. is the greatest threat to their country are generally more likely to view it as an economic threat than a national security concern.  In Canada, roughly three-quarters of adults who name the U.S. say it poses a great deal of threat to their economy. Majorities in Argentina, Australia, France, Germany, Italy, Kenya, Mexico, Nigeria, South Korea and Turkey agree. People who see the U.S. as a threat are less likely to label it a security threat in most countries surveyed. Still, half or more in Mexico (56%), Canada (53%) and France (50%) say it poses a great deal of threat to their national security.  Russia as a national security threat  Among those who say Russia is the greatest threat to their country, more believe it threatens their national security than their economy.  For example, 73% of Americans who see Russia as their top threat say it poses a great deal of security risk, while 32% say this about economic risk.  In Europe, at least a third of people who name Russia see it as a significant security threat. This share comes to roughly half or more in France, Germany, Hungary, the Netherlands, Poland and the UK. In these countries, significantly smaller shares view Russia as an economic threat.  Views of China’s impact are more mixed  In some countries, assessments of China as an economic and security threat don’t lean one way or the other. For example, 50% of Australians who see China as their greatest threat say it poses a great deal of economic threat, while an identical 50% say it’s a significant national security threat.  People in the U.S. are also about equally likely to label China as an economic threat (64%) and a security threat (61%). The pattern in South Korea is the same.  However, Italians and Nigerians who name China are more

2. Who do people think is their country’s greatest threat? Read More »

Americans’ Views on Who Influences Health Policy and Which Health Issues To Prioritize

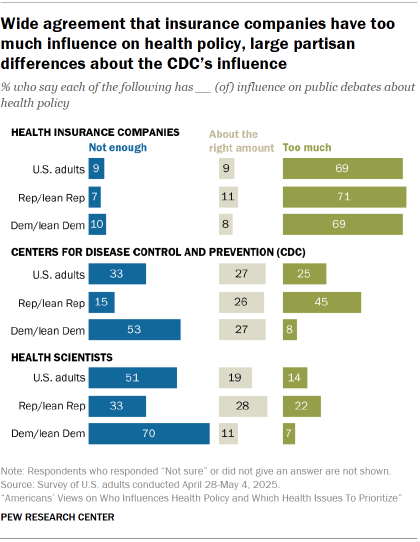
How we did this Pew Research Center conducted this study to understand Americans’ views of health issues facing the country today, the influence of various groups and institutions on health policy, and the federal government’s role in certain health programs. For this analysis, we surveyed 5,085 U.S. adults from April 28 to May 4, 2025. Everyone who took part in the survey is a member of the Center’s American Trends Panel (ATP), a group of people recruited through national, random sampling of residential addresses who have agreed to take surveys regularly. This kind of recruitment gives nearly all U.S. adults a chance of selection. Interviews were conducted either online or by telephone with a live interviewer. The survey is weighted to be representative of the U.S. adult population by gender, race, ethnicity, partisan affiliation, education and other categories. Read more about the ATP’s methodology. Here are the questions used for this report, the topline and the survey methodology. Americans are in the midst of ongoing discussion and debate about which health issues are most pressing and who should play a role in addressing them. According to a new Pew Research Center survey, a solid majority of U.S. adults (69%) say health insurance companies have too much influence on public debates about health policy. Of the eight groups and institutions we asked about in this survey – such as Congress, the general public and federal courts – health insurance companies are the one that a majority of Americans agree has too much sway in health policy. Just 9% say they have about the right amount of influence, and an equal share say they don’t have enough. Although politics and health policy are often deeply entangled, this dim opinion of health insurance companies’ influence is an area of notable partisan agreement. Roughly equal shares of Democrats (including those who lean to the Democratic Party) and Republicans (and GOP leaners) express this view. Similar shares of Democrats and Republicans also say Congress has too much influence on health policy, although this view is less widely held than it is for health insurance companies. In contrast, views are more mixed when it comes to the role of the Centers for Disease Control and Prevention (CDC). The agency has undergone major restructuring and cuts under the Trump administration, and the public is split about its health policy role. Overall, 33% say the agency doesn’t have enough influence over health policy, while 25% disagree and say it has too much influence. That’s about the same as the share who see the organization as having about the right amount of influence (27%). And Republicans and Democrats express sharply opposing views on the CDC. While 53% of Democrats say the CDC doesn’t have enough policy influence, 45% of Republicans say it has too much. In addition to government institutions and insurance companies, health scientists also play a role in shaping health policy. And on balance, the public sees them as not having enough influence. About half of Americans express this view. The share rises to a majority among Democrats. By a 37 percentage point margin, Democrats are more likely than Republicans to see health scientists as not having enough influence (70% vs. 33%). This finding tracks with our previous polling that found that Democrats are far more supportive of scientists playing a role in policymaking than Republicans. Still, more Republicans say health scientists don’t have enough policy influence (33%) than have too much influence (22%). And 28% say their influence is about right. This survey, conducted from April 28 to May 4, 2025, builds on our work tracking Americans’ views on scientists and their influence on policy. We conducted the current survey to understand Americans’ views on the role of health experts and institutions on health policies and programs. The survey also explored how much of a problem they feel long-standing and emerging health issues are for the nation. Find more details on: Which health issues are problems for the country today? | How important is the federal government’s role in health programs and policies? | How much health policy influence do different groups and institutions have? Other key takeaways: About eight-in-ten or more Americans say cancer, obesity, heart disease and opioid addiction are major problems. These views are held equally by both Democrats and Republicans. While over half of Americans say measles and bird flu are minor problems for the country today, about one-in-four describe them as major problems. Roughly one-in-five say they’re not problems at all. (This survey was conducted amid ongoing measles outbreaks in the United States.) Majorities of Americans say it’s extremely important for the federal government to test drugs for safety (63%) and track the spread of contagious diseases around the country (54%). By a 30 percentage point margin, larger shares of Democrats than Republicans say it’s extremely important for the federal government to track the spread of contagious diseases in the U.S. (69% vs. 39%). Which health issues are problems for the country today? As policymakers, advocates and health care professionals are debating which health issues are most urgent, we asked Americans how much of a problem eight health issues are for the country today. These include long-standing top causes of death in the U.S. like cancer and heart disease, as well as issues that have recently made headlines, like measles and bird flu. While eight-in-ten or more Americans say each of these is at least a minor problem, the share of Americans who say these are major problems differs across issues. Large majorities of Americans say cancer (84%), obesity and being overweight (84%), heart disease (80%) and opioid addiction (79%) are major problems for the U.S. today. Smaller majorities say the same about Alzheimer’s disease (64%) and loneliness (55%). Ongoing measles and bird flu outbreaks have made recent news, but far fewer Americans say these two infectious diseases are major problems. About a quarter (26%) of Americans say bird flu is a major problem for the country today and 25%

Americans’ Views on Who Influences Health Policy and Which Health Issues To Prioritize Read More »

1. Who do people think is their country’s most important ally?

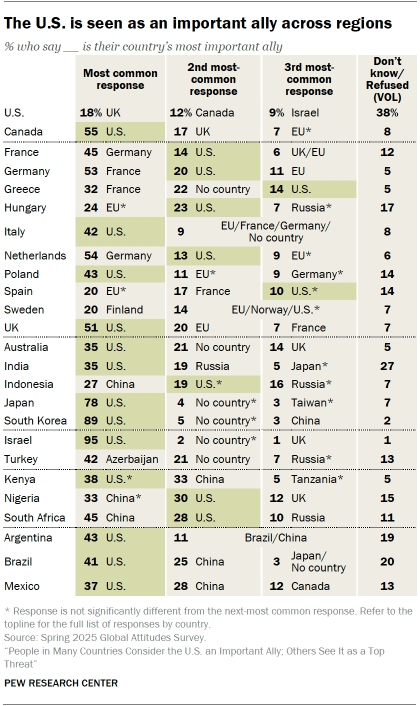
When asked to name their country’s most important ally, people around the world often point to the U.S. Respondents in sub-Saharan Africa and Latin America also frequently name China, while those in Europe commonly cite the EU or specific European powers. People in the U.S. and Canada look across their shared border on this question, naming the other country as their most important ally. The UK is also a popular response in these nations – in fact the most popular among Americans. Among U.S. adults, 18% say the UK is their top ally, and 12% name Canada. In Canada, a 55% majority say the U.S. is their top ally, while 17% name the UK. Most adults in the European countries surveyed see their own neighbors as important allies, though the U.S. is also a common answer throughout the region. In some places, a particular European power rises to the top. In the Netherlands, for example, a 54% majority of adults name Germany as their country’s top ally. Elsewhere in Europe, multiple responses crop up at similar rates. In Hungary, about equal shares of adults see the EU (24%) and the U.S. (23%) as their country’s most important ally.  The U.S. is also seen as a key ally across the Asia-Pacific region. People in Australia, India, Japan and South Korea are more likely to name the U.S. than they are to name any other country. This includes 89% of adults in South Korea and 78% in Japan. In Indonesia, China takes the top spot at 27%, while the U.S. is the second-most common response at 19%.  In Israel, 95% of adults name the U.S. as their most important ally, more than any country surveyed. But in nearby Turkey, the largest share of adults (42%) see Azerbaijan as their top ally. Turkey is the only country included in the survey (other than the U.S. itself) where fewer than 10% name the U.S. on this question. In the sub-Saharan African countries surveyed, China joins the U.S. on the list of most common responses. Similar shares of adults in Nigeria, as well as in Kenya, say the U.S. and China are their country’s most important ally. China takes the top spot for South Africans (45%), while the second-largest share (28%) name the U.S. as their top ally. The U.S. and China are also seen as major allies in Latin America, too, though the U.S. is more commonly named across all three survey countries in this region: Argentina, Brazil and Mexico.  Views by ideology Views of the U.S. as an ally vary by ideology. Those who place themselves on the right are generally more likely than those on the left to name the U.S. as their country’s most important ally.  This pattern is especially clear in Europe: Views differ by about 25 points in Hungary, Poland and the UK. (For their part, adults on the left in these countries are more likely than those on the right to say the EU is their most important ally.) Still, the largest ideological gap (+34 points) is found in Australia, where 59% of those on the right name the U.S. as their most important ally, compared with 25% of those on the left.  There are ideological differences even in Japan (+12) and Israel (+11), where vast majorities of the population name the U.S. as their top ally. In Europe, people with a favorable view of right-wing populist parties are also more likely to see the U.S. as an ally. The largest differences are in Hungary and Poland: Supporters of Fidesz in Hungary are four times as likely as nonsupporters to see the U.S. as an ally (42% vs. 10%), while supporters of Law and Justice in Poland are twice as likely as nonsupporters (66% vs. 33%) to take this stance.  There are also significant differences between supporters and nonsupporters of Reform UK (+24 points), AfD in Germany (+21), Lega in Italy (+14), Vox in Spain (+14), Party for Freedom in the Netherlands (+11) and National Rally in France (+6).  source

1. Who do people think is their country’s most important ally? Read More »

Behind Trump’s 2024 Victory, a More Racially and Ethnically Diverse Voter Coalition

A dog waits for voters at a New York City polling place on Nov. 5, 2024. (Fatih Aktas/Anadolu via Getty Images) How we did this Pew Research Center conducted this study to better understand which voters cast ballots in the 2024 presidential election and how they voted. We also wanted to compare how turnout and vote choices differed from previous elections in 2020 and 2016. Measuring turnout among different groups in the electorate is challenging; it is particularly difficult to assess changes in turnout from election to election. Panel-based survey data provides us a unique opportunity to study elections. By surveying the same people over time and measuring their choice among the candidates (for both voters and nonvoters), we can more clearly see how differences in who stays home – and who turns out to vote – affect each election. We can also measure how adults’ partisan voting preferences change (or do not change) between elections. For this study, we surveyed U.S. adults on our nationally representative American Trends Panel (ATP). We verified their turnout using commercial voter files that aggregate publicly available official state turnout records. The first analysis of validated voters was completed after the 2016 election. Turnout was validated for subsequent elections in 2018, 2020, 2022 and 2024. Each state and the District of Columbia compiles these publicly available turnout records as part of their routine election administration. To validate 2024 election turnout, we attempted to match adult citizens who are part of the ATP to a turnout record in at least one of three commercial voter files: one that serves conservative and Republican organizations and campaigns, one that serves progressive and Democratic organizations and campaigns, and one that is nonpartisan. A member of the ATP is considered a validated voter for a given election if they: Told us they voted, and Were recorded as having voted in at least one of the three commercial voter files. Those who said they did not vote in an election are considered nonvoters. Nonvoters also include anyone – regardless of their self-reported vote – for whom we could not locate a voting record in any of the three commercial voter files. Those who could not be matched were also considered nonvoters. Overall, 94% of panelists who we attempted to match were successfully matched to at least one of the three voter files. The survey is weighted to be representative of the U.S. adult population by gender, race, ethnicity, partisan affiliation, education and other factors. For benchmarks of partisan affiliation within racial and ethnic categories, we used estimates produced by the Center’s 2023-24 Religious Landscape Study of more than 36,000 adults. In addition, this survey is weighted to benchmarks for voter turnout and presidential vote preference. Here are the questions used for this report. Additional information about the voter file matching and verification process, as well as sample sizes for all elections reflected in the validated voter variables, can be found in the methodology section of this report. Terminology Validated voters: Adult citizens who told us in a postelection survey that they voted in a given general election and have a record of voting in a commercial voter file. Voting-eligible: In this report, any U.S. adult citizen in the American Trends Panel is considered “eligible” to vote. In some states, criminal records disqualify adult citizens from voting in elections. This study does not attempt to identify such individuals if they are in the panel. In addition, eligible voters living abroad are not included in the panel.  New and returning voters: Validated voters who turned out in the 2024 election, but not in the 2020 election. This includes both those who were old enough to vote in 2020, but did not, and voters who were too young to vote in 2020, but were 18 years of age or older in 2024 and cast a ballot.    Turnout: Refers to “turning out” to vote, or simply “voting.” Also used to refer to the share of eligible adults who voted in a given election (e.g., “The turnout in 2024 among the voting-eligible population in the U.S. was 64%”). Differential partisan turnout: Refers to the difference in turnout between supporters of different parties (e.g., “More 2020 Trump voters than 2020 Biden voters turned out in 2024”).  Defectors/Defection: People who switched their vote to a different party’s candidate from one election to the next. Also referred to as “vote switching.” Drop off/Drop-off voters: Voters who turn out in a given election but not in a subsequent one are said to have “dropped off” and are sometimes referred to as “drop-off voters.” Nonvoters: Voting-eligible adults who did not vote in the 2024 election (or whichever election is specified).   American Trends Panel: Pew Research Center’s probability survey panel, which consists of nearly 10,000 adults who take two to three surveys each month online or by telephone. Some panelists have been participating in surveys since 2014. Voter file: A list of adults that includes information such as whether a person is registered to vote, which elections they have voted in, whether they voted in person or by mail, and additional data. Voter files do not record who a voter cast a ballot for. Federal law requires states to maintain electronic voter files. Many businesses assemble these files to create a nationwide list of adults along with their voter information. Panel survey: A type of survey that relies on a group of people who have agreed to participate in multiple surveys, either indefinitely or over a specific time period. Panel surveys make it possible to observe how individuals change over time because the answers they give to questions in a current survey can be compared with their answers from a previous survey. In his third run for president in 2024, Donald Trump defeated Kamala Harris by 1.5 percentage points overall, winning 312 Electoral College votes and the national popular vote for the first time. Trump won with a voter coalition that was more racially and ethnically diverse than in 2020 or 2016, according to a new

Behind Trump’s 2024 Victory, a More Racially and Ethnically Diverse Voter Coalition Read More »

1. Voter turnout, 2020-2024

Because partisanship and voting preference are highly correlated – and most adults stick with their preferred party over time – voter turnout is often a key factor in understanding why there are changes in electoral outcomes year to year. In the 2024 presidential election, a higher share of Donald Trump’s 2020 voters than Joe Biden’s 2020 voters turned out to vote. Trump also won a higher share of those who had not voted four years earlier. This is different than in 2020 and 2016, when those who didn’t vote in the previous presidential election favored Democratic candidates. Looking across multiple years, White voters, older voters, more affluent voters and voters with higher levels of formal education typically turn out at higher rates than other groups. These patterns persisted in 2024. About this report This Pew Research Center analysis examines voter turnout and voting preferences in the 2024 presidential election through the lens of validated voters. Validated voters are adult citizens who told us that they voted in a postelection survey and have a record showing they voted in their state’s official voter turnout records. The postelection survey of U.S. adults was conducted Nov. 12-17, 2024, on the American Trends Panel (ATP). The ATP is a panel survey, meaning that we have interviewed many of the same respondents after each national election going back to 2016. This allows us to examine how individuals changed their turnout or candidate preferences over time. For more on how the study was conducted, read the report’s methodology. For more about terms used in the report, refer to the terminology box. How did 2024 turnout compare with previous elections? The 2020 and 2024 presidential contests were among the highest-turnout elections in the past century. The 66% turnout rate in 2020 was the highest since 1908, and 2024’s rate of 64% was the second highest, tied with 1960. The last two midterm elections also featured unusually high turnout levels, with rates not seen since the 1960s. The spike in voter turnout is at least partly attributable to intensifying political polarization during the past decade, a period in which growing partisan antipathy has raised the stakes of election outcomes in the minds of many voters. Which party typically benefits from high turnout? Almost by definition, high-turnout elections mobilize more infrequent and new voters. For the past several decades, high turnout often benefited Democratic candidates, who enjoyed greater support among less-affluent, minority and young voters – groups that tend to vote at lower rates. This pattern has been weakening since 1960 but was still evident in the 2020 election. The 2024 election was different. New and returning voters The 2024 Trump campaign was reported to be targeting infrequent voters. Voters in 2024 who had not turned out in 2020, but were eligible, favored Trump by a margin of 54%-42%. (Adding in the small share of voters who were too young to have voted in 2020 narrows the margin to 52%-45%.) By contrast, Trump received 46% of the vote among 2020 voters who had not cast a ballot in 2016 but were eligible to do so; 51% voted for Biden. (Among all new and returning voters in 2020, including those too young to have voted in 2016, Biden led Trump by 52%-44%.) This pattern reflects shifts in public preferences toward Trump and away from the Democratic ticket, as well as greater voter engagement among Trump supporters. Both overall and across most demographic groups in the population, Trump’s 2020 voters turned out at higher rates than Biden’s did. Nonvoters Moreover, eligible voters in 2024 who did not cast a ballot were fairly closely divided in their preferences: 44% said if they had voted, it would have been for Trump, while 40% said they would have voted for Harris. This stands in contrast to 2020, when eligible voters who didn’t vote expressed a clear preference for Biden (46% said they would have voted for Biden, 35% said they would have voted for Trump). Turnout and the 2024 election Among all 2020 Trump voters, 89% voted in 2024, compared with 85% among Biden’s 2020 voters. The turnout difference was larger among Hispanic voters than among many other groups: 86% of Trump’s 2020 Hispanic voters turned out in 2024, compared with 77% of Biden’s Hispanic voters. Trump also held turnout advantages among men and women, adults 35 and older, and those with no college degree. In contrast, there was almost no difference in 2024 turnout among 2020 Trump and Biden voters who are White. And among young voters who were eligible to vote in both elections (those ages 22 to 34 in 2024), there was a 3 percentage point difference in the rate at which Biden’s 2020 voters turned out in 2024 (77%) compared with Trump’s voters (80%). Composition of voters and nonvoters in 2024 Consistent with long-standing patterns in turnout, voters and nonvoters in 2024 differed substantially on several demographic characteristics. Compared with voters, nonvoters were younger, had lower family incomes, and were less likely to be White or to have attended college. Young adults were a larger share of nonvoters in 2024 than in 2020 (30% vs. 25%). Age has long been a reliable predictor of turnout. Citizens under age 30 constituted only 15% of all voters in 2024, considerably below their share of the age-eligible population (20%). Almost half of nonvoters (48%) had only a high school education or less, compared with 28% among voters. College graduates made up about twice the share of voters (41%) as nonvoters (22%). Non-Hispanic White adults made up a larger share of voters than nonvoters in 2024, though the share who were voters declined slightly from 73% in 2020 to 71% in 2024. White adults were also a smaller share of nonvoters in 2024 than in 2020, reflecting the steady growth of the non-White population in the U.S. In 2024, nonvoters were split in their preferences between Trump and Harris. They were also closely divided in their partisan affiliation. In both 2016 and 2020,

1. Voter turnout, 2020-2024 Read More »