Pew Research Center

Video: How do American men and women differ religiously?

The gender gap in American religion is shrinking. Historically, women in the United States have been more religious than men, and that is still true today. But the gap is smaller than it once was. Dive into the data with Pew Research Center’s Senior Associate Director Gregory A. Smith. Learn more about the study at pewresearch.org/rls. Publications from the Religious Landscape Study source

Video: How do American men and women differ religiously? Read More »

Spirituality and Religion: How Does the U.S. Compare With Other Countries?

A recent Pew Research Center survey shows that about seven-in-ten Americans identify with a religion. Seven-in-ten Americans also believe in an afterlife. And about half of Americans say that parts of nature – such as mountains, rivers or trees – can have spirits or spiritual energies. But how does the United States compare with other countries when it comes to spirituality and religion? This interactive narrative walks through data from the U.S. and 35 other countries we surveyed in 2023 and 2024. Together, these three dozen countries are home to about 4 billion people – roughly half of the world’s population. Although we were not able to conduct surveys in China or many Muslim-majority nations, we have findings on spirituality and religion from all inhabited continents, places with many different religious traditions, and countries with various income levels. At the end of this brief interactive narrative, you’ll find a sortable table to explore several questions we asked around the world about respondents’ spiritual and religious beliefs and practices. More than two-thirds of U.S. adults identify with a religion – whether Christianity, Judaism, Buddhism, Hinduism, Islam or something else. That’s a high number compared with some other wealthy (i.e., economically advanced) countries. For example, just 46% of adults in the Netherlands and 44% in Japan claim any religious identity. But when we look at all three dozen countries, quite a few have large percentages of people who say they have a religion. This includes places like Indonesia and Israel, where almost all adults identify with a religion. In many countries – even places where nearly all adults say they have a religion – not everyone believes in life after death. In Israel, one of the countries with near-universal religious affiliation, just 61% say there is “definitely” or “probably” life after death. In the U.S., seven-in-ten adults think there is definitely or probably an afterlife, which puts the U.S. in the top third of countries surveyed on this question. Across Europe, people are far less likely to believe in life after death. For example, 38% of Swedish adults express belief in an afterlife. Nearly half of U.S. adults, meanwhile, say they believe that parts of nature – such as mountains, rivers or trees – can have their own spirits or spiritual energies. Solid majorities in India and Peru also hold this view. But only about three-in-ten people surveyed in Poland say parts of nature can have spirits. When it comes to rates of daily prayer, the U.S. is roughly in the middle of the 35 countries surveyed. Yet the U.S. stands out among high-income countries on this question. Generally speaking, relatively few adults in wealthy countries – such as Japan and France – say they pray daily. Countries where most people pray daily tend to be middle-income countries, such as Nigeria and the Philippines. We also asked about some kinds of spirituality that are less common around the world. In most places surveyed – including the U.S. – about two-in-ten or fewer adults say they consult a fortune teller, horoscope or other way to see the future. Even in India, where using various means to see the future is relatively common, just under half of adults say they do this. source

Spirituality and Religion: How Does the U.S. Compare With Other Countries? Read More »

2. Voting patterns in the 2024 election

For the most part, voting patterns across demographic groups in the 2024 presidential election were not substantially different from the 2020 and 2016 elections. But Donald Trump’s gains among several key groups of voters proved decisive in his 2024 victory. To explore voting patterns among subgroups over time, refer to detailed tables. Hispanic voters were divided in 2024, a major shift from 2020 and 2016. In 2020, Joe Biden won Hispanic voters by 25 percentage points, and Hispanic voters supported Hillary Clinton by an even wider margin in 2016. But Trump drew nearly even with Kamala Harris among Hispanic voters, losing among them by only 3 points. Black voters also moved to Trump but remained overwhelmingly Democratic.Trump nearly doubled his support among Black voters between 2020 and 2024: 8% voted for him in 2020 vs. 15% last year. Still, 83% of Black voters backed Harris. Men – especially men under 50 – backed Trump by larger margins. Men supported Trump by a wider margin than in 2020. Trump narrowly won men under age 50, a shift from 2020 when men in that age group favored Biden by 10 points. As in prior elections, a change in voters’ partisan allegiances – switching from the Democratic to the Republican candidate or vice versa – proved to be a less important factor in Trump’s victory than differential partisan turnout. In the overall electorate and among key demographic groups, Republican-leaning eligible voters simply were more likely to turn out than Democratic-leaning eligible voters in 2024.  And despite some notable changes in the coalitions, many familiar divisions in demographic voting patterns were once again evident. For example, voters with at least four-year college degrees and urban residents voted for Harris by wide margins. By contrast, Trump retained sizable advantages among noncollege voters and voters living in rural areas. About this report This Pew Research Center analysis examines voter turnout and voting preferences in the 2024 presidential election through the lens of validated voters. Validated voters are adult citizens who told us that they voted in a postelection survey and have a record showing they voted in their state’s official voter turnout records. The postelection survey of U.S. adults was conducted Nov. 12-17, 2024, on the American Trends Panel (ATP). The ATP is a panel survey, meaning that we have interviewed many of the same respondents after each national election going back to 2016. This allows us to examine how individuals changed their turnout or candidate preferences over time. For more on how the study was conducted, read the report’s methodology. For more about terms used in the report, refer to the terminology box. Gender and race in voting preferences in 2024 Men favored Trump by 12 percentage points in the 2024 election, while women favored Harris by 7 points. Trump made gains among men compared with 2020 and held roughly steady among women: 55% of men voted for Trump in 2024, up from 50% of men in 2020. 46% of women voted for Trump in 2024, compared with 44% of women four years earlier. Race and ethnicity A 55% majority of White voters cast ballots for Trump in 2024. An identical share of White voters favored Trump in 2020, and 54% selected him in 2016. White men favored Trump by a margin of 20 points in the most recent election. White women favored Trump by a narrower 4-point margin. Though most Black voters continued to prefer the Democratic candidate, a larger share of Black voters cast ballots for Trump in 2024 than in 2020 or 2016. Roughly eight-in-ten Black voters (83%) reported voting for Harris in 2024, while 15% favored Trump. In 2020, 8% of Black voters reported voting for Trump, and just 6% of Black voters favored him in 2016. Black men and women alike were more likely to vote for Trump in 2024 than in 2020. One-in-ten Black women and 21% of Black men voted for Trump in the most recent election. Increased shares of Black voters who favored Trump were driven not by individuals shifting their preferences, but by changes in who turned out to vote. While some Black voters did indeed switch from Biden in 2020 to Trump in 2024, these defections were largely canceled out by Black voters who switched in the opposite direction. Nearly half of Hispanic voters backed Trump. His support among Hispanic voters was 12 points higher than in 2020 (48% in 2024, 36% in 2020). And the share voting for the Democratic candidate fell from 61% to 51%. In 2024, Hispanic women and Hispanic men were divided in their preferences for president. In 2020, Hispanic women were more likely than Hispanic men to vote for the Democratic candidate. Again, these changes were primarily driven by changing turnout patterns: 9% of eligible Hispanic voters voted in 2020 but not in 2024, and these voters favored Biden in 2020 by roughly two-to-one (69% to 31%). By contrast, among Hispanic eligible voters who voted in 2024 but not in 2020, 60% voted for Trump in 2024 and 37% voted for Harris. Asian voters favored Harris in 2024, with 57% voting for her. Four-in-ten Asian voters (40%) cast ballots for Trump, up from 30% in 2020. Asian men and women favored Harris by nearly identical margins (16 and 17 points, respectively). Age and the 2024 vote Consistent with other recent elections, younger voters tended to favor the Democratic candidate while older voters tended to favor the Republican. Voters ages 18 to 49 favored Harris by 7 percentage points in 2024, compared with a 17-point margin for Biden in 2020. Changing vote patterns were driven in part by defections among young voters: 8% of Biden’s 2020 voters under 50 switched to Trump in 2024, while 4% of voters in this group went from Trump to Harris. The share of voters ages 50 and older who favored Trump was essentially unchanged across the two most recent presidential elections: 54% voted for Trump in 2024, compared with 52% in 2020. Vote margins shifted among

2. Voting patterns in the 2024 election Read More »

1. Views of NATO

NATO is seen in a positive light across most of the 13 member nations surveyed: A median of 66% have a favorable view of the alliance, while a median of 30% have an unfavorable view. Majorities in 10 of these countries express a positive opinion of NATO, including about seven-in-ten adults or more in Canada, Germany, Hungary, Poland, Sweden and the UK. Poles have the most favorable opinion: 81% see NATO favorably. Spaniards’ opinions are split (47% favorable vs. 45% unfavorable), while views among Greeks and Turks are more negative than positive, on balance. Historically, no more than about four-in-ten adults in Greece or Turkey have viewed NATO favorably. Views over time While NATO is generally well-regarded among people in the 13 countries surveyed, views have dipped slightly over the past year in a handful of countries. In the Netherlands, for example, 66% of adults have a favorable view of the alliance, down from 75% in 2024. Similarly, this share has declined 9 points in Greece and 7 points in Poland. Views of NATO among Poles, historically one of the publics most favorable toward the organization, have cooled slightly. This year, 81% see NATO positively, down from 88% in 2024. Adults in Germany (+9 points) and Canada (+6) see NATO more favorably than in 2024. By ideology In Canada, Hungary, the UK and the U.S., people who place themselves on the ideological left are more likely than those on the ideological right to express a positive view of NATO. This divide is widest in the U.S., where liberals are about twice as likely as conservatives to see the organization favorably (80% vs. 42%). In Greece and Sweden, adults on the right are much more likely than those on the left to have a positive view of the alliance. By right-wing populist party support In two countries – Italy and Sweden – people who hold a favorable view of right-wing populist parties are more likely than those with an unfavorable view of these parties to see NATO in a positive light. This includes Italians who support Brothers of Italy, led by Prime Minister Giorgia Meloni. Similarly, Swedish adults who support the Sweden Democrats are more likely than nonsupporters to have a favorable view of NATO. Some right-wing populist party supporters are less likely than nonsupporters to express a favorable opinion of the alliance. This is the case for Hungarian supporters of Fidesz and British supporters of Reform UK. And Germans who support Alternative for Germany (AfD) are 34 points less likely than nonsupporters to have positive opinion of NATO. source

1. Views of NATO Read More »

2. Views of Russia and Putin

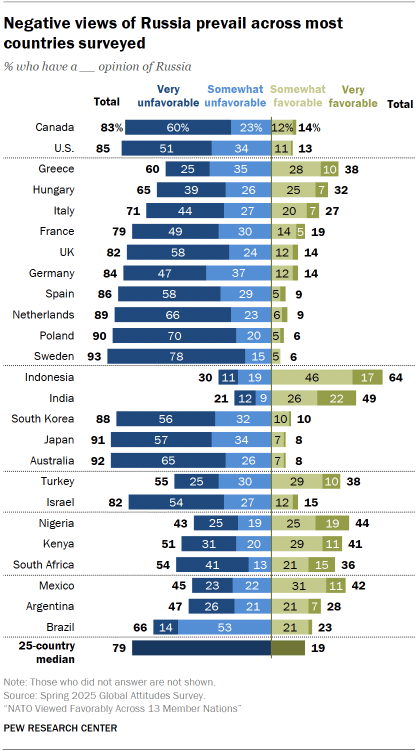
Across the broader set of 25 countries surveyed, attitudes toward Russia are mostly negative. Overall, a median of 79% have an unfavorable view of Russia, while a median of 19% have a positive view. Majorities of adults in 18 of the countries surveyed have an unfavorable view of Russia. And in many of these countries, the predominant attitude toward Russia is very unfavorable: 78% in Sweden, 70% in Poland, 66% in the Netherlands and 65% in Australia describe their view this way. Of the publics surveyed, Indonesians are the most positive toward Russia: 64% have a favorable view.  Opinions in India are also positive, on balance (49% favorable vs. 21% unfavorable), though many Indians (31%) do not express an opinion. In no other country surveyed are opinions about Russia more positive than negative. Views of Russia vs. views of U.S. In 21 of the countries surveyed (excluding the U.S.) people have a more positive view of the U.S. than Russia. This is the case even though America’s image has fallen sharply over the past year in many nations. Only in Indonesia, Mexico and Turkey do more people have a favorable opinion of Russia than of the U.S. Related: U.S. Image Declines in Many Nations Amid Low Confidence in Trump Views over time Opinions of Russia have, in general, shifted very little in the past few years, following a worsening in international public opinion after Russia’s 2022 invasion of Ukraine. But favorable views are up since last year in Greece, Hungary, Italy, Poland and Turkey. In South Korea, favorable views of Russia have declined 9 points. By age, ideology and right-wing populist party support There are some differences in views of Russia by age. In 17 countries surveyed, adults ages 18 to 34 have more favorable opinions of Russia than adults ages 50 and older. In eight countries, people who place themselves on the ideological right are more favorable toward Russia than those on the left. For example, in Hungary, 41% of people on the right have a favorable view, compared with 20% of those on the left. Similarly, many people who support right-wing populist parties in Europe have more favorable opinions of Russia than those with unfavorable views of these parties. For more on U.S. views of Russia by party, read “Republican Opinion Shifts on Russia-Ukraine War.” Confidence in Putin Confidence in Russian President Vladimir Putin is low across the 25 surveyed countries. A median of 84% of adults say they have not too much or no confidence at all in Putin to do the right thing regarding world affairs, while a median of 15% express at least some confidence in him. Europeans’ opinions of Putin are especially critical.  Substantial majorities in every European country surveyed lack confidence in the Russian president, including majorities of 90% or more in the Netherlands, Poland, Spain and Sweden. In several European countries, half or more say they have no confidence at all in Putin. Across the region, no more than four-in-ten express confidence in him. Views are more varied in other parts of the globe. In the Asia-Pacific region, for instance, 60% of Indonesians have at least some confidence in Putin to do the right thing regarding world affairs. But in Australia, Japan and South Korea, fewer than one-in-ten adults hold this view. Of the sub-Saharan African publics surveyed, Kenyans and Nigerians are divided in their views of Putin, while South Africans are more critical. And in Latin America, Mexicans are the most confident in the Russian president, but they rate him more negatively than positively (34% confident vs. 58% not confident). In the Middle East, majorities of people in Israel (87%) and Turkey (59%) lack confidence in Putin. Views over time Confidence in Putin has remained low in most countries since Russia’s 2022 invasion of Ukraine, though opinion has improved slightly in some countries. For example, in Mexico, confidence in Putin is up by 10 points since last year. And in Hungary, roughly a third (32%) now have at least some confidence in him, up from 23% last year. Confidence in Putin is also up in Italy (+7 points), Greece (+6), Turkey (+6) and the U.S. (+4). In some countries, the uptick in overall confidence in Putin is at least partly driven by growing confidence among those who place themselves on the ideological right. For example, 28% of Italians on ideological right now express at least some confidence in Putin, up from 15% last year. By ideology In many countries where we ask about ideology, people on the right are especially likely to express confidence in Putin to do the right thing regarding world affairs. This is especially evident in Hungary, where 43% of those on right say they have confidence in Putin, compared with 20% of those on the left and 27% of those in the center. A similar pattern can be observed in Australia, Canada, Germany, Italy, the Netherlands, Nigeria, Spain, the UK and the U.S. In Israel and Mexico, this pattern is reversed, with people on the ideological left more likely than those on the right to have confidence in Putin. For example, 27% of left-leaning Israelis have at least some confidence in him, compared with 4% of those on the right. By right-wing populist party support Among Europeans, those with a favorable view of right-wing populist parties in their country tend to be more confident in Putin. In Hungary, for instance, more than half of adults who support Fidesz – the party led by Prime Minister Viktor Orbán – have confidence in Putin to do the right thing regarding world affairs (58%). This compares with 13% of Hungarians who do not support Fidesz. In Italy, right-wing populist party supporters have grown more confident in the Russian president since last year. Today, a third of Lega supporters express confidence in Putin, up from 11% in 2024 (+22 points). There have been a similar increases among supporters of Forza Italia and Brothers of Italy. source

2. Views of Russia and Putin Read More »

1. How the U.S. should handle immigrants living in the country illegally

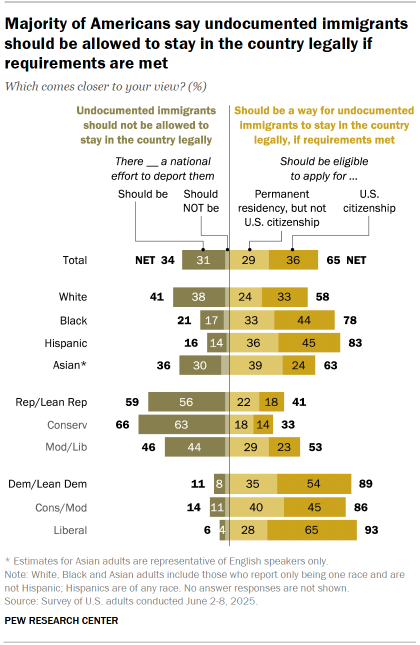
As in past years, a majority of Americans say there should be ways for immigrants who are currently living in the country illegally to stay legally if certain requirements are met – 65% say this today. But the share who say this is lower than a few years ago, with more now saying that there should not be a path to legal status and that there should be a national deportation effort. Today, 31% of U.S. adults say there should be a national deportation effort. While this has changed little in the last year, it has risen steadily over the prior several years: In 2017, 19% backed a national deportation effort. There have long been substantial gaps in these views between racial and ethnic groups and between Republicans and Democrats. Terminology In this report, the terms people or immigrants living in the country illegally and undocumented immigrants are used interchangeably to describe the population of immigrants who are living in U.S. without current legal authorization. Views among racial and ethnic groups While majorities across racial and ethnic groups say that undocumented immigrants should be allowed to stay in the country legally if they meet certain requirements, Hispanic (83%) and Black (78%) adults are more likely than Asian (63%) and White (58%) adults to say this. Overall, 38% of White adults and 30% of Asian adults say there should be a national effort to deport immigrants in the country illegally, while far smaller shares of Black (17%) and Hispanic (14%) adults hold this view. Partisan views Democrats and Democratic leaners Nearly nine-in-ten Democrats – 86% of conservative and moderate Democrats and 93% of liberal Democrats – say there should be a way for undocumented immigrants who meet requirements to stay in the country legally. However, support for a path to citizenship is higher among liberal Democrats (65%) than among conservatives and moderates (45%). Republicans and Republican leaners A 59% majority of Republicans say undocumented immigrants should not be eligible to stay in the country legally, even if they meet certain requirements, while 41% say there should be a pathway to legal status. There are ideological differences within the GOP. About two-thirds of conservative Republicans (66%) say that undocumented immigrants should not be allowed to stay in the country legally, with 63% saying there should be a national deportation effort. By contrast, moderate and liberal Republicans are more divided: 53% say that undocumented immigrants should be allowed to stay if certain requirements are met (23% say this should include eligibility for citizenship, while 29% say it should include permanent residency but not citizenship). And 46% of Republicans in these ideological groups say undocumented immigrants should not be able to stay, including 44% who say there should be a national deportation effort. Within the Republican coalition, there are differences by race and ethnicity as well as age in support for a national deportation effort: 61% of White Republicans and 53% of Asian Republicans support a national deportation effort of immigrants living in the country illegally. Smaller shares of Black (38%) and Hispanic (31%) Republicans say the same. While nearly two-thirds of Republicans ages 65 and older (65%) say there should be a national deportation effort, there is less support among younger age groups. For instance, 46% of Republicans 18 to 34 say this. Across demographic groups in the Democratic coalition, there is little support for a national deportation effort of immigrants who are currently in the country illegally. More Americans now say undocumented immigrants should not be allowed to stay in the U.S. – and that there should be a national deportation effort – than said this a few years ago. This overall shift is driven by changing GOP attitudes. As a result, the partisan gap in these views is wider than in the past. Eight years ago, 34% of Republicans and 8% of Democrats said immigrants in the U.S. illegally should not be allowed to stay and there should be national deportation effort (a 26 percentage point gap). Today, 56% Republicans and 8% of Democrats say this – a 48-point gap. Actions related to deportation enforcement As federal efforts to deport people in the U.S. illegally have ramped up across the country, about two-thirds of Americans (65%) say it would be unacceptable to deport an immigrant in the country illegally to a country other than their home country, while a third say this would be acceptable. But parties are split on these views: 86% of Democrats say it would be unacceptable to deport an immigrant in the U.S. illegally to a different country if they cannot return to their home country. A 55% majority of Republicans say this type of deportation would be acceptable, while 44% say it would be unacceptable. City and state cooperation with federal deportation efforts A narrow majority of Americans say it would be unacceptable for a city or state to not help federal deportation efforts in their communities (55% unacceptable, 43% acceptable). There is a wide partisan gap on this question: 80% of Republicans say it would be unacceptable for a city or state not to help with federal efforts to deport people in their communities who are living in the U.S. illegally, while 66% of Democrats say this would be acceptable. Religious organizations’ cooperation with federal deportation efforts Overall, Americans say religious organizations refusing to help with deportation efforts would be acceptable – 56% say this, while 41% this would be unacceptable. While there is also a partisan gap on this question, it is somewhat narrower than on views of city and state cooperation: 58% of Republicans say it would be unacceptable for a church or other religious organization not to help with federal efforts to deport people in their communities who are in the country illegally, while 73% of Democrats say this would be largely acceptable. source

1. How the U.S. should handle immigrants living in the country illegally Read More »

3. Demographic profiles of Trump and Harris voters in 2024

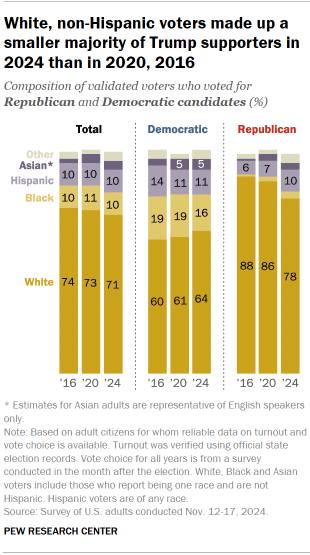
The composition of Republican and Democratic voters in the United States has changed since the 2020 presidential election, and the shifts have been even larger since the 2016 contest. Donald Trump’s voters overall were more racially and ethnically diverse in 2024 than in his prior campaigns, reflecting gains among Hispanic, Black and Asian voters. Conversely, Kamala Harris’ voters were somewhat less diverse than the voters who backed Joe Biden in 2020 or Hillary Clinton in 2016. Despite these changes, there continue to be wide differences in the makeup of the partisan coalitions. Trump voters were less racially and ethnically diverse, older and less likely to have a four-year college degree than Harris voters. And the sizable religious differences between those who voted for Republican and Democratic candidates persisted: Roughly eight-in-ten Trump voters (79%) identified as Christian, compared with about half (52%) of Harris voters. About this report This Pew Research Center analysis examines voter turnout and voting preferences in the 2024 presidential election through the lens of validated voters. Validated voters are adult citizens who told us that they voted in a postelection survey and have a record showing they voted in their state’s official voter turnout records. The postelection survey of U.S. adults was conducted Nov. 12-17, 2024, on the American Trends Panel (ATP). The ATP is a panel survey, meaning that we have interviewed many of the same respondents after each national election going back to 2016. This allows us to examine how individuals changed their turnout or candidate preferences over time. For more on how the study was conducted, read the report’s methodology. For more about terms used in the report, refer to the terminology box. Racial and ethnic composition of Harris and Trump voters in 2024 The racial and ethnic composition of voters shifted only modestly over the past three elections, though the share of voters who are White and not Hispanic continued to tick lower. White voters made up 71% of all voters last year, down from 73% in 2020 and 74% in 2016. Related: Explore long-term changes in the composition of registered voters in our report “Changing Partisan Coalitions in a Politically Divided Nation.” White non-Hispanic adults continued to make up a large majority (78%) of voters who supported Trump. However, this represents the lowest share in the past three presidential elections. White voters made up 86% of Trump’s coalition in 2020 and 88% of Trump voters in 2016. Another 10% of Trump voters were Hispanic, while 3% were Black and 3% were Asian. The share of Trump voters who are Hispanic, Black, Asian or another race has roughly doubled since his 2016 election, from 11% to 20%, mostly because Hispanic voters now make up a larger share of his voters (10%, up from 6% in 2016).   Among Harris voters, 64% were non-Hispanic White, slightly higher than the share of Biden (61%) or Clinton voters (60%) who were White. Among Harris voters, 16% were non-Hispanic Black, while another 11% were Hispanic. Asian adults accounted for 5% of Harris’ voters. Educational composition of 2024 voters About six-in ten voters in 2024 (59%) did not have a college degree. This share has steadily decreased over time as the share of Americans with a college degree has grown (in 2016, 63% of voters did not have a college degree). Overall, those who voted for Democratic candidates in recent elections have been more likely than Republican voters to have a college degree. Harris voters were about evenly split between those who do have a college degree (48%) and those who do not (51%). The share of Democratic voters who have a college degree has risen somewhat since 2016, when 43% had a degree. Among Trump’s 2024 voters, two-thirds (67%) did not have a college degree, down slightly from 71% in 2016. However, the share of Republican voters who are White and have no college degree has substantially declined since 2016. In 2024, White noncollege voters made up a narrow majority (51%) of Trump’s coalition. That is the smallest share in his three campaigns for the White House: In 2020, 58% of Trump voters were White adults who did not have a four-year degree; In 2016, more than six-in-ten Trump voters (63%) were White, noncollege voters. There has been less change in the share of Democratic voters who are White with no college degree (29% in 2024 vs. 27% in 2020 and 26% in 2016). As was the case for Biden and Clinton supporters, White college graduates made up a larger share of Harris supporters (35%) than did White voters who did not have a college degree (29%). Age composition of 2024 voters The age distribution of voters in 2024 was roughly the same as it was in the last two presidential elections. Overall, a majority of voters (56%) were ages 50 and older, while 44% were under the age of 50. Younger voters continued to make up a somewhat larger share of the Democratic coalition than the Republican coalition, but voters under the age of 50 made up a larger share of Trump’s coalition in 2024 than in 2016. Among Democratic voters: 52% of Harris voters were ages 5o and older, while 48% were younger than 50. These numbers are similar to Biden and Clinton’s coalitions. Among Republican voters: 60% of Trump voters were 50 and older in 2024, down from 65% in 2016. Voters under 50 made up 40% of Trump’s coalition in 2024, up from 35% in 2016. Rural, suburban and urban composition of 2024 voters The community profiles of Harris and Trump voters have not fundamentally changed since 2020. Suburban voters made up the largest shares of both Harris (56%) and Trump (49%) voters in 2024. And while Harris voters were much more likely than Trump voters to describe their communities as urban (28% vs. 13%), rural voters made up a substantially larger share of Trump voters (36%) than Harris voters (16%). Religious composition of 2024 voters Overall, the religious composition of voters has

3. Demographic profiles of Trump and Harris voters in 2024 Read More »

11. Religion in Latin America and the Caribbean

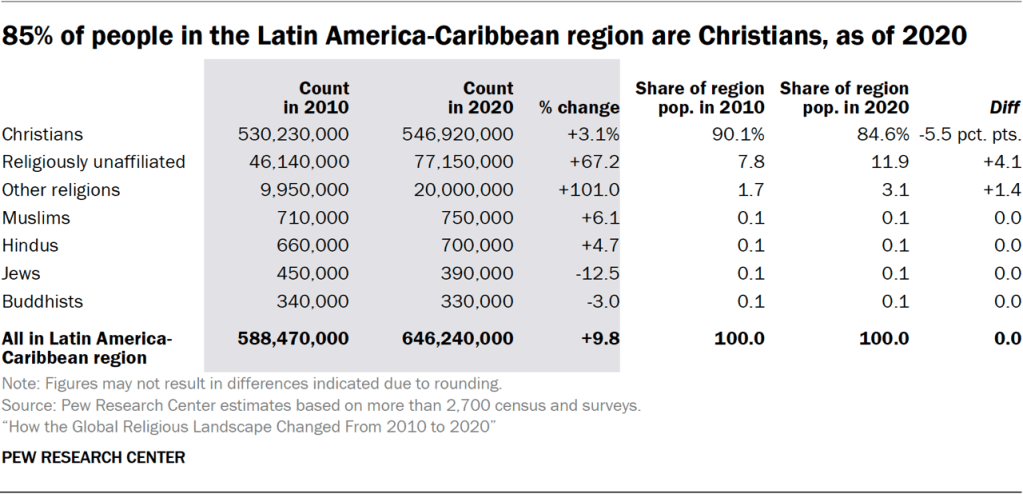
As of 2020, roughly 650 million people live in the Latin America-Caribbean region, an increase of about 10% since 2010. The region is overwhelmingly Christian; almost every country in the region has a Christian majority. The lone exception is Uruguay, where more than half the population is religiously unaffiliated. As in North America, Europe, and parts of the Asia-Pacific region, disaffiliation drove much of the religious change that has occurred across Latin America and the Caribbean since 2010. In many Latin American and Caribbean countries, substantial numbers of adults say they were raised as Christians but now identify with no religion. In addition, although this report does not delve into the size of Christian subgroups, other research shows that many adults in Latin America and the Caribbean have switched from Catholicism to evangelical and Pentecostal branches of Protestantism in recent decades. Religious change Based on numbers (or counts), most religious groups in the Latin America-Caribbean region grew between 2010 and 2020. People belonging to the “other religions” category are estimated to have increased in number the most rapidly (up 101%). This change is largely due to a doubling of followers of other religions in Brazil, the region’s most populous country. Throughout the region, the “other religions” category includes various Indigenous and Afro-Latin religious traditions, such as Candomblé in Brazil. The size of the region’s religiously unaffiliated population also grew considerably (up 67%), while Muslims (up 6%), Hindus (up 5%) and Christians (up 3%) grew less rapidly. Across all of Latin America and the Caribbean in 2020, Muslims, Hindus, Jews and Buddhists still numbered fewer than 1 million each. By comparison, there were approximately 547 million Christians, 77 million religiously unaffiliated people and 20 million followers of other religions. During this period, the region’s small population of Jews shrank the most (down 13%). There were fewer changes in the percentage (or share) each religious group made up of the population of Latin America and the Caribbean. Christians grew more slowly in number than most other groups from 2010 to 2020, so their share of the region’s residents fell 5 points, to 85% in 2020. The religiously unaffiliated grew 4 points (to 12%), and people in the “other religions” category increased by about 1 point, to make up 3% of the population in 2020. Other groups held fairly steady. Substantial change within countries Across Latin American and the Caribbean – as in North America and Europe – Christians and religiously unaffiliated people are the only groups whose share of the population in any single country changed substantially (by at least 5 percentage points) from 2010 to 2020. How is ‘substantial change’ defined? This section highlights countries that experienced substantial change in the size of their religious populations between 2010 and 2020. We focus on cases where a religious group’s share of a country’s population grew or shrank by at least 5 percentage points. We set that threshold because wide variations in data sources make it difficult to test the statistical significance of differences in population estimates in 2010 and 2020. Refer to the Methodology for details. The share of residents who self-identify as Christians fell substantially in eight countries, while in five of these countries, the share of religiously unaffiliated people grew substantially. Change was most pronounced in Chile, where the share of Christians in the country’s overall population shrank to 68% (down 18 points) and the religiously unaffiliated grew to 30% (up 17 points). Similarly, Christians made up 44% of Uruguay’s population in 2020 (down 16 points), while religiously unaffiliated people accounted for 52% (up 16 points), making Uruguay the only country in the region without a Christian majority. Other countries’ populations experienced smaller declines in their share of Christians and/or growth of religiously unaffiliated people. Median age of religious groups The religiously unaffiliated, with a median age of 28, are the youngest group in the Latin America-Caribbean region. This median age is much lower than among religiously unaffiliated people globally (37 years). Christians are the region’s next-youngest religious group – about half are 31 or younger. Buddhists are the oldest group in the region, with a median age of 41. Hindus (36) and people of other religions (39) fall in between. (We do not have sufficient data on the relatively small numbers of Jews and Muslims across Latin America and the Caribbean to reliably estimate their age structures.) Recommended Citation: Hackett, Conrad, Marcin Stonawski, Yunping Tong, Stephanie Kramer, Anne Shi and Dalia Fahmy. 2025. “How the Global Religious Landscape Changed From 2010 to 2020.” Pew Research Center. doi: 10.58094/fj71-ny11. source

11. Religion in Latin America and the Caribbean Read More »

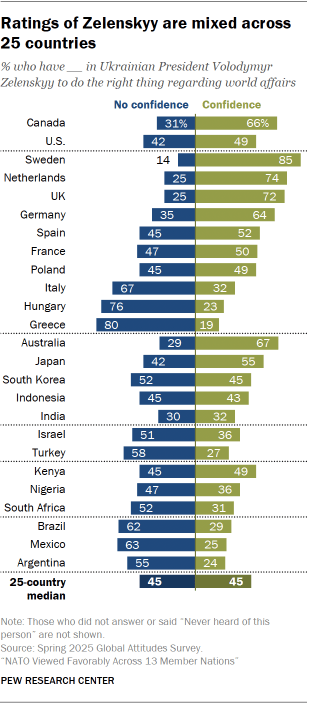
3. Views of Zelenskyy

Views of Ukrainian President Volodymyr Zelenskyy are evenly divided across the 25 countries surveyed. A median of 45% of adults in these countries say they have confidence in him to do the right thing regarding world affairs, while an identical median share lack confidence in him. Ratings of Zelenskyy are highest in Sweden, where 85% have at least some confidence. More than six-in-ten adults also give him positive ratings in Australia, Canada, Germany, the Netherlands and the UK. In Greece, Hungary and Italy, however, sizable majorities express little or no confidence in Zelenskyy, with as many as eight-in-ten in Greece taking this stance. In several countries, half or more express little to no confidence in Zelenskyy, with majorities Turkey and the Latin American countries surveyed holding this view. In the Asia-Pacific region, confidence in Zelenskyy ranges from as high as 67% in Australia to as low as 32% in India (though a near equal share of Indians say they lack confidence in him, and 38% do not offer an opinion). Views over time In five countries – Australia, France, Germany, Hungary and the Netherlands – confidence in Zelenskyy has ticked up since 2024. For example, confidence in Zelenskyy is up 10 points among Germans over the past year. By contrast, views of Zelenskyy have become more negative since 2024 in Argentina, Greece, Italy, Japan, Poland and South Korea. By ideology In several countries, there is a wide ideological gap in ratings of Zelenskyy. People who place themselves on the left are often more likely than those on the right to express confidence in the Ukrainian president. This difference is most evident in the U.S., where liberals are 44 points more likely than conservatives to say they have at least some confidence in Zelenskyy to do the right thing regarding world affairs (75% vs. 31%). By right-wing populist party support Europeans’ views of Zelenskyy are also tied to their opinions of right-wing populist parties. People with a favorable view of the right-wing populist parties in their country are less likely than those with an unfavorable view of these parties to say they have confidence in Zelenskyy. For example, in Germany, about a quarter of those who support Alternative for Germany (AfD) say they have confidence in Zelenskyy (24%). By comparison, roughly three-quarters of Germans who do not support AfD (76%) have confidence in him. In Greece and Italy, those who have a favorable view of the centrist or left-wing populist parties in their country are more likely than nonsupporters to have confidence in Zelenskyy. In Greece, around a third of those with a favorable opinion of Syriza have confidence in Zelenskyy (32%). By comparison, 17% of Greeks who do not support Syriza express confidence in him. source

3. Views of Zelenskyy Read More »