Pew Research Center

NATO Viewed Favorably Across 13 Member Nations

Flags of NATO member nations wave outside the organization’s headquarters in Brussels on March 6, 2025. (John Thys/AFP via Getty Images) How we did this This Pew Research Center analysis focuses on public opinion of NATO, Russia, Russian President Vladimir Putin and Ukrainian President Volodymyr Zelenskyy in 25 countries across the Asia-Pacific region, Europe, Latin America, the Middle East-North Africa region, North America and sub-Saharan Africa. Opinion of NATO, Russia, and both leaders are examined in the context of long-term trend data. For non-U.S. data, this analysis draws on nationally representative surveys of 28,333 adults conducted Jan. 8 to April 26, 2025. All surveys were conducted over the phone with adults in Canada, France, Germany, Greece, Hungary, Italy, Japan, the Netherlands, Poland, South Korea, Spain, Sweden and the United Kingdom. Surveys were conducted face-to-face in Argentina, Brazil, India, Indonesia, Israel, Kenya, Mexico, Nigeria, South Africa and Turkey. In Australia, we used a mixed-mode probability-based online panel. In the United States, we surveyed 3,605 U.S. adults from March 24 to March 30, 2025. Everyone who took part in this survey is a member of the Center’s American Trends Panel (ATP), a group of people recruited through national, random sampling of residential addresses who have agreed to take surveys regularly. This kind of recruitment gives nearly all U.S. adults a chance of selection. Surveys were conducted either online or by telephone with a live interviewer. The survey is weighted to be representative of the U.S. adult population by gender, race, ethnicity, partisan affiliation, education and other categories. Read more about the ATP’s methodology. We conducted simultaneous telephone and face-to-face surveys in Hungary and Poland in 2024. Data in our 2024 reports was from the face-to-face survey. The 2024 data in this report comes from the telephone survey for direct comparison to our 2025 telephone data. For this reason, 2024 data for Hungary and Poland may not match earlier reports. Here are the questions used for this analysis, along with responses, and the survey methodology. Ahead of this month’s NATO summit in the Netherlands, people in 13 surveyed member nations continue to view the alliance in a mostly favorable light. Meanwhile, roughly three years after Russia’s military invasion of Ukraine, international opinion of Russian President Vladimir Putin and the country he leads remains negative across a broader set of 25 countries. A median of 84% of adults lack confidence in Putin to do the right thing regarding world affairs, and a median of 79% have an unfavorable view of Russia. Confidence in Ukrainian President Volodymyr Zelenskyy is mixed overall, although his ratings have increased in several European nations allied with Ukraine. These findings are based on a survey of 31,938 adults in 25 countries conducted Jan. 8-April 26, 2025, before the Ukrainian drone attacks against Russia and the latest round of peace talks between the two countries. Views of NATO NATO is seen more favorably than not across most of the 13 member countries included in the survey: A median of 66% of adults have a positive view of the alliance. Opinions vary widely, however, from 81% favorability in Poland to 28% in Greece. Favorable views of NATO have declined since 2024 in a few countries, including Turkey and Greece, where the organization is historically less well-regarded than it is in other member nations. However, positive views of NATO are up since last year in Canada and Germany. Opinions of NATO are divided along ideological lines. In four member nations surveyed – Canada, Hungary, the United Kingdom and the United States – people who place themselves on the ideological left are more likely than those on the right to see NATO favorably. In Greece and Sweden, by contrast, the organization gets higher ratings from the right than the left. Views of Putin and Russia Confidence in Putin Across the broader set of 25 countries, few people express confidence in Putin’s leadership on the world stage. A median of 15% have confidence in him to do the right thing regarding world affairs, while a median of 84% do not. Confidence in Putin has remained low since Russia’s February 2022 invasion of Ukraine. But views of Putin have become more favorable in a handful of countries since 2024. Confidence in the Russian president is up in Greece, Hungary, Italy, Mexico, Turkey and the U.S. In the U.S., this movement has come largely among Republicans and Republican-leaning independents. Still, only 17% of Republicans have confidence in Putin. Related: Republican Opinion Shifts on Russia-Ukraine War People who place themselves on the ideological right have become more confident in Putin in six countries since last year: Nigeria (+15 percentage points), Italy (+13), Mexico (+11), Hungary (+10), Brazil (+9), and the U.S. (+6). In many countries, confidence in Putin is related to confidence in U.S. President Donald Trump. In Australia, Canada and most of the European countries surveyed, people who have confidence in Trump are also more likely to have confidence in Putin. Favorability of Russia Russia continues to be seen in a mostly negative light by people in the 25 countries surveyed. A median of 19% have a favorable view of Russia, while a median of 79% have an unfavorable view. In two countries – India and Indonesia – views of Russia are more favorable than not. And in Nigeria and Mexico, opinions are mixed. While overall favorability of Russia remains low, an increasing share of the public in fivecountries – Greece, Hungary, Italy and Turkey – have a positive view of the country. Greeks and Italians, for example, are 10 points more likely to have a favorable opinion of Russia this year than in 2024. And in Hungary and Italy, views have become especially more positive among people on the ideological right and those who support their nation’s right-wing populist parties. People across most of the countries surveyed see the U.S. more favorably than Russia, even as positive opinion of the U.S. has dropped over the past year. However, adults in Indonesia, Mexico and Turkey express

NATO Viewed Favorably Across 13 Member Nations Read More »

Americans Have Mixed to Negative Views of Trump Administration Immigration Actions

Press secretary Karoline Leavitt holds the White House daily briefing accompanied by Trump border czar Tom Homan on April 28, 2025. (Jim Watson/AFP via Getty Images) How we did this Pew Research Center conducted this study to understand Americans’ views of immigration policy in the U.S. For this analysis, we surveyed 5,044 adults from June 2 to 8, 2025. Everyone who took part in this survey is a member of the Center’s American Trends Panel (ATP), a group of people recruited through national, random sampling of residential addresses who have agreed to take surveys regularly. This kind of recruitment gives nearly all U.S. adults a chance of selection. Interviews were conducted either online or by telephone with a live interviewer. The survey is weighted to be representative of the U.S. adult population by gender, race, ethnicity, partisan affiliation, education, presidential vote (among voters) and other factors. Read more about the ATP’s methodology. Here are the questions used for this report, the topline and the survey methodology. As the Trump administration has stepped up immigration enforcement around the country, Americans offer mixed to negative views of some of its most high-profile actions. For example, public opinion is split over the use of state and local law enforcement in deportation efforts (50% approve, 49% disapprove) and offering money and travel funds to immigrants in the U.S. illegally if they leave voluntarily (49% approve, 50% disapprove). But several other actions are far less popular: 60% of Americans disapprove of the suspension of most asylum applications (39% approve). 59% disapprove of ending Temporary Protected Status (TPS) for many immigrants who came to the United States escaping war or other disasters at home (39% approve). 54% disapprove of increasing Immigration and Customs Enforcement (ICE) raids on workplaces where people who are in the U.S. illegally may be working (45% approve). A new Pew Research Center survey of 5,044 U.S. adults, conducted June 2-8, 2025, finds the Trump administration’s overall approach to immigration is viewed more negatively than positively, with 42% approving and 47% disapproving. But these evaluations – and views of specific policies – largely split along partisan lines, with Republicans broadly supportive and Democrats opposed. 78% of Republicans and Republican-leaning independents approve of the administration’s approach to immigration, including 51% who strongly approve. Just 12% disapprove. In contrast, 81% of Democrats and Democratic leaners disapprove, with 63% strongly disapproving. Just 9% approve. (Note: Most of the survey was conducted before recent high-profile protests in Los Angeles and other cities against ICE raids on workplaces and the deployment of Marines and National Guard troops to Los Angeles by the Trump administration.) Similarly, while about six-in-ten or more Republicans approve of each of the Trump administration immigration actions asked about on the survey, no more than a quarter of Democrats approve of most of these actions. (The sole exception is the 41% of Democrats who approve of offering money and travel funds to immigrants in the country illegally if they voluntarily leave the country.) Read Chapter 2 for more on approval of Trump administration immigration actions and policies, including views among partisans and demographic groups. How will the Trump administration’s immigration actions impact the country? Asked to assess the economic impact of the Trump administration’s policies, Americans are more likely to say they expect the policies will cost taxpayers money (53%) rather than save taxpayers money (29%). And more say these policies will make the U.S. economy weaker (46%) rather than stronger (34%). About two-in-ten (19%) say they won’t have much impact on the economy. However, by about two-to-one, Americans expect the policies to result in less crime (41%) rather than more crime (20%). Nearly four-in-ten (37%) say they will have little impact on crime in the U.S. Half of Americans say the administration’s approach to deporting immigrants who are living in the U.S. illegally is “too careless.” About four-in-ten (39%) say the administration’s approach has been about right, while 9% say it’s been too careful. Read Chapter 2 for more on the public’s views of how the administration’s immigration policies will impact the country. How should the country handle undocumented immigrants now living in the U.S.? As has long been the case, the majority of Americans (65% today) say that there should be a way for undocumented immigrants to stay in the country legally, with 36% saying these immigrants should be eligible for citizenship if they meet certain requirements. About a third of Americans (34%) say undocumented immigrants should not be allowed to stay legally, with nearly all of this group saying that there should be a national law enforcement effort to deport them (31% of Americans overall). There are wide partisan divisions in these views, and these divides are wider today than they were a few years ago: Today, 41% of Republicans and 89% of Democrats say there should be a way for undocumented immigrants to stay in the U.S. legally. In 2017, 61% of Republicans said this, as did 88% of Democrats. The share of Republicans saying there should be a national effort to deport those in the country illegally has grown substantially over the last eight years – 56% say this today, up from 34% in 2017. Republicans and Democrats have different views about what is acceptable when it comes to federal deportation efforts: 55% of Republicans say it would be acceptable to deport immigrants to a different country if they cannot return to their home country. By comparison, 13% of Democrats say this would be acceptable. When it comes to working with federal deportation efforts: 73% of Democrats, compared with 41% of Republicans, say it would be acceptable for a church or religious organization to not help with federal efforts to deport people in their communities who are in the U.S. illegally. 66% of Democrats and 19% of Republicans say it would be acceptable for a city or state to not help federal deportation efforts. Read Chapter 1 for more on Americans’ views about policies regarding undocumented immigrants currently living

Americans Have Mixed to Negative Views of Trump Administration Immigration Actions Read More »

News Media Tracker Frequently Asked Questions

The News Media Tracker shows data on Americans’ awareness of, use of and trust in 30 different major news sources. It’s based on a nationally representative survey of U.S. adults conducted in March 2025. If you have any questions, please reach out to [email protected]. Why build a News Media Tracker? As the news media landscape continues to evolve, Americans’ news habits are changing. This tool is meant to be a digital product that provides the public with up-to-date, easily accessible key information about what news sources Americans turn to and trust. In the News Media Tracker, we take a snapshot of the news sources people have heard of, use and trust for news. We examine responses based on age and party identification to map out what the media ecosystem looks like for each of these groups. How did you choose these news sources? We limited ourselves to 30 news sources in this survey to avoid placing undue burden on survey respondents, who may have trouble processing an even longer list. We used a variety of criteria to make difficult decisions about which sources to include among the 30. Knowing that no list of 30 sources could represent the entire media landscape, we included many prominent news sources, while also aiming to capture the diversity of the media environment and sources in emerging platforms. To this end, we took into consideration things like web traffic, TV ratings and the results of previous surveys, including open-ended questions asking about political and election news in September 2024, news influencers in August 2024, and popular podcasts in December 2022. We also set out to ask about a range of news sources across different platforms (e.g., internet, television, print, radio, and new media like podcasts and social media). Relatedly, we wanted to capture different elements of the information environment, such as legacy news outlets and newer, nontraditional news sources. The sources include:   News divisions of three major broadcast commercial television networks (ABC News, CBS News, NBC News)  Three major cable TV news networks (CNN, Fox News Channel and MSNBC)  Two major Spanish-language TV networks (Univision, Telemundo)  Two major public broadcast radio or TV networks (NPR and PBS)  Four of the largest newspapers by U.S. national circulation, according to a Pew Research Center analysis of Alliance for Audited Media data for the third quarter of 2024 (The New York Times, The Washington Post, The Wall Street Journal and the New York Post)  Four outlets named by at least 0.5% of respondents in a 2024 open-ended question asking about respondents’ main source for election news (Newsmax, BBC News, The Daily Wire, The Associated Press)  One outlet named in the 2024 election main source open end that also was recently given office space at the Pentagon (Breitbart)  The most-named podcast in a 2022 open end asking about the primary podcast Americans listen to the most (The Joe Rogan Experience)  One source named in a 2024 survey asking about what news influencer first comes to mind for Americans who regularly get news from news influencers, who also has comparatively high social media follower counts (Tucker Carlson Network)  Seven news websites, regardless of their original platform, that primarily cover general or political news and had comparatively high numbers of U.S. unique visitors during the second and third quarters of 2024, according to Comscore Media Metrix® Multi-Platform data (USA Today, HuffPost, Newsweek, Politico, The Hill, The Atlantic and Axios)  One international news website with the highest number of U.S. unique visitors during the second and third quarters of 2024, according to Comscore (The Guardian)  One business news website with the highest number of U.S. unique visitors during the second and third quarters of 2024, according to Comscore (Forbes)  Why does the study include more outlets with left-leaning audiences than right-leaning audiences? We selected these outlets based on a number of factors, including their audience size and platform type, but not based on the party affiliation (or lean) or ideology of their audiences, which we didn’t measure until later in the research process. One factor that may be at play here is that Republican news consumers have a more compact media ecosystem. They rely to a large degree on a small number of outlets and view many established brands as not trustworthy. Democrats, on the other hand, rely on a wider number of outlets. Why are some circles bigger than others? Across the News Media Tracker, dots are sized based on how many people have heard of a source, not how many people actually get their news there. Take the New York Post: 78% of U.S. adults have heard of it, so even though a small portion of U.S. adults (9%) regularly get news there, the dot is fairly large. How did you plot trust and distrust of each news source? Some graphics in the news media tracker visualizing trust and distrust in each news source used a trust ratio. First, respondents were shown a list of the 30 outlets and asked if they had heard of each source. Of those they had heard of, they were asked whether they generally trusted each as a source of news. If they didn’t trust that source for news, they were asked if they generally distrusted it for news. Then, we calculated a trust ratio for each source. If the share of respondents who said they trusted the news source was greater than the share who said they distrusted the source, the ratio was calculated as trust divided by distrust. If the share who said they distrusted the source was greater than the share who trusted the source, the ratio was calculated as a negative distrust value divided by the trust value. For example, the BBC and Fox News have about the same share of U.S. adults who trust them – 35% and 37%, respectively. But only 13% of Americans distrust the BBC, while 42% distrust Fox. BBC is much more trusted than distrusted, so it has a high trust ratio (2.8 times more trusted

News Media Tracker Frequently Asked Questions Read More »

4. Profile of Hispanic Catholics in the U.S.

How we define Catholics in this chapter This chapter exclusively explores views and experiences among U.S. Catholics (i.e., the 20% of U.S. adults who say they are Catholic when asked about their present religion). Many Americans who are not Catholic are still connected to the faith in other ways. Read more about these “cultural Catholics,” former Catholics, and people with other Catholic connections (i.e., those who have  a Catholic parent, spouse or partner, or say “yes” when asked if they ever attend Catholic Mass) in Chapter 7 and the Overview. The share of U.S. Catholic adults who are Hispanic is growing. Today, 36% of all Catholic adults in the United States are Hispanic, up from 29% in 2007. Hispanic Catholics are a distinctive part of American Catholic religious life in numerous ways. They are more likely than White Catholics to say they participate in a variety of Catholic devotional practices. For example, compared with White Catholics in the U.S., Hispanic Catholics are more likely to: Regularly wear or carry religious items with them (56% vs. 39%) Practice devotions to the Virgin Mary or a favorite saint (46% vs. 31%) Pray the rosary (37% vs. 22%) Regularly light candles or incense for spiritual or religious reasons (26% vs. 11%) Also, not surprisingly, Hispanic Catholics are far more likely than White Catholics to say they usually go to a Mass conducted in Spanish. The share of Catholics who say they attend Mass at least weekly is similar among Hispanic and White Catholics. But the share of Catholics who say they receive Communion at least most of the time they attend Mass is lower among Hispanic Catholics than among White Catholics. Hispanic Catholics also have a distinctive social and demographic profile. For instance, eight-in-ten Hispanic Catholics were born outside the U.S. (58%) or are the children of immigrants (22%). Most Hispanic Catholics live in the West (41%) or the South (37%). And Hispanic Catholics are more likely to say they are Democrats or lean toward the Democratic Party than to say they are Republicans or Republican leaners. By contrast, most White Catholics were born in the U.S. to U.S.-born parents, live in the Northeast or the Midwest, and are Republicans or lean Republican. (For additional information about how Hispanic Catholics compare with other U.S. Catholics with respect to age, immigration, region, party identification and education, refer to “10 facts about U.S. Catholics.”) Read on for more about Hispanic Catholics’ beliefs and practices related to: Mass attendance, Communion and confession among Hispanic Catholics About a quarter of Hispanic Catholics say they attend religious services at least once a week (26%), according to the 2023-24 U.S. Religious Landscape Study – on par with the share of White Catholics who say this. An additional 12% say they go to Mass once or twice a month, while 53% go a few times a year or “seldom.” One-in-ten Hispanic Catholics say they never go to church. Receiving Communion at Mass Compared with other Catholics, fewer Hispanic Catholics in the Feb. 3-9, 2025, survey say they receive Communion most or all of the time when they attend Mass. About a third of Hispanic Catholics say they receive Communion every time (21%) or most of the time (13%). Going to confession Hispanic Catholics are slightly more likely than White Catholics to say they go to confession at least once a year. Overall, 28% of Hispanic Catholics say they go to confession at least once a year, compared with 20% of White Catholics. Religious devotions among Hispanic Catholics Overall, 56% of Hispanic Catholics say they wear or carry religious items with them at least monthly. About half say they practice devotions to the Virgin Mary or a favorite saint at least monthly, and 37% say they pray the rosary monthly. In addition, about a quarter of Hispanic Catholics say they light candles or incense for religious or spiritual reasons at least once a month. Hispanic Catholics report doing all these things at higher rates than White Catholics do. When it comes to reading the Bible, 26% of Hispanic Catholics say they do this at least monthly, and 21% of White Catholics say the same. Essentials of Catholic identity among Hispanics To explore what “being Catholic” means to U.S. Catholics, the survey gave respondents a list of items and asked them to say whether each is an “essential,” an “important but not essential,” or “not an important” part of what being Catholic means to them. Respondents could say that more than one item is essential, and they also could indicate that none of the items is essential. Compared with White Catholics, Hispanic Catholics were more likely to cite many of the items as essential to their Catholic identity. For example, the share of Hispanics who say “having a personal relationship with Jesus Christ” is essential to what being Catholic means to them is 11 percentage points higher than among White Catholics (76% vs. 65%). And the share of Hispanics who say “devotion to the Virgin Mary” is essential to their Catholic faith is 21 points higher than among White Catholics (63% vs. 42%). Hispanic Catholics also are far more inclined than White Catholics to say that essential elements of their Catholic identity include caring for immigrants (47% vs. 20%), taking care of the environment (43% vs. 24%), celebrating feast days that are part of their national or ethnic heritage (36% vs. 20%), going on pilgrimages (18% vs. 2%), working to help the poor and needy (55% vs. 41%), and opposing the death penalty (30% vs. 16%). For more on what U.S. Catholics (of all races and ethnicities) say being Catholic means to them, and for breaks by Mass attendance and political party, refer to Chapter 1 of this report. Mass in Spanish Roughly four-in-ten Hispanic Catholics say that when they go to Mass, they usually go to one said in Spanish. About a quarter say they typically go to English Masses, and 23% say they sometimes go to English Masses and

4. Profile of Hispanic Catholics in the U.S. Read More »

8. Jewish population change

Jews are the smallest religious group analyzed separately in this report, accounting for 0.2% of the global population. Most Jews live either in North America (primarily in the United States) or in the Middle East-North Africa region (almost exclusively in Israel). Jews make up less than 2% of the overall population in each of those regions. Challenges of measuring Jewish identity Estimating the size of the world’s Jewish population is complicated. Data sources variously measure Jewish religious identity, ethnic identity, or a mix of the two. The number of Jews around the world depends largely on one’s definition of Jewishness. For consistency with other religious groups around the world, we rely, when possible, on censuses and surveys that measure religious affiliation with Judaism. Due to data limitations, in some countries, we use sources that employ a slightly different approach to measuring Jewish identity: Israeli government counts. Our estimate of the number of Jews living in Israel comes from the Ministry of Interior’s population register that counts as Jews only those who meet halakhic (religious) legal criteria – i.e., children of Jewish mothers as well as people who have undergone formal conversions. Many people who do not meet these criteria are still eligible to make aliyah and become Israeli citizens based on other ties to Judaism, but they are classified as non-Jews by the government regardless of their personal religious identity. Consequently, the register data we rely on to make estimates of the number of Jews in Israel may count some people as Jewish based on halakhic criteria even if they do not self-identity as Jewish by religion. At the same time, some people who identify religiously as Jewish are not classified as Jewish by the government based on halakhic criteria. “Core Jewish population” estimates from Sergio DellaPergola’s World Jewish Population dataset. DellaPergola, a leading expert on the demography of global Jewry, has made estimates of Jewish populations using Jewish community records and surveys as well as national census and survey data on religion and ethnicity. His “core Jewish population” numbers are designed to include people who identity as Jewish by religion, as well as people who do not identity with any religion but nonetheless identify otherwise as Jewish. In the United States, the definition of Jewishness used in this report – based on self-identification with Judaism as a religion – results in a much smaller estimate of the number of Jewish Americans than Pew Research Center has previously provided using a broader definition. In our 2013 and 2020 surveys of Jewish Americans, we counted respondents as Jewish if they said either that Judaism is their religion or that they consider themselves Jewish aside from religion (for reasons such as ethnicity, culture or family background); have at least one Jewish parent or were raised Jewish; and don’t belong to any other religion. Using that broader definition, there were an estimated 7.5 million Jews of all ages in the U.S. in 2020, about 1.8 million more than this report’s estimate of the number of Americans who identify religiously as Jewish (5.7 million). Another challenge in measuring Jewish populations is that Jews are minorities in countries outside Israel, and their populations are often too small to measure reliably with surveys. (Jews account for less than 0.01% of the population in most of the world’s countries and territories.) Furthermore, in some national censuses that measure religion, “Jewish” is not a response option. DellaPergola, whose estimates we chose as the best source of Jewish numbers in many countries, has described estimates of Jewish populations as “permanently provisional” in nature. Global change The number of Jews around the world grew by 6%, from an estimated 14 million in 2010 to nearly 15 million in 2020. That’s fewer than the estimated 16.6 million Jews who were alive in 1939, prior to the Holocaust. Our estimates for Israel are based on the Ministry of Interior’s population register of Jews in Israel. Outside of Israel, we generally use a definition of Jewishness based on self-identification with Judaism as a religion. During this time, the rest of the world’s population grew about twice as quickly. Despite this gap, the share of the global population that is Jewish still rounds to 0.2%. Regional change Jews grew in number in three regions and declined in three others. In the Middle East-North Africa region, Jews grew to a population of almost 7 million (up 18%). The number of Jewish residents also increased slightly in the Asia-Pacific region (up 2%) and North America (up 1%). The Jewish population of sub-Saharan Africa, already small in 2010, shrank to 50,000 individuals (down 37%). Jews also declined in the Latin America-Caribbean region to 390,000 (down 12%). In Europe, the Jewish population fell to 1.3 million (down 8%). Jewish shares of regional populations held fairly steady, including a small decline of about 0.1 point in North America. Regional distribution of Jews Jews are heavily concentrated in the Middle East-North Africa area and in North America, with the vast majority of Jews (87%) living in one of these two regions. Between 2010 and 2020, the Middle East and North Africa surpassed North America to become the geographic region with the largest Jewish population. This is primarily because Israel added over 1 million Jews to its population between 2010 and 2020, compared with an increase of just 30,000 in the U.S. As a result, the share of the world’s Jews who live in the Middle East-North Africa region increased to 46% (up 4 points), while the share who live in North America fell to 41% (down 2 points). The Middle East and North Africa was the only region that saw an increase in its share of the global Jewish population between 2010 and 2020. Countries with the highest Jewish counts Israel and the United States are the only countries with millions of Jewish residents; 85% of Jews worldwide live in one of these two countries. Nearly half of all Jews live in Israel, which has a 77% Jewish majority and is

8. Jewish population change Read More »

5. Profile of U.S. converts to Catholicism

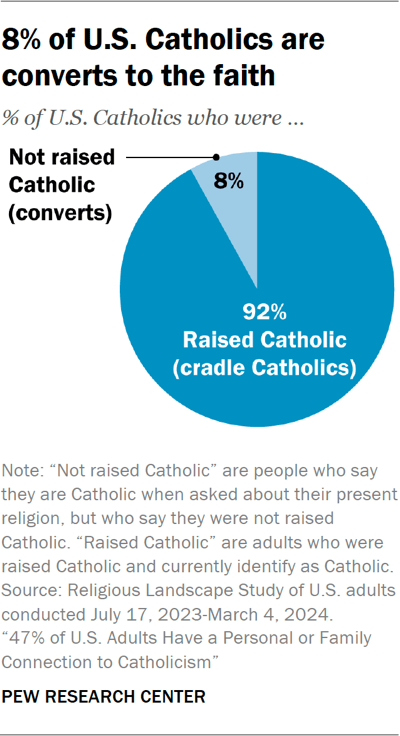
How we define Catholics in this chapter This chapter exclusively explores views and experiences among U.S. Catholics (i.e., the 20% of U.S. adults who say they are Catholic when asked about their present religion). Many Americans who are not Catholic are still connected to the faith in other ways. Read more about these “cultural Catholics,” former Catholics, and people with other Catholic connections (i.e., those who have  a Catholic parent, spouse or partner, or say “yes” when asked if they ever attend Catholic Mass) in Chapter 7 and the Overview. In the U.S., 92% of Catholics are “cradle Catholics” – people who say they were raised Catholic and also say they are Catholic when asked about their religion today. The remaining 8% are converts to Catholicism – people who say their religion is Catholicism today but that they were not brought up Catholic. Overall, 1.5% of all U.S. adults are converts to Catholicism. On average, converts to the faith attend Mass weekly at somewhat higher rates than cradle Catholics. Higher shares of converts than cradle Catholics also say they receive Communion every time they attend Mass. But the percentages of Catholics who say they pray daily and go to confession at least once a year are similar among converts and cradle Catholics. And the share of converts who say they have attended a Traditional Latin Mass in the last five years is not much different from the share of cradle Catholics who say this (18% and 13%, respectively). Politically, converts are somewhat more Republican than cradle Catholics and are about as likely to describe themselves as conservatives, ideologically. When asked why they became Catholic, the most common response offered by converts is because of a spouse, or to get married in the church. Others say becoming Catholic aligned with their values or that Catholicism made sense to them. The rest of this chapter looks at deeper comparisons of Catholic converts with cradle Catholics. Our analysis includes results from both the 2023-24 Religious Landscape Study (RLS) and Pew Research Center’s survey of Catholics conducted Feb. 3-9, 2025. The RLS has a larger sample size than the 2025 survey, and so on questions where we have data from both, we use the RLS. That said, the 2025 survey includes a number of questions about Catholicism that were not asked as part of the RLS. Converts to Catholicism represent a small group in the broader U.S. public (1.5% of U.S. adults), and so both the RLS and the 2025 survey have relatively modest samples of members of this group. The RLS includes 662 interviews with converts to Catholicism, and results based on this group have a margin of error of plus or minus 5.5 percentage points. The 2025 survey of Catholics includes 148 interviews with converts to Catholicism, and results based on this group have a margin of error of plus or minus 10.1 percentage points. Read about the following on Catholic converts: Religious practices among converts to Catholicism About four-in-ten converts to Catholicism (38%) say they attend Mass at least once a week, which is somewhat higher than the share of cradle Catholics who say this (28%).  Converts also are more likely than cradle Catholics to say they receive Communion every time they go to Mass (58% vs. 34%). However, the shares of converts and cradle Catholics who say they pray every day are similar. (The gap between the 56% of converts who say this and the 51% of cradle Catholics is not statistically significant.) And there is little evidence that attending the Traditional Latin Mass (TLM) is more common among converts than among cradle Catholics. Among converts, 18% say they have attended a TLM at least once in the last five years, which is similar to the 13% of cradle Catholics who say the same. (The difference is not statistically significant.) Large majorities of both groups say they have not been to a TLM in the last five years. Converts and cradle Catholics also report going to confession at similar rates. Large majorities in both groups say they go to confession less than once a year or not at all. Demographics of converts to Catholicism Roughly two-thirds of converts to Catholicism in the United States are White (67%) and 20% are Hispanic. By comparison, the population of cradle Catholics in the U.S. includes a smaller share of White people (53%) and more Hispanics (37%). About six-in-ten converts to Catholicism were raised as Protestants (59%), while 22% were raised with no religion. The remainder were raised in other religions or declined to answer the question about their childhood religion. Politics of converts to Catholicism Among Catholic registered voters, converts to Catholicism are a bit more likely than “cradle Catholics” to describe themselves as Republicans or to lean toward the Republican Party (60% vs. 52%) There is little difference between the share of Catholic converts and cradle Catholics who describe their political views as conservative. (The difference between the 41% of converts who are conservative and the 36% of cradle Catholics is not statistically significant.) Why converts joined the church To better understand why they joined the Catholic Church, Catholic converts were asked an open-ended question: “Just in your own words, what is the main reason you became Catholic?” By far the most common response was that the decision was driven by their spouse or partner being Catholic. Nearly half of responses (49%) referenced this as a reason, saying things like, “married into a Catholic family” or “I married a Catholic and became Catholic after that time.” Other common responses converts give for having joined the church include: Coming to believe in church teachings or in the church’s historical foundation (13%) Feeling called to Catholicism, or finding it spiritually fulfilling (12%) The influence of relatives and friends (12%) source

5. Profile of U.S. converts to Catholicism Read More »

7. Catholic connections

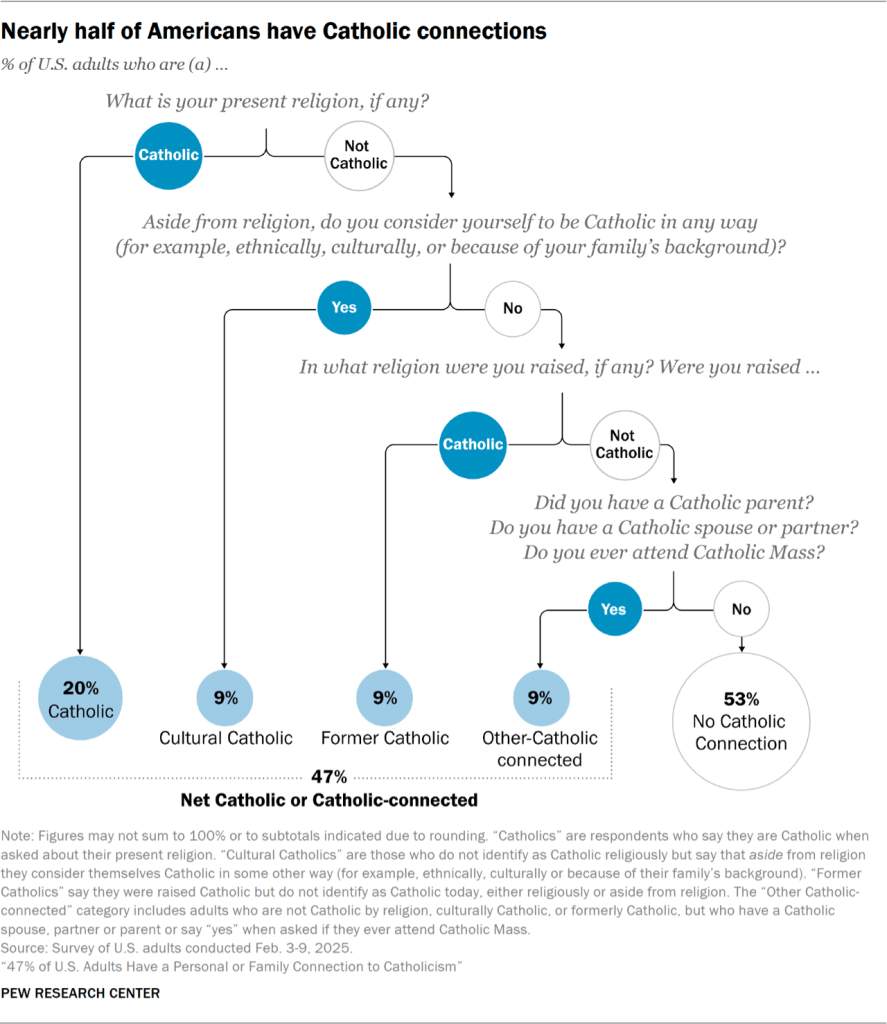
Terminology Throughout this report, when we use the term Catholic we are referring to U.S. adults who say they are Catholic when asked about their religion. We use the following terms when referring to people who are not Catholic by religion, but are connected to the faith in other ways: Cultural Catholics say they consider themselves Catholic “aside from religion” (e.g., ethnically, culturally, or because of their family background). Former Catholics were raised in the faith tradition but no longer identify as Catholic, religiously or culturally. People who are connected to Catholicism in other ways are not Catholic by religion or culture, nor are they former Catholics. But they report having a Catholic parent, spouse or partner, or say yes when asked if they ever attend Mass. In the United States, there are almost as many “cultural Catholics” and former Catholics, combined, as there are people who identify religiously as Catholic. In our Feb. 3-9, 2025, survey, 20% of U.S. adults are Catholic by religion, meaning they say they are Catholic when asked about their religion. Throughout this report, we refer to this group simply as “Catholic.” Meanwhile, 18% of U.S. adults are not Catholics by religion, but they are either cultural Catholics (9%) or former Catholics (9%). By “cultural Catholics,” we mean people who say in the survey that they are Catholic “aside from religion,” for example, ethnically, culturally, or because of their family background, but who do not say they are Catholic when asked directly about their religion. We define “former Catholics” as people who were raised Catholic but who don’t identify as Catholic today, either religiously or “aside from religion.” Additionally, another 9% of U.S. adults are connected to Catholicism in other ways. These are people who don’t fit into the Catholic, cultural Catholic or former Catholic categories, but who have a Catholic parent, spouse or partner, or say “yes” when asked whether they ever attend Catholic Mass. About half of both cultural Catholics and former Catholics are religious “nones,” meaning they describe themselves as atheist, agnostic or “nothing in particular” when asked about their present religion. The remainder of people in these groups identify with a religion other than Catholicism (mostly with other Christian groups). The rest of this chapter provides more information about: Cultural Catholics and former Catholics Today, 53% of “cultural Catholics” identify with religions other than Catholicism, including 47% who are part of other Christian traditions and 7% who identify with non-Christian religions. The remainder of cultural Catholics (47%) are religiously unaffiliated. Looking at former Catholics, 46% identify with religions other than Catholicism, including 37% who are in other Christian traditions and 8% who identify with other (non-Christian) religions. About half of former Catholics (54%) are religiously unaffiliated. How they were raised Among cultural Catholics, 44% say they were raised Catholic, while 37% were raised in other Christian traditions and 16% were raised religiously unaffiliated. By definition, 100% of former Catholics were raised Catholic. Their religious practices today The vast majorities of cultural Catholics and former Catholics are not involved in Catholic practices today. Indeed, 83% of cultural Catholics and 96% of former Catholics say they seldom or never attend Catholic Mass. Eight-in-ten cultural Catholics and 94% of former Catholics say they seldom or never pray the rosary or participate in devotions to Mary or other saints. Furthermore, 82% of former Catholics say it would be “not too important” or “not at all important” to them to receive the anointing of the sick if they were seriously ill. This figure is somewhat lower among cultural Catholics (54%). Among cultural Catholics, 8% say receiving the anointing of the sick would be “extremely” or “very” important to them, while 18% say it would be “somewhat” important and 19% say they are not sure. Why do cultural Catholics say they identify as Catholic ‘aside from religion’? The survey asked cultural Catholics to describe, in their own words, in what way they consider themselves Catholic. The most common type of response describes having some sort of Catholic background (32%), such as having been raised Catholic, having cultural or ethnic ties to Catholicism, or having attended Catholic school. Many cultural Catholics also describe relationships with Catholics (27%) as contributing to why they consider themselves Catholics. For instance, these respondents point to having Catholic parents, extended family members, friends or spouses. Additionally, 23% of cultural Catholics mention beliefs that connect them to Catholicism, such as belief in God or elements of Catholic teaching. And 12% mention practices related to Catholicism, such as celebrating holidays, attending Mass or prayer. The survey also asked cultural Catholics whether each of a series of beliefs, practices and other traits are “essential” to what being Catholic means to them, “important but not essential,” or “not an important part” of what being Catholic means to them. Overall, 44% say having a personal relationship with Jesus Christ is essential to what being Catholic means to them, and 41% say the same about “working to help the poor and needy.” Roughly three-in-ten (28%) say caring for immigrants is “essential” to their Catholic identity, and an identical share mention “taking care of the environment.” Compared with Catholics by religion, smaller shares of cultural Catholics say most of the items asked about in the survey are essential to what being Catholic means to them. (For a description of how people who identify religiously as Catholic answered this question, jump to Chapter 1.) Other Catholic connections Overall, the survey finds that 9% of U.S. adults are connected to Catholicism in ways other than being Catholic by religion, culturally Catholic, or formerly Catholic. To put it another way, people in this group do not fit into any of those three categories but they do have a Catholic parent, spouse or partner or they say “yes” when asked whether they ever attend Catholic Mass. More than half (57%) of the people in this group have a Catholic parent. Roughly one-third say “yes” when asked whether they ever attend Catholic Mass. And

7. Catholic connections Read More »

6. Views of sexual abuse and misconduct in the Catholic Church

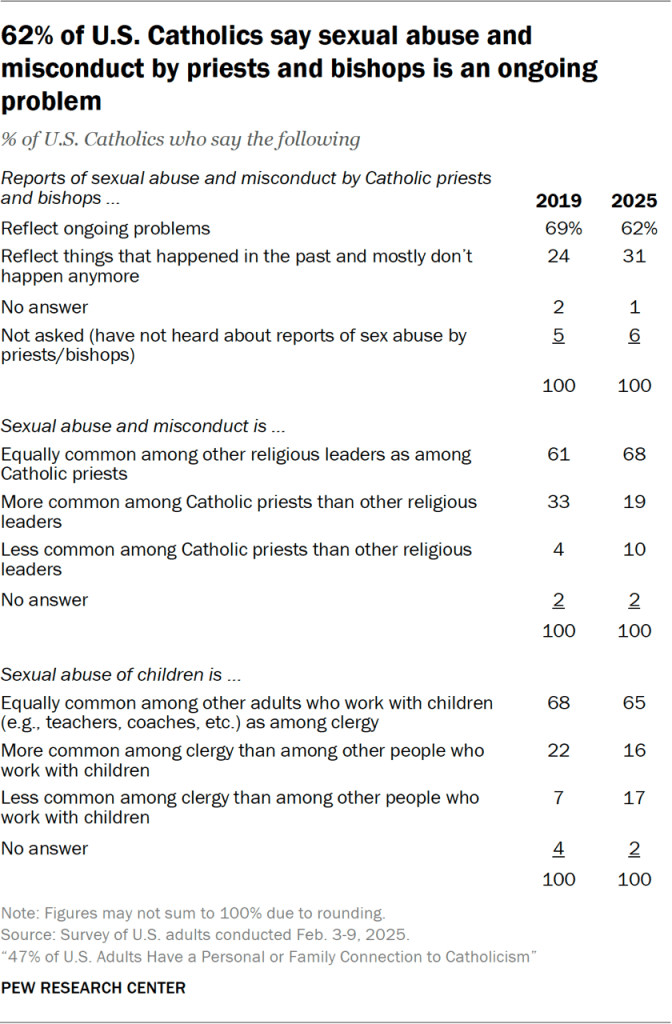
How we define Catholics in this chapter This chapter exclusively explores views and experiences among U.S. Catholics (i.e., the 20% of U.S. adults who say they are Catholic when asked about their present religion). Many Americans who are not Catholic are still connected to the faith in other ways. Read more about these “cultural Catholics,” former Catholics, and people with other Catholic connections (i.e., those who have  a Catholic parent, spouse or partner, or say “yes” when asked if they ever attend Catholic Mass) in Chapter 7 and the Overview. More than two decades after the clergy sex abuse scandal gained national attention in 2002, most U.S. Catholics think sexual abuse and misconduct by Catholic priests and bishops is an ongoing problem in the church. In our February 2025 survey, 62% of U.S. Catholics say clergy sex abuse is an ongoing problem, while 31% say these reports “reflect things that happened in the past and mostly don’t happen anymore.” While most view it as an ongoing problem, most also think the problem is not unique to Catholic clergy. Indeed, about two-thirds of Catholics surveyed (68%) say sexual abuse and misconduct is equally as common among other religious leaders as it is among Catholic priests and bishops. Far fewer (19%) think it is more of a problem among Catholic clergy than among other religious leaders. Since 2019, the share of Catholics who say they think sexual misconduct by clergy is an ongoing problem has declined from 69% to 62%. And the share who say they think clergy misconduct in other religions is equally as common as in the Catholic Church has increased from 61% to 68%. Read on for more about Catholics’ attitudes toward sexual abuse and misconduct in the church, including: How much Catholics have heard about clergy sexual abuse and misconduct The vast majority of Catholics (94%) have heard at least a little about sexual abuse and misconduct by Catholic priests and bishops. This includes 57% who say they have heard a lot about the topic and 37% who say they have heard a little about it. Among U.S. adults as a whole, 93% say they have heard about sexual abuse and misconduct by Catholic clergy, including 55% who have heard a lot about this. Views on whether clergy sexual abuse is an ongoing problem About six-in-ten Catholics say that sexual abuse and misconduct by Catholic priests and bishops is an ongoing problem, while roughly three-in-ten say this is something that happened in the past and mostly doesn’t happen anymore. Among Catholics who attend Mass weekly, 51% say sexual abuse and misconduct by priests and bishops is an ongoing problem, while 44% say it is something that happened in the past. By contrast, 70% 0f Catholics who attend Mass a few times a year or less often say the problem is ongoing. (Catholics who say they attend Mass once or twice a month are more likely than other Catholics to say they haven’t heard anything at all about the issue; the survey did not ask respondents who said they were unaware of the issue whether they think it is ongoing.) Views on whether sexual abuse and misconduct among Catholic clergy is unique Most Catholics (68%) say that sexual abuse and misconduct by leaders is equally as common among other religious groups as in the Catholic Church. A similar share (65%) say this kind of abuse is just as common among other people who work with children (like teachers and coaches) as it is among religious leaders. Catholics who attend Mass at least weekly are a bit more inclined than Catholics who attend a few times a year or less often to say they think sexual abuse of children is rarer among religious leaders than among other people who work with children. Still, majorities of Catholics at every level of Mass attendance say they think sexual abuse is equally common in the Catholic Church as in other religions, and equally common among clergy as among lay people who work with children. source

6. Views of sexual abuse and misconduct in the Catholic Church Read More »

3. Catholic parish life, culture and community

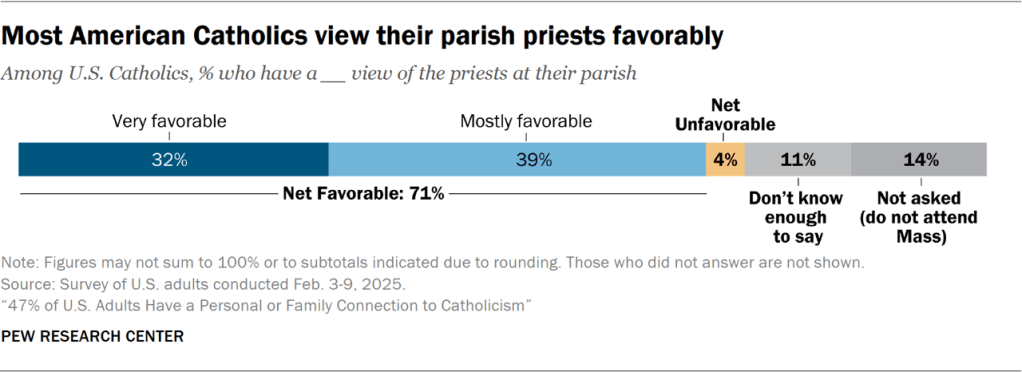
How we define Catholics in this chapter This chapter exclusively explores views and experiences among U.S. Catholics (i.e., the 20% of U.S. adults who say they are Catholic when asked about their present religion). Many Americans who are not Catholic are still connected to the faith in other ways. Read more about these “cultural Catholics,” former Catholics, and people with other Catholic connections (i.e., those who have  a Catholic parent, spouse or partner, or say “yes” when asked if they ever attend Catholic Mass) in Chapter 7 and the Overview. The survey asked Catholics about various aspects of their parish and experiences at their church. About seven-in-ten Catholics (71%) express favorable views of their parish priests, including 32% who express a very favorable opinion of their priests and 39% who express a mostly favorable view. Just 4% of U.S. Catholics say they have an unfavorable impression of their parish priests. When asked to describe the atmosphere at their parish, half of U.S. Catholics say their church is formal and traditional, while 35% say it is casual and contemporary. Roughly half of U.S. Catholics (54%) say that when they go to Mass, they are surrounded by people who mostly share their race or ethnicity. The vast majority of White Catholics say they typically go to a Mass conducted in English, while most Hispanic Catholics say they go to a Mass in Spanish at least some of the time. Overall, about one-fifth of U.S. Catholics say they are involved in their parish in some way in addition to attending Mass. This includes 14% who say they volunteer at their parish, and 16% who say they participate at least yearly in parish activities outside of Mass. Read on for more information about: Catholics’ views of their parish priests Overall, 71% of all U.S. Catholics (including 82% who ever attend Mass) say they have a positive view of their parish’s priest or priests. This figure rises to 95% among Catholics who attend Mass at least once a week. Just 3% of weekly Mass-attending Catholics say they have an unfavorable view of their parish priests. To put these numbers in some perspective, the survey also found that 80% of weekly Mass-attending Catholics had a favorable view of Pope Francis, while 18% viewed him unfavorably. (The survey was conducted Feb. 3-9, 2025, prior to Francis’ most recent hospitalization and death.) Race, language and where Catholics go to Mass Most Catholics who ever attend Mass say they typically go to their local parish (68%), while 10% say they mostly go somewhere other than their local parish. Two-in-ten say they do some of both.  Racial, ethnic composition of Catholic parishes When asked to describe the racial and ethnic composition of the parish they attend, 58% of White Catholics say most other people at the Masses they attend are also White. And 55% of Hispanic Catholics say that when they attend Mass, most of the other people in the pews are also Hispanic. The racial and ethnic composition of Catholic parishes also varies a lot by region. Nearly two-thirds of Catholics in the Midwest (64%) and 52% of Catholics in the Northeast say most of their fellow parishioners at Mass are White. By comparison, just 33% of Catholics in the South and 14% of those in the West say, when they go to Mass, most of the people there are White. Languages spoken at Mass The survey also finds that most Hispanic Catholics usually (38%) or sometimes (23%) go to Mass in Spanish. Attending Spanish Masses is more common in the West and South than among Catholics in the Northeast and Midwest. This reflects regional patterns in the racial and ethnic composition of U.S. Catholics. Hispanics account for 45% of Catholics in the South and 58% of Catholics in the West, but they make up just 20% of the Catholic population in the Northeast and 15% of the Catholic population in the Midwest. Involvement in Catholic parishes Overall, 14% of Catholics say they volunteer at their parish, such as by serving as an usher, lector, extraordinary minister of the Eucharist, or in another capacity. And 16% say they participate in parish activities other than Mass – like Eucharistic adoration, prayer groups or community meals – at least several times a year. In total, 22% of U.S. Catholics say they do one or the other (volunteer or participate in activities other than Mass) or both at their parish. And among Catholics who attend Mass weekly, 51% say they also either volunteer at their church or participate in activities other than Mass. Parish atmosphere and growth U.S. Catholics are more likely to describe the atmosphere at their parish as formal and traditional (50%) than casual and contemporary (35%). This pattern is similar in all the regions of the country. However, there are larger regional differences on the survey’s question about whether parishes are experiencing growth or decline. The share of Catholics who say their parish is growing is higher in the South than in other regions of the country. Meanwhile, the share of Catholics in the Northeast and Midwest who say their parish is shrinking is higher than the share of Catholics who say this in the South or West. Awareness of National Eucharistic Congress, Synod on Synodality Roughly three-in-ten U.S. Catholics say they have heard at least a little about the 2024 National Eucharistic Congress, which was “the U.S. Conference of Catholic Bishops’ (USCCB) initiative to renew the Catholic Church through the Eucharist.” And 23% say they’ve heard at least a little about the church’s recent Synod on Synodality, which included events in dioceses around the world and concluded in 2024. Awareness of these recent events is higher among weekly Mass-attending Catholics than among Catholics who don’t go to Mass regularly. Still, even among Catholics who go to Mass weekly, 43% say they haven’t heard anything about the National Eucharistic Congress and 60% say they have heard nothing at all about the Synod on Synodality. source

3. Catholic parish life, culture and community Read More »

2. Catholic practices and devotions

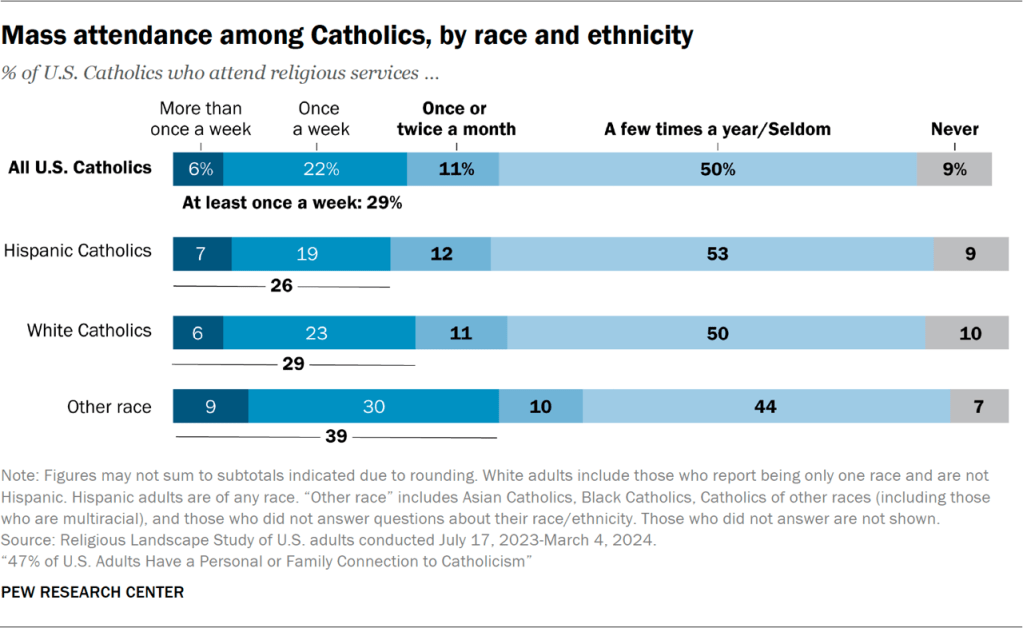
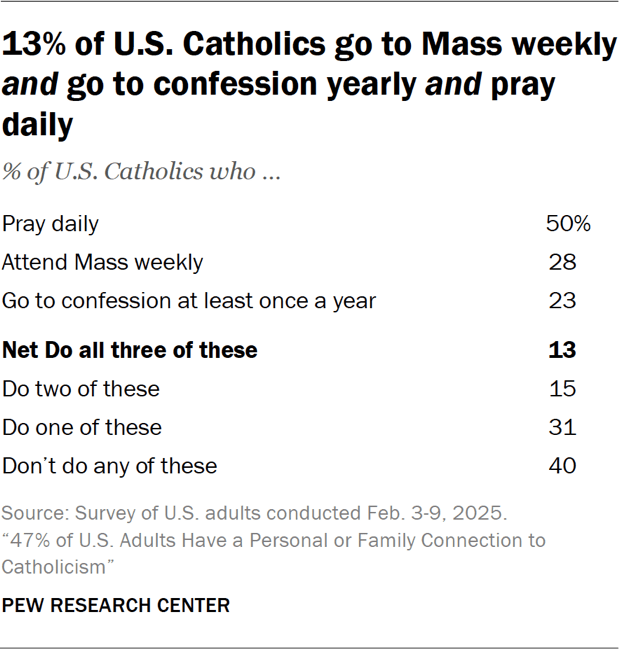
How we define Catholics in this chapter This chapter exclusively explores views and experiences among U.S. Catholics (i.e., the 20% of U.S. adults who say they are Catholic when asked about their present religion). Many Americans who are not Catholic are still connected to the faith in other ways. Read more about these “cultural Catholics,” former Catholics, and people with other Catholic connections (i.e., those who have  a Catholic parent, spouse or partner, or say “yes” when asked if they ever attend Catholic Mass) in Chapter 7 and the Overview. There is a wide spectrum of religious observance among U.S. Catholics. Some are quite devout by a variety of traditional measures: 50% of U.S. Catholic adults in our 2025 survey say they pray daily. 28% say they go to Mass weekly. 23% say they go to confession at least once a year. In total, 13% of U.S. Catholics say they engage in all three of these practices. An additional 15% say they do two of them. Meanwhile, 31% say they do just one of these things. And 40% don’t do any of them – they do not go to Mass each week, do not go to confession at least once a year, and do not pray every day. Read on for additional information about Catholic practices such as: Going to Mass and receiving Communion Overall, about three-in-ten U.S. Catholics say they go to religious services at least once a week, according to Pew Research Center’s 2023-24 U.S. Religious Landscape Study (RLS). An additional 11% say they attend Mass once or twice a month. And roughly six-in-ten U.S. Catholics say they go to Mass a few times a year or less often (50%) or not at all (9%). (For details on how rates of Mass attendance vary across subgroups based on data from the RLS, refer to the accompanying detailed tables.) The Center’s Feb. 3-9, 2025, survey finds that half of U.S. Catholics say they receive Communion every time (36%) or most of the time (15%) they attend Mass. Roughly one-in-five say they receive Communion about half the time (6%) or less than half the time (13%). An additional 16% say they never receive Communion when they go to Mass, and 14% of Catholics in the survey say they never attend Mass in the first place (and thus were not asked how often they receive Communion). Roughly eight-in-ten weekly Mass attenders receive Communion all or most of the times they go (82%). Lower shares of less frequent attenders say they receive Communion all or most of the time. Still, even among those who go to Mass a few times a year or less often, 43% say they typically receive Communion when they go. Catholics typically have the option at Mass to receive Communion either in their hand, or placed directly onto their tongue. More Catholics say they prefer to receive Communion in the hand (44%) than on the tongue (14%). An additional 11% say they have no preference. The remainder either don’t receive Communion or don’t attend Mass (and thus were not asked this question). Confession Overall, 23% of U.S. Catholics say they go to confession at least once a year, while 30% say they go less often. About half of Catholics (47%) say they never go to confession. Catholics who go to Mass weekly also tend to go to confession more frequently than those who don’t attend weekly Mass; 53% of weekly attenders say they go to confession at least once a year. Wearing religious symbols, devotions and other practices The survey asked Catholics how often they engage in practices such as wearing or carrying religious items; practicing devotions to Mary or a favorite saint; praying the rosary; reading the Bible; and lighting candles or incense for spiritual or religious reasons. The most common of these practices is wearing or carrying religious items, which 44% of Catholics do monthly. Meanwhile, 36% say they practice devotion to Mary or a favorite saint that often. The least common of these practices is lighting candles or incense for spiritual reasons, which 17% of Catholics say they do monthly. Weekly Mass attenders are generally more inclined than Catholics overall to engage in these practices. For example, around six-in-ten Catholics who attend Mass at least once a week (62%) say they regularly wear or carry religious items with them, compared with 44% of Catholics overall. Meanwhile, 59% of weekly attenders say they practice devotion to Mary or a favorite saint, compared with 36% of Catholics overall. The survey also finds that several of these practices are far more common among Hispanic Catholics than White Catholics. For example: 56% of Hispanic Catholics say they wear or carry religious items with them at least monthly, compared with 39% of White Catholics. 46% of Hispanic Catholics practice devotions to the Virgin Mary or a favorite saint at least monthly, compared with 31% of White Catholics. 37% of Hispanic Catholics pray the rosary at least monthly, versus 22% of White Catholics. 26% of Hispanic Catholics say they light candles or incense for spiritual or religious reasons at least monthly, compared with 11% among White Catholics. Refer to Chapter 4 for additional details about the distinctiveness of religious practices among Hispanic Catholics. Traditional Latin Mass Overall, 13% of U.S. Catholics (including 22% of those who attend weekly Mass) say they have attended a Traditional Latin Mass (TLM) at least once in the last five years. To help avoid confusion and ensure respondents understood what we meant by “Traditional Latin Mass,” the survey described it as a Mass where “the entire Mass is said in Latin and where the priest faces the altar with his back to the people in the pews.” People who say they have attended at least one TLM in recent years were then asked how often they attend one “these days.” Very few Catholics report regularly attending a TLM today. Overall, 2% of Catholics say they do this at least weekly, 1% do so once or

2. Catholic practices and devotions Read More »