Pew Research Center

2. Views of the Trump administration’s immigration policies

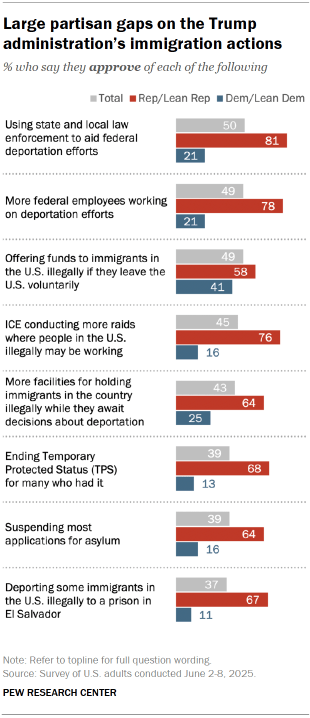
Many Americans disapprove of several of the Trump administration’s most controversial immigration actions. For example, 61% disapprove of deporting some immigrants who are in the United States illegally to a prison in El Salvador, while far fewer – 37% – approve of this policy. Views are similar on suspending asylum applications from people seeking to live in the U.S. There is somewhat more support for Immigration and Customs Enforcement (ICE) conducting more raids on workplaces where people in the U.S. illegally may be working. Still, more disapprove (54%) than approve (45%) of increasing these raids. (Note: Most of this survey was conducted before recent protests in Los Angeles and other cities against ICE immigration sweeps and before the Trump administration’s subsequent decision to deploy Marines and National Guard troops to Los Angeles.) The public is roughly split on using state and local law enforcement to aid in deportation efforts and significantly increasing the number of federal employees who are working on such deportation efforts. Notably, substantially expanding the wall along the U.S. border with Mexico – a signature policy priority of Donald Trump’s first term – draws majority support. Currently, 56% favor expanding the border wall, up from 46% in 2019. Wide partisan gaps in approval of Trump’s immigration policies Republicans largely approve of all eight administration policies included in the survey, while majorities of Democrats disapprove of each policy. Still, opinions among partisans vary across the individual items. Among Republicans Sizable majorities of Republicans and Republican-leaning independents support expanding enforcement efforts against people in the U.S. illegally: 81% approve of using state and local law enforcement to help with efforts to deport those in the U.S. illegally. 78% approve of increasing the number of federal employees devoted to deportation efforts. 76% approve of increased workplace raids by ICE. There is somewhat less GOP support for other actions. About six-in-ten Republicans (58%) approve of offering money and travel funds to immigrants in the U.S. illegally if they voluntarily leave – the lowest of any item included on the survey. Among Democrats For seven of the eight Trump administration immigration policies asked about in the survey, no more than a quarter of Democrats and Democratic-leaning independents approve. The policy that draws the most support among Democrats is the approach that attracts the least support among Republicans: 41% of Democrats approve of offering money and travel funds to immigrants in the U.S. illegally if they voluntarily leave the country. Views by race, ethnicity and party Opinions about the administration’s immigration policies vary by race and ethnicity. But there are wider differences by race and ethnicity among Republicans than Democrats. Race and ethnicity Hispanic and Black Americans are deeply skeptical of the administration’s immigration policies: Fewer than four-in-ten Hispanic Americans approve of seven out of the eight policies included in the survey. A larger share (45%) approve of offering money and travel funds to people in the U.S. illegally to leave the country voluntarily. No more than about a third of Black adults approve of any of these immigration policies. Opinions among Asian Americans vary widely across the policies: Majorities approve of using state and local law enforcement to help with deportation efforts (58%) and offering funds to those here illegally who self-deport (59%). But there is far less support for other policies. Majorities of White adults approve of several of the administration’s policies. For instance, 59% support using state and local law enforcement to help with deportation efforts, and 56% approve of increasing the number of federal employees working on efforts to detain and deport people in the U.S. illegally. Race and ethnicity among partisans   There are substantial differences among Republicans by race and ethnicity on these questions, with White Republicans more likely than Hispanic Republicans to approve of most of these policies. For example, most White Republicans (87%) approve of using state and local law enforcement to help with efforts to deport people in the country illegally. A much smaller share (57%) of Hispanic Republicans share this view. There are similar gaps between White and Hispanic Republicans on increasing the number of federal employees working on efforts to detain and deport people in the U.S. illegally (84% vs. 55%) and ICE conducting more raids where people in the U.S. illegally may be working (82% vs. 58%). Racial and ethnic differences in views of Trump policies are much narrower among Democrats. Age differences in views of Trump’s immigration policies For the most part, Trump’s immigration actions draw more support among people 50 and older than among younger adults. Nearly six-in-ten older adults approve of using state and local law enforcement to aid deportation efforts (58%) and of increasing federal personnel working on these efforts (57%). By comparison, about four-in-ten adults under 50 approve each of these policies. Age differences in attitudes about immigration policies are particularly pronounced among Republicans. For example, while 89% of Republicans ages 50 and older approve of using state and local law enforcement to help with efforts to deport people in the U.S. illegally, a smaller majority (73%) of those under 50 say the same. And older Republicans are more likely than younger Republicans to say they approve of ICE conducting more raids where people in the U.S. illegally may be working (85% vs. 67%). The pattern of older Republicans being more likely than younger Republicans to approve of the administration’s immigration approach is consistent across all of these policies. Expanding the wall along the U.S. border with Mexico A narrow majority of Americans (56%) favor substantially expanding the wall along the U.S.-Mexico border – a 10 percentage point increase from 2019. This increased support is largely driven by shifts among Democrats. Most Democrats continue to oppose substantially expanding the border wall (73%). But Democrats are about twice as likely to favor expansion today (27%) than they were in 2019 (14%). 36% of conservative and moderate Democrats favor expansion today, up from 19% in 2019. 14% of liberal Democrats favor expanding the wall, up from 9%

2. Views of the Trump administration’s immigration policies Read More »
Appendix A: Global Attitudes Survey fieldwork timeline

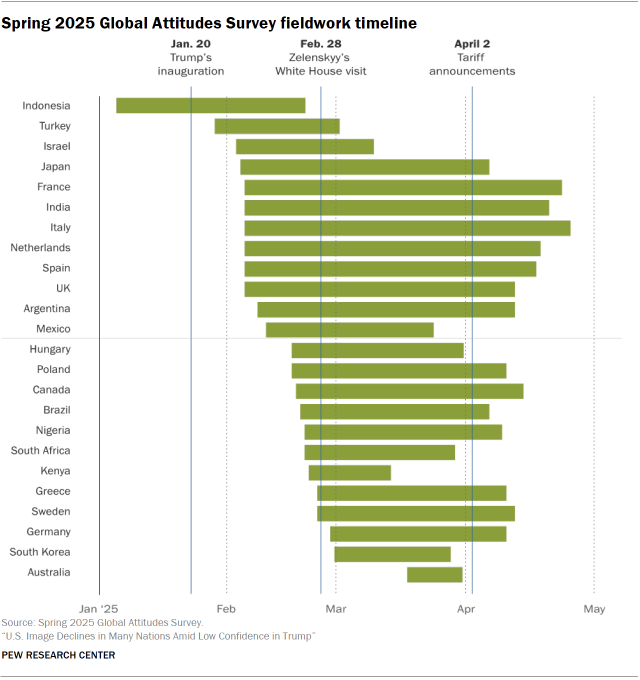
There were many events, meetings and announcements that occurred shortly before and during our fieldwork period that may have impacted how people in other countries perceive the U.S. and its president. We highlight a few prominent events here that were relevant across multiple countries and directly relate to the questions included in our survey. source

Appendix A: Global Attitudes Survey fieldwork timeline Read More »

47% of U.S. Adults Have a Personal or Family Connection to Catholicism

(Getty Images) How we did this Pew Research Center conducted this study to estimate how many Americans have connections with Catholicism, to measure religious beliefs and practices among U.S. Catholics, and to explore what Catholics consider essential to their Catholic identity. We analyzed two surveys: the 2023-24 U.S. Religious Landscape Study (RLS) and a smaller, but more recent, survey of U.S. adults conducted Feb. 3-9, 2025, which included many questions designed specifically for Catholics. This report relies mostly on the 2025 survey, which was conducted among a sample of 9,544 U.S. adults, including 1,787 Catholics. All the respondents were members of the Center’s American Trends Panel (ATP), a group of people who have agreed to take surveys regularly and who were recruited through national, random sampling of residential addresses. This kind of recruitment gives nearly all U.S. adults a chance of selection. ATP surveys are conducted either online or by telephone with a live interviewer. The survey data is weighted to be representative of the U.S. adult population by gender, race, ethnicity, partisan affiliation, education, and other factors. Read more about the ATP’s Methodology. In addition to the 1,787 respondents who self-identify as Catholic, the 2025 survey included 782 interviews with people who are not Catholic (by religion) but who consider themselves culturally Catholic, 836 respondents who are former Catholics, and 878 people who have other Catholic connections (i.e., they have a Catholic parent or spouse/partner, or they say “yes” when asked if they ever attend Catholic Mass). Here are the questions from the 2025 survey used in this report, the topline and the survey methodology. For some estimates, this report relies on the 2023-24 RLS, an extremely large survey with 36,908 respondents, including 6,958 Catholics. The RLS asked a few of the same questions as the 2025 survey (for example, about religious attendance, political party identification and demographic characteristics such as age and race). Because of the much larger sample and greater statistical precision available in the RLS, we have relied on RLS data when analyzing responses by Catholics to questions that appeared in both the RLS and the 2025 survey. Catholicism’s roots in the United States run deep. Nearly half of U.S. adults (47%) claim some connection to the Catholic faith. A new Pew Research Center survey finds that: 20% of U.S. adults are Catholics: They say they are Catholic when asked about their present religion. 9% of U.S adults are “cultural Catholics”: They don’t identify with Catholicism religiously, but they say “yes” when asked whether “aside from religion” they consider themselves Catholic in any way (for example, ethnically, culturally, or because of their family background). 9% are former Catholics: They neither identify as Catholic religiously nor consider themselves culturally Catholic, but they say they were raised in the Catholic faith. 9% are connected to Catholicism in other ways: They are not Catholic, culturally Catholic or formerly Catholic, but they have a Catholic parent, spouse or partner or they say “yes” when asked if they ever attend Catholic Mass. Terminology Throughout this report, when we use the term Catholic, we are referring to U.S. adults who say they are Catholic when asked about their religion. We use the following terms when referring to people who are not Catholic by religion, but are connected to the faith in other ways: Cultural Catholics say they consider themselves Catholic “aside from religion” (e.g., ethnically, culturally, or because of their family background). Former Catholics were raised Catholic but no longer identify as Catholic, religiously or culturally. People who are connected to Catholicism in other ways are not Catholic by religion or culture, nor are they former Catholics. But they report having a Catholic parent, spouse or partner, or say yes when asked if they ever attend Mass. Among the 20% of U.S. adults who are Catholic, some are deeply observant. For example: 50% say they pray daily. 28% attend Mass at least weekly. 23% go to confession with a Catholic priest at least once a year. Altogether, 13% of American Catholics say they do all three of these things. On the other hand, many U.S. Catholics are relatively nonobservant. For instance: 22% seldom or never pray. 40% seldom or never attend Mass. 47% never go to confession with a Catholic priest. In total, 13% of U.S. Catholics by religion seldom or never pray and seldom or never attend Mass and never go to confession. The largest share of Catholics (74%) fall somewhere in the middle of this spectrum of observance. They may pray. They may attend Mass. They may go to confession. But they don’t regularly do all three (pray daily, attend Mass weekly and go to confession annually). These are among the key findings of a Pew Research Center survey conducted Feb. 3-9, 2025, among a nationally representative sample of 9,544 U.S. adults, including 1,787 Catholics. The survey was designed to explore Catholic life in the United States. It was completed prior to the hospitalization of Pope Francis on Feb. 14 and his death in April, and well before the conclave that elected his successor, Pope Leo XIV. Throughout this report, “Catholics” refers to U.S. adults who say they are Catholic when asked about their present religion, regardless of their level of observance. The terms “cultural Catholic,” “former Catholic” and “other connections to Catholicism” refer to people who do not consider Catholicism to be their religion but who have other connections to Catholic life. The Center previously released two reports based on the same survey, one focusing on U.S. Catholics’ opinions about Francis and another on what Catholics say they want from the church. The rest of this Overview covers: Essentials of Catholic identity The survey asked American Catholics what “being Catholic” means to them. It offered 14 items and asked respondents to say whether each one is an “essential,” an “important but not essential,” or “not an important” part of what being Catholic means to them. In response, the item most commonly selected as essential was “having a personal

47% of U.S. Adults Have a Personal or Family Connection to Catholicism Read More »

1. Essentials of Catholic identity

How we define Catholics in this chapter This chapter exclusively explores views and experiences among U.S. Catholics (i.e., the 20% of U.S. adults who say they are Catholic when asked about their present religion). Many Americans who are not Catholic are still connected to the faith in other ways. Read more about these “cultural Catholics,” former Catholics, and people with other Catholic connections (i.e., those who have  a Catholic parent, spouse or partner, or say “yes” when asked if they ever attend Catholic Mass) in Chapter 7 and the Overview. To find out what U.S. Catholics see as the core elements of their own religion, we presented respondents with 14 items and asked them to say whether each one is an “essential,” an “important but not essential,” or “not an important” part of what “being Catholic means to you.” Respondents had the option to describe more than one item as essential – or to say that none of the items are essential – to what being Catholic means to them. They also had a chance, at the end of this section of the survey, to mention anything else they view as essential to their Catholic identity. (Pew Research Center previously has asked similar questions of a wide variety of religious groups, including in surveys of Jewish Americans in 2020 and 2013; a 2017 survey of Muslims; a 2015 survey of Catholics; a 2012 survey of members of the Church of Jesus Christ of Latter-day Saints, who are widely known as Mormons; and a 2016 survey of the general U.S. public.) In the present survey, about seven-in-ten U.S. Catholics say that “having a personal relationship with Jesus Christ” is an essential part of being Catholic for them. Meanwhile, about half say that devotion to the Virgin Mary (50%), working to help the poor and needy (47%) and receiving the Eucharist (46%) are essential to their Catholic identity. Some other beliefs and practices are viewed as essential by roughly a third of U.S. Catholics. Between 30% and 33% say the leadership of the pope, being part of an unbroken tradition going back to the apostles, opposing abortion, taking care of the environment, being part of a Catholic parish, and caring for immigrants are essential to what being Catholic means to them. Answers to these questions tend to vary according to how often Catholics go to Mass. Those who attend weekly are generally more inclined than other Catholics to say that the 14 items we asked about are essential to their Catholic identity. For example, 83% of weekly Mass-attending Catholics say that receiving the Eucharist is essential, compared with 56% of Catholics who attend Mass once or twice a month, 31% who attend a few times a year or less often, and 15% who say they never attend Mass. There are also differences between Hispanic Catholics and White Catholics on these questions. For example, compared with White Catholics, far more Hispanic Catholics say a personal relationship with Jesus, devotion to the Virgin Mary, caring for immigrants, and celebrating national or ethnic feast days are essential parts of what being Catholic means to them. (The survey sample did not include enough Black or Asian Catholics to allow their answers to be analyzed and reported separately.) After presenting respondents with all 14 items, the survey asked whether there is anything else that is essential to what being Catholic means to them, inviting them to elaborate in their own words. Most respondents (70%) did not volunteer any additional answers. Among those who gave additional answers, some of the more common responses were: Being kind to others (5% of all Catholics volunteered this as an essential component of what being Catholic means to them) Following the teachings of Jesus and/or the Bible (4%) Being ethical/moral (4%) Believing in God or Jesus (3%) While the analysis in this chapter focuses mostly on what Catholics say is essential to their Catholic identity, the survey also gave respondents the option to say that various beliefs and practices are important but not essential to what being Catholic means to them. When the essential and important but not essential categories are combined, it becomes clear that a majority of Catholics view 13 of the 14 items listed in the survey as either essential or important. The lone exception is “going on pilgrimages,” which roughly a third of U.S. Catholic adults view as essential (9%) or important but not essential (27%) to their Catholic identity. For details on how subgroups of Catholics answered these questions, refer to the detailed tables. For additional information on what Hispanic Catholics see as essential to being Catholic, jump to the relevant section in Chapter 4. Read on about essentials of Catholic identity by: Essentials of Catholic identity by Mass attendance Weekly Mass attenders are generally more likely than Catholics who attend less frequently to say the items we asked about are essential to being Catholic for them. For example, 91% of Catholics who go to Mass at least weekly say that having a personal relationship with Jesus Christ is essential to what being Catholic means to them, compared with 67% of Catholics who go to Mass monthly and 63% of Catholics who go to Mass a few times a year or less often. Among Catholics who never go to Mass, 45% say having a personal relationship with Jesus is essential to their Catholic identity. And 83% of weekly attenders say receiving the Eucharist is essential to their Catholic identity, compared with 56% of Catholics who go to Mass once or twice a month and less than half of Catholics who go to church a few times a year or less often. Essentials of Catholic identity by party identification Catholic Democrats and independents who lean Democratic are more likely than Catholic Republicans and Republican leaners to view the following items as essential to their Catholic identity: Working to help the poor and needy (54% among Catholic Democrats vs. 40% among Catholic Republicans) Caring for immigrants (46% vs.

1. Essentials of Catholic identity Read More »

14. Religion in sub-Saharan Africa

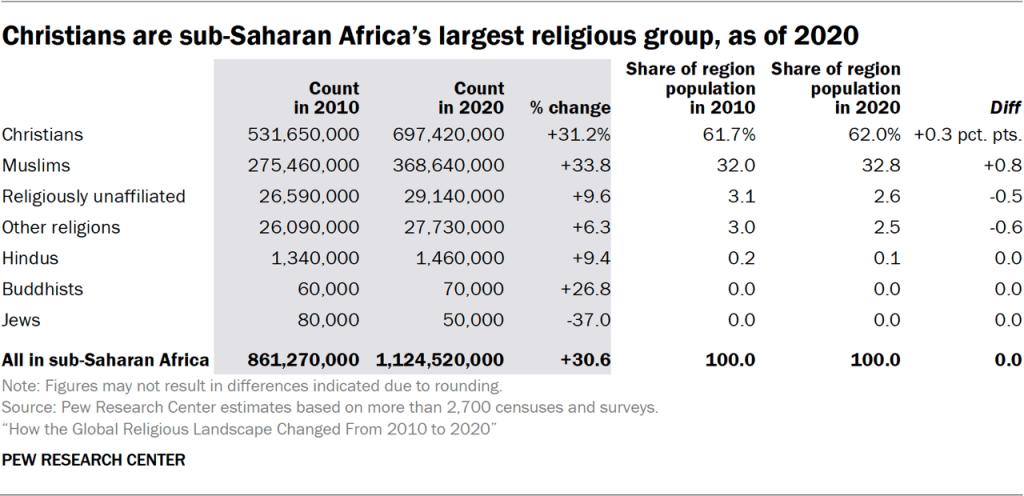
Between 2010 and 2020, the population of sub-Saharan Africa grew by 31% to 1.1 billion. As of 2020, most people living in the region are Christians (62%), while Muslims make up about a third of the population. Religiously unaffiliated people and followers of other religions (which include African traditional religions) each account for roughly 3% of the overall population. Sub-Saharan Africans are younger and have a higher fertility rate, on average, than people in any other region, leading to growth among all religious groups except for Jews. From 2010 to 2020, sub-Saharan Africa accounted for most of the increase in Christian numbers, globally. Christians and Muslims, who together make up 95% of sub-Saharan Africans, are not evenly distributed in the region or even within many countries. Muslim-majority countries are in the north, closer to North Africa and the Middle East, while Christian-majority countries are in the south. This north-south divide appears in some countries, too. In Nigeria, for example, Muslims and Christians make up similar population shares but typically live in the north and south, respectively. A similar dynamic in Sudan contributed to the division of Sudan and South Sudan in 2011. Measuring traditional religion and religiously unaffiliated populations in the region can be difficult. For example, older, traditional beliefs – including animism and Indigenous religious traditions – are often integrated into the monotheistic religions, making it hard to separate Christians and Muslims from people who fall in the “other religions” category. Religious change Sub-Saharan Africa’s overall population is growing fast, and the same is true for its two largest religious groups. Between 2010 and 2020, the number (or count) of Christians grew to 697 million (up 31%), while Muslims increased to 369 million (up 34%). More than 29 million people in the region are religiously unaffiliated (up 10%), and 28 million identify with an “other religion” (up 6%), most commonly animism and other Indigenous traditions. Hindus number more than 1 million (up 9%), as of 2020. But across this region of over 1 billion people, Buddhists and Jews each number in the tens of thousands, as they did in 2010. There were only small changes in the percentages (or shares) of the regional population these groups made up in 2020 compared with 2010. The share of the population that is Muslim changed the most, growing by roughly 1 percentage point to 33%. Christians increased their share by less than half of a percentage point, to 62%. The religiously unaffiliated and “other religions” populations both declined slightly, but each still made up roughly 3% of sub-Saharan Africa’s population in 2020, as they did in 2010. Substantial change within countries Across sub-Saharan Africa, the largest substantial change (of at least 5 percentage points) in a religious group’s share of a country’s population occurred in Guinea-Bissau, where the religiously unaffiliated grew to represent 12% in 2020, up 9 percentage points from 2010. In the same country, the share of people belonging to other religions fell to 11% (down 7 points). How is ‘substantial change’ defined? This section highlights countries that experienced substantial change in the size of their religious populations between 2010 and 2020. We focus on cases where a religious group’s share of a country’s population grew or shrank by at least 5 percentage points. We set that threshold because wide variations in data sources make it difficult to test the statistical significance of differences in population estimates in 2010 and 2020. Refer to the Methodology for details. Mozambique is the only country in the region (and in the world) in which Christians substantially increased their share of the population, growing to 61% (up 5 points). A government-led anti-religious campaign in Mozambique officially ended in the 1980s, and the share of its population that is Christian has been increasing since then. Other changes also occurred: Christians declined in Benin, Namibia and Cape Verde. The percentage of the population identifying as Muslim increased substantially in one country (Benin) and fell in one other (Tanzania). The share of religiously unaffiliated people expanded in three countries (Guinea-Bissau, Cape Verde and Namibia). Median age of religious groups Sub-Saharan Africa has the youngest population of any major region of the world. With a median age of 19, young people make up most of the region’s population. Christians tend to be older than Muslims across the region, with median ages of 20 and 17, respectively. People in the “other religions” category also have a median age of about 20. (There is not enough information available about the age structure of Buddhists in the region to make a reliable estimate of their median age.) Recommended Citation: Hackett, Conrad, Marcin Stonawski, Yunping Tong, Stephanie Kramer, Anne Shi and Dalia Fahmy. 2025. “How the Global Religious Landscape Changed From 2010 to 2020.” Pew Research Center. doi: 10.58094/fj71-ny11. source

14. Religion in sub-Saharan Africa Read More »

3. Confidence in Trump to handle global issues

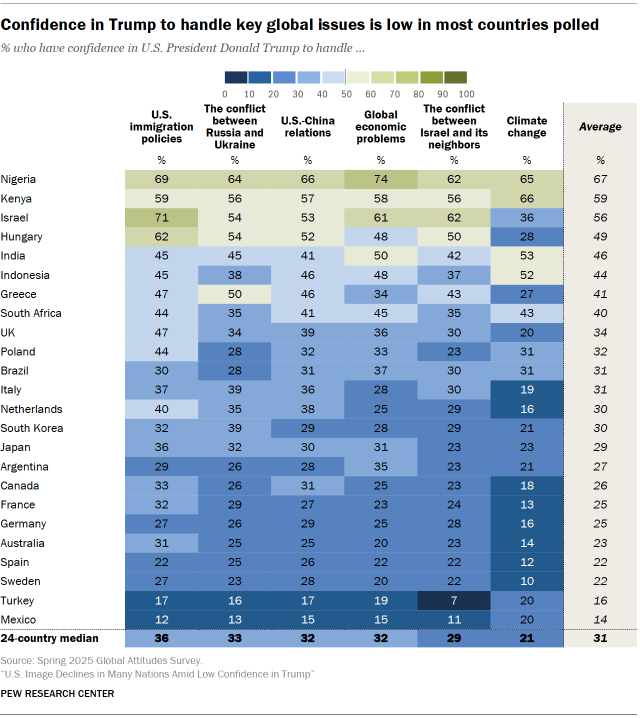
We asked people in 24 countries whether they have confidence in U.S. President Donald Trump to deal with six major international issues. On each of these issues, majorities in most countries surveyed lack confidence in Trump. Confidence is particularly low in neighboring Mexico and Canada, as well as in Turkey, Australia and many European nations, including France, Germany and Sweden. People often feel strongly: Pluralities in these countries tend to say they have no confidence at all in Trump on these issues. Confidence in Trump is much higher in Kenya, Nigeria and Israel and, depending on the particular issue, also in Greece and Hungary. To the degree that people differentiate across the six issues we asked about, they tend to have the least confidence in Trump’s handling of global climate change. Trump tends to get relatively higher ratings for his handling of U.S. immigration policies, although a median of only 36% across 24 countries express confidence in Trump on this issue. Views by ideology People who place themselves on the ideological right have significantly more confidence in Trump’s handling of each issue, when compared with people on the ideological left. These gaps are particularly large in Australia, Canada and Israel. (Australia and Canada both held recent elections in which observers say Trump and his rhetoric played a role.) Across the six issues in the survey, ideological gaps tend to be largest on Trump’s handling of U.S. immigration policies. Views by right-wing party support People who support right-wing populist parties in Europe are significantly more confident in Trump to handle all of these issues, compared with nonsupporters. Right-wing populists in many European countries are around two times as likely as their counterparts to have confidence in Trump’s handling of the conflict between Russia and Ukraine. In some other countries, too, people who support a specific right-wing party tend to be about twice as confident in Trump on most issues, compared with nonsupporters. This pattern holds among supporters of: The Liberal Party in Brazil (the party of former President Jair Bolsonaro) Likud in Israel (the party of Prime Minister Benjamin Netanyahu) La Libertad Avanza in Argentina (the party of President Javier Milei) The People Power Party in South Korea (the party of former President Yoon Suk Yeol) How confidence in Trump on specific issues relates to overall confidence Confidence in Trump to deal with each issue strongly relates to confidence in Trump overall. People who are confident in him to handle global economic problems, climate change, relations with China, the Russia-Ukraine war, the conflict between Israel and its neighbors or U.S. immigration policies are all more likely to have confidence in the U.S. president overall.  Comparing assessments of Trump and Biden Last year, we asked whether people approved or disapproved of how Biden was handling many of these same issues. Because our 2025 survey came at the beginning of Trump’s second term, we asked about confidence in him to deal with these things, rather than approval. Across the issues we asked about last year, we found roughly four-in-ten approved of the job Biden was doing, with the exception of his handling of the Israel-Hamas war (31% approved). For more, read our June 2024 report: “Globally, Biden Receives Higher Ratings Than Trump.” U.S immigration policies Across the 24 countries surveyed, a median of 36% have confidence in Trump to handle U.S. immigration policies, while a median of 61% do not. People in Israel, Nigeria, Kenya and Hungary stand out for their relatively positive views, with around six-in-ten adults or more in each country saying they have either a great deal or some confidence in Trump’s handling of immigration. In India, more have confidence in him than not, though a large share is unsure. Views are fairly divided in South Africa, Indonesia, Poland and Greece. In the other countries surveyed, views are broadly negative. In Mexico, for example, 87% of adults lack confidence in Trump’s handling of immigration policies – including 62% who have no confidence in him at all. In Brazil, Canada, France and Germany, around half of the public or more also reports having no confidence at all in Trump on this issue. Russia-Ukraine war A median of 33% have confidence in Trump to handle the conflict between Russia and Ukraine, while a median of 65% have little or no confidence in him on this issue. The survey was largely conducted after the Feb. 28 Oval Office meeting between Trump and Ukrainian President Volodymyr Zelenskyy. Read Appendix A for more information about our survey timeline. People in Hungary, India, Israel, Kenya and Nigeria are all more likely than not to have confidence in Trump’s handling of this conflict, while people in Greece are divided. Elsewhere, views are much less positive. Aside from Greece and Hungary, majorities in all the European countries surveyed express little or no confidence in Trump on his handling of the Russia-Ukraine war. In France, Germany and Sweden, around half of adults or more have no confidence in him at all. Outside Europe, around three-quarters or more in Australia, Canada, Mexico and Turkey also lack confidence in Trump’s handling of the Russia-Ukraine war. Global economic problems Across the 24 countries surveyed, a 32% median have confidence in Trump’s ability to handle global economic problems, while a 67% median do not. The survey was largely conducted before Trump announced tariffs on countries around the world on April 2. Confidence in Trump to manage global economic problems is relatively high in India, Israel, Kenya and Nigeria (though in India, a large share is unsure). Opinions are fairly divided in Hungary, Indonesia and South Africa. In most other countries, confidence in Trump’s handling of the economy is limited. This is particularly the case in Mexico, where the survey followed weeks of shifting tariff policies affecting Mexican imports. Indeed, in a majority of countries, only around a third of adults or fewer have confidence in Trump to deal with global economic problems – and in many, a large share of the public

3. Confidence in Trump to handle global issues Read More »

Same-Sex Parents Raising Kids

Illustrations by Eliana Rodgers June 12, 2025 “Our lives look the same as every other family. … We do the same things, like taking our kids to the park. … We live a very, very typical life. It’s just us being two women who are married and raising beautiful, wonderful kids.” These are the words of a lesbian mom in her 30s reflecting on the family she has created with her wife. As part of our efforts to explore the experiences of LGBTQ adults and their families in the United States, Pew Research Center conducted a series of interviews with 30 gay, lesbian and bisexual adults who are raising children with a same-sex spouse or partner. Fewer than 1% of parents are married to or living with a same-sex spouse or partner. This small share makes it difficult for researchers to report on their views and experiences through a survey. Our interviews were not designed to be representative of all LGBTQ parents or all adults with a same-sex spouse or partner. These individuals’ stories are specific to their families, but together they provide a glimpse into the lives of same-sex couples raising kids. Related: The Experiences of LGBTQ Americans Today Many of the parents we interviewed talked about how their experiences raising a family are just like anyone else’s. They love their children, juggle many responsibilities and worry about paying their bills. But they also face some unique challenges: Their paths to parenthood are often difficult and expensive. Many participants spoke to challenges they faced while looking for sperm or egg donors or while navigating the adoption process as a same-sex family. Their families don’t always fit society’s “norm.” One dad talked about having to decide whether he or his husband would be on their child’s birth certificate, since only one father could be listed. Other participants recalled having to correct people who assumed their children have both a mother and a father. They worry about what the future might hold for families like theirs. Some parents expressed concern about federal policies that could strip same-sex couples of their legal rights to their children. Participants also talked about the ways in which they feel their same-sex family is supported and celebrated: Several described the support they get from their own parents. We heard stories about grandparents covering child care when couples returned to work following parental leave. Some interviewees received financial assistance from their parents to help with mounting fertility costs. Friends often provide an important support system, too. Several parents spoke about the gratitude they felt when their close friends – or chosen family – stepped in to help them prepare their home to welcome adopted children. Social media is also seen as a tool LGBTQ parents can use to connect and learn from one another, especially if they don’t live near other same-sex couples with kids. Living in a welcoming community helps them feel safe as a family. One parent mentioned the relief he felt when the family pediatrician immediately used language recognizing that his child has two dads, without him having to explain. Another described attending an LGBTQ-friendly church that provides a welcoming space for his family. Terminology In this essay, we use the terms same-sex parents and LGBTQ parents to refer to men and women who are raising children with a same-sex spouse or partner and who identify as gay, lesbian, bisexual or queer. Other references to the acronym LGBTQ such as “LGBTQ adults” or “LGBTQ community” refer to people who are lesbian, gay, bisexual, transgender or queer. About this study Pew Research Center conducted this study to understand the experiences of parents who are raising children with a same-sex spouse or partner. This study is part of a broader project focused on the experiences of LGBTQ adults 10 years after the Supreme Court’s Obergefell v. Hodges ruling legalized same-sex marriage nationwide. In addition to these interviews with same-sex parents, the project includes a survey of LGBTQ adults that explores how they see the impact of Obergefell and how they view social acceptance for LGBTQ people more broadly, as well as the experiences of those in same-sex relationships. Because the number of same-sex parents in the survey is too small to analyze separately, we conducted these interviews to explore this aspect of family life among LGBTQ adults. This work also builds on our broader research on parenting in America.   For this study, we worked with PSB Insights to conduct in-depth interviews from Nov. 4 to Nov. 25, 2024, with 15 men and 15 women raising children younger than 18 with a same-sex spouse or partner. Transgender adults were eligible to participate if they have a same-sex spouse or partner and children under age 18. The final sample did not include any transgender participants. Participants were recruited by RRU Global through targeted email outreach among their panel of qualified candidates and through connections with potential participants through LGBTQ networks and LGBTQ parent groups via social media. Candidates were eligible if they met the technology requirements to participate in an online interview as well as the following criteria: they are 18 years of age or older, they identify as LGBTQ and are married to or living with a same-sex spouse or partner, and they are jointly raising a child age 17 or younger living in their household at least 50% of the time. The participants were a mix of ages, races and ethnicities, and they were from all four regions of the U.S. (Midwest, Northeast, South and West). For more details, refer to the methodology. The findings in this essay are not statistically representative and cannot be extrapolated to wider populations. Some quotes have been lightly edited for clarity, brevity and/or to remove identifying details. Participants are identified as gay, lesbian or bisexual based on their answers to the screening questionnaire. These terms don’t necessarily encompass all of the ways in which participants described their sexual orientation. Participants’ ages are grouped to better preserve their anonymity.

Same-Sex Parents Raising Kids Read More »

Appendix A

ABOUT PEW RESEARCH CENTER Pew Research Center is a nonpartisan, nonadvocacy fact tank that informs the public about the issues, attitudes and trends shaping the world. It does not take policy positions. The Center conducts public opinion polling, demographic research, computational social science research and other data-driven research. Pew Research Center is a subsidiary of The Pew Charitable Trusts, its primary funder. source

Appendix A Read More »

Rising Number of U.S. Households Are Headed by Married Same-Sex Couples

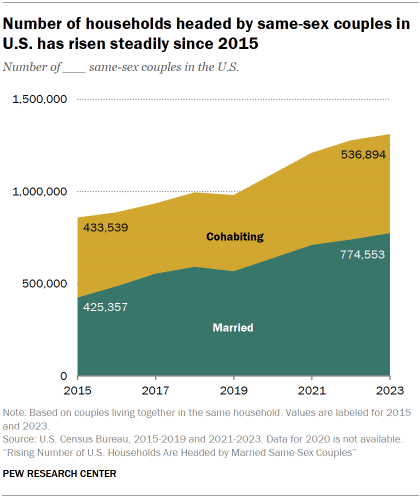
About this project Pew Research Center conducted this study to understand the demographic characteristics and experiences of adults who are married to or living with a same-sex spouse or partner. This analysis is part of a broader project focused on the experiences of lesbian, gay, bisexual, transgender and queer adults 10 years after the Supreme Court’s Obergefell v. Hodges ruling legalized same-sex marriage nationwide. The analysis in this report is based on three separate data sources. The number of same-sex married and cohabiting households comes from the U.S. Census Bureau’s characteristics of same-sex couple households. Data is not provided for the year 2020 due to data collection issues during the COVID-19 pandemic. The analysis of where couples live, education, employment, income and family characteristics comes from the American Community Survey (ACS).  The data on same-sex couples’ relationship satisfaction and division of household tasks was collected as part of a larger Center survey of 3,959 LGBTQ U.S. adults conducted from Jan. 8 to Jan. 19, 2025. This analysis is based on responses from 1,154 of those LGBTQ adults who are married to or living with a same-sex spouse or partner. The sample for this survey includes respondents from three different sources: Pew Research Center’s American Trends Panel (ATP), SSRS’s Opinion Panel (OP) and Ipsos’ Knowledge Panel (KP). The ATP is a group of people recruited through national, random sampling of residential addresses who have agreed to take surveys regularly.  The survey included oversamples of transgender adults and gay, lesbian or bisexual adults who are married or living with a partner from Ipsos’ KnowledgePanel. Like the ATP, the Opinion Panel and KnowledgePanel are probability-based online survey web panels recruited primarily through national, random sampling of residential addresses. Interviews were conducted either online or by telephone with a live interviewer. The survey is weighted to be representative of the U.S. LGBTQ adult population by gender, race, ethnicity, partisan affiliation, education and other factors. Here are the questions used for this analysis, the topline and the survey methodology. The Pew Research Center is a subsidiary of The Pew Charitable Trusts, its primary funder. This report was made possible with support from the Trusts and from the People & Voices Initiative. Terminology References to LGBTQ adults include adults who identify as lesbian, gay, bisexual, transgender or queer. Throughout this report, we use the term “different-sex” to refer to couples that consist of a man and a woman in keeping with The Associated Press Stylebook, a resource we use often. In the secondary data findings, same-sex couples refer to those who are living with a spouse or unmarried partner of the same sex. Different-sex couples consist of a man and a woman who are married or unmarried and living in the same household. In the survey findings, references to same-sex couples are based on those who indicated they are married or living with a partner. Additionally, only those who have one partner, or who have more than one partner but consider one to be their primary partner, of the same sex are included. Living with partner and cohabiting are used interchangeably to refer to people who currently live with their partner but are not married. References to college graduates or people with a college degree comprise those with a bachelor’s degree or more education. “Some college” includes those with an associate degree and those who attended college but did not obtain a degree. “High school” refers to those who have a high school diploma or its equivalent, such as a General Educational Development (GED) certificate. References to employed adults include those who are working full or part time. Household income is the sum of incomes of all household members age 15+ during the previous year. Ten years after the Supreme Court’s ruling in Obergefell v. Hodges legalized same-sex marriage nationwide, a Pew Research Center survey finds that two-thirds of LGBTQ adults say the decision made the country more accepting of same-sex couples. Since 2015, the number of households headed by same-sex married couples in the United States has risen steadily from 425,357 to 774,553 in 2023, according to U.S. Census Bureau data. The number of households headed by same-sex cohabiting couples has also risen over this period. It started at 433,539 in 2015 and increased to 536,894 by 2023. Despite these increases, same-sex married couples represent a very small share of all married couples – just 1.3% in 2023. Same-sex cohabiting couples account for 5.6% of all cohabiting couples. (Read a demographic profile of same-sex couples below.) Our accompanying survey finds that while love and companionship are top reasons for same-sex couples to get married, a majority of adults with a same-sex spouse also say legal rights and benefits are a major reason. In general, men and women in same-sex couples express a great deal of satisfaction with their relationship. Those who are married tend to be more satisfied with certain aspects than those who are living with a partner. (Read more from our survey about how same-sex couples describe their relationships.) These findings come from a Pew Research Center survey and analysis of government data. The survey data is based on the responses of 1,154 adults who are married to or living with a same-sex spouse or partner as part of a larger, nationally representative survey of LGBTQ U.S. adults conducted Jan. 8-19, 2025. The analysis of government data about same-sex and different-sex couples is based on data from the U.S. Census Bureau and American Community Survey. Related: The Experiences of LGBTQ Americans Today A demographic profile of same-sex couples The demographic characteristics of same-sex married couples vary somewhat from those of different-sex (sometimes referred to as opposite-sex) married couples. The patterns are largely similar when comparing same-sex and different-sex cohabiting couples. Learn more: Detailed tables on cohabiting couples Where do same-sex married couples live? While substantial shares of same-sex married couples live in all four regions of the United States, there are some differences in where they live compared with different-sex couples. Same-sex

Rising Number of U.S. Households Are Headed by Married Same-Sex Couples Read More »

Appendix B: Classifying European political parties

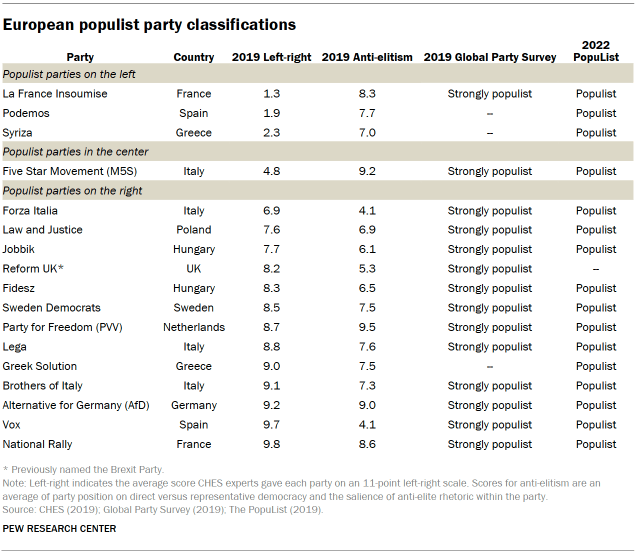
Classifying parties as populist Although experts generally agree that populist political leaders or parties display high levels of anti-elitism, definitions of populism vary. We use three measures to classify populist parties: anti-elite ratings from the 2019 Chapel Hill Expert Survey (CHES), Norris’ Global Party Survey and The PopuList. We define a party as populist when at least two of these three measures classify it as such. CHES, which was conducted from February to May 2020, asked 421 political scientists specializing in political parties and European integration to evaluate the 2019 positions of 277 European political parties across all European Union member states. CHES results are regularly used by academics to classify parties with regard to their left-right ideological leanings, their key party platform positions and their degree of populism, among other things. We measure anti-elitism using an average of two variables in the CHES data. First, we used “PEOPLE_VS_ELITE,” which asked the experts to measure the parties with regard to their position on direct versus representative democracy, where 0 means that the parties support elected officeholders making the most important decisions and 10 means that “the people,” not politicians, should make the most important decisions. Second, we used “ANTIELITE_SALIENCE,” which is a measure of the salience of anti-establishment and anti-elite rhetoric for that particular party, with 0 meaning not at all salient and 10 meaning extremely salient. The average of these two measures is shown in the table below as “anti-elitism.” In all countries, we consider parties that score at or above a 7.0 as “populist.” The Global Party Survey, which was conducted from November to December 2019, asked 1,861 experts on political parties, public opinion, elections and legislative behavior to evaluate the ideological values, issue position and populist rhetoric of parties in countries on which they are an expert, classifying a total of 1,051 parties in 163 countries. We used “TYPE_POPULISM,” which categorizes populist rhetoric by parties. We added only “strongly populist” parties using this measure. In Italy, experts were asked to categorize the entire center-right coalition instead of individual parties within the coalition. The coalition includes Lega, Forza Italia and Brothers of Italy. For all three parties, we applied the coalition rating of “strongly populist.” The PopuList is an ongoing project to classify European political parties as populist, far right, far left and/or euroskeptic. The project specifically looks at parties that have “been represented in their country’s national parliament at least once” since 1989. It is based on collaboration between academic experts and journalists. The PopuList classifies parties that emphasize the will of the people against the elite as populist. This appendix uses The PopuList 3.0. Classifying parties as left, right or center We can further classify these traditional and populist parties into three groups: left, right and center. When classifying parties based on ideology, we relied on the variable “LRGEN” in the CHES dataset, which asked experts to rate the positions of each party in terms of its overall ideological stance, with 0 meaning extreme left, 5 meaning center and 10 meaning extreme right. We define left parties as those that score below 4.5 and right parties as those above 5.5. Center parties have ratings between 4.5 and 5.5. source

Appendix B: Classifying European political parties Read More »