Pew Research Center

The Political Gap in Americans’ News Sources

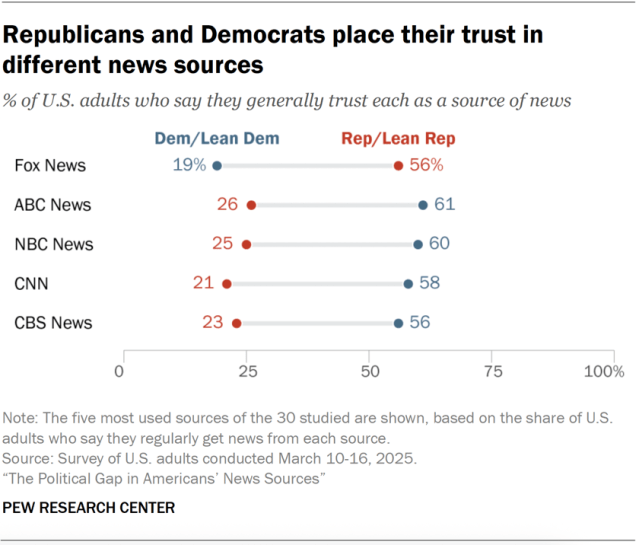
How we did this Pew Research Center conducted this study to continue tracking news consumption and trust across a wide range of specific news sources. We last published similar reports in 2020 (based on a 2019 survey) and 2014. We regularly ask people about their news habits on various platforms (e.g., television, print, radio and digital) and their levels of trust in information from social media and national/local news organizations in general. But this study is designed to be more specific, looking at Americans’ familiarity with, usage of and views toward 30 individual news sources. To learn more about how we chose the 30 news sources, please visit the methodology. Respondents first received a list of all 30 news sources and were asked to select all the sources that they had heard of. Next, for all the sources a respondent had heard of, they were asked which ones they generally trust as sources of news. Then, for all sources that they had heard of but did not say they trust, they were asked if they generally distrust those sources as sources of news. Finally, the survey asked respondents which sources they regularly get news from (again, only among the sources they already indicated they had heard of before). This survey design is similar to one used in a 2019 survey but not directly comparable. The 2025 survey asked Americans which sources they regularly get news from; in 2019, we asked people which sources they got political and election news from within the past week. We also changed several of the 30 sources to reflect the current news media landscape. We surveyed 9,482 U.S. adults from March 10 to 16, 2025. Everyone who took part in this survey is a member of the Center’s American Trends Panel (ATP), a group of people recruited through national, random sampling of residential addresses who have agreed to take surveys regularly. This kind of recruitment gives nearly all U.S. adults a chance of selection. Interviews were conducted either online or by telephone with a live interviewer. The survey is weighted to be representative of the U.S. adult population by gender, race, ethnicity, partisan affiliation, education and other factors. Read more about the ATP’s methodology. Here are the questions used for this report, along with responses, and its methodology. For years now, Democrats have been much more likely than Republicans to say they trust the information that comes from national news organizations. A new Pew Research Center survey gets much more specific: How do Americans feel about 30 of the country’s major news sources? Democrats and independents who lean toward the Democratic Party are much more likely than Republicans and GOP-leaning independents to both use and trust a number of major news sources. These include the major TV networks (ABC, CBS and NBC), the cable news networks CNN and MSNBC, major public broadcasters PBS and NPR, and the legacy newspaper with the largest number of digital subscribers, The New York Times. Republicans, meanwhile, are much more likely to distrust than trust all of these sources. A smaller number of the sources we asked about are more heavily used and trusted by Republicans than Democrats, including Fox News, The Joe Rogan Experience, Newsmax, The Daily Wire, the Tucker Carlson Network and Breitbart. Related: Explore data on how Americans use, trust and distrust 30 major news sources with our interactive News Media Tracker tool. These findings are broadly similar to the last time we asked Americans about many specific news sources, in 2019. The two surveys are not directly comparable due to changes in the way we asked the questions. How we chose these 30 news sources We selected 30 news sources based on a variety of measures, including audience size and previous survey results. We also wanted to prioritize a range of news sources across different platforms, as well as both legacy news outlets and nontraditional news sources, all while keeping the list from becoming too long for survey respondents. This selection process is not perfect; we acknowledge that no list of 30 sources could represent the entirety of today’s diverse and changing media environment. We believe this group of 30 provides an appropriate snapshot of media brands to help us study Americans’ changing news habits. To learn more, read the FAQ and methodology. Americans’ use of news sources by party In many cases, supporters of the two main U.S. political parties are relying largely on different sources of news and information. Republicans and independents who lean Republican get news from a fairly concentrated group of sources, and one rises to the top: Fox News. A majority of Republicans (57%) say they regularly get news from the cable network, at least double the share who say they turn to any other news source we asked about. Behind Fox, Republicans are most likely to say they regularly get news from the three major broadcast networks – ABC News (27%), NBC News (24%) and CBS News (22%) – and The Joe Rogan Experience podcast (22%). While not among Republicans’ most-consumed news sources, several sources are more likely to be regular sources of news for Republicans than Democrats, including Newsmax (15% vs. 1%), The Daily Wire (12% vs. 2%) and Tucker Carlson Network (9% vs. 1%). Democrats and Democratic leaners, on the other hand, turn to a wider range of the sources we asked about. Nearly half of Democrats say they regularly get news from CNN (48%), NBC (47%) and ABC (46%). About four-in-ten Democrats say they get news from CBS (39%), while roughly three-in-ten say the same about MSNBC (33%), NPR (32%), The Associated Press (31%), PBS (31%), BBC News (30%) and The New York Times (29%). All of these sources are far more likely to be consumed by Democrats than Republicans. To a lesser extent, Democrats also are more likely than Republicans to say they get news from The Washington Post (18% vs. 7%), Politico (12% vs. 4%) and The Atlantic (10% vs. 1%). Even as news sources differ by party, there

The Political Gap in Americans’ News Sources Read More »
5. Comparing confidence in Trump, Macron, Putin and Xi

In addition to U.S. President Donald Trump, this year’s survey also asked about other world leaders: President Emmanuel Macron of France, President Vladimir Putin of Russia and President Xi Jinping of China. Macron receives the highest confidence ratings of the four across 24 countries surveyed, with a median of 46% expressing confidence in the French leader. Trump is next with a 34% median confidence rating, followed by 25% for Xi. Only a 16% median have confidence in Putin. Trump’s and Macron’s ratings diverge sharply in Sweden, Germany, the Netherlands, Spain and the UK in Europe; Canada and Mexico in the Americas; and Australia in the Asia-Pacific. In these countries, Macron’s ratings are over 20 points higher than Trump’s. On the other hand, Trump’s ratings are much stronger than Macron’s in Israel and Nigeria. Trump’s confidence ratings are also higher than Xi’s in Brazil, Hungary, India, Israel, Japan, Nigeria, Poland and South Korea. But Xi gets higher ratings than Trump in Indonesia and Mexico. People generally have more confidence in Trump than Putin in most countries but are more confident in Putin compared with Trump in Indonesia, Mexico and Turkey. source

5. Comparing confidence in Trump, Macron, Putin and Xi Read More »

4. Views of Trump’s characteristics

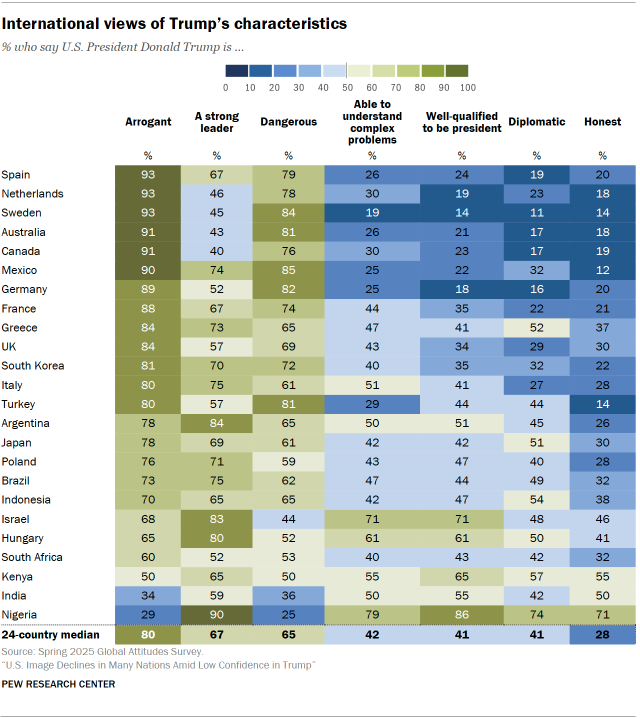
We read respondents in 24 countries a list of seven characteristics and asked whether or not each one describes U.S. President Donald Trump. A median of 80% – and majorities in almost every country surveyed – see Trump as “arrogant.” A median of 67% across the countries surveyed agree Trump is “a strong leader,” with 90% in Nigeria, 84% in Argentina, 83% in Israel and 80% in Hungary saying this describes him. A median of 65% see Trump as “dangerous,” a view that’s especially widespread in Australia, Germany, Mexico, Sweden and Turkey. Comparatively fewer see Trump as dangerous in Nigeria (25%), India (36%) and Israel (44%). Fewer overall see Trump as “able to understand complex problems” (42% median), “well-qualified to be president” (41%) and “diplomatic” (41%). Trump gets his lowest ratings on being “honest” (28% median). Only in Nigeria and Kenya do majorities say this describes him. For detailed responses to these questions by country, read Appendix C. Across this range of characteristics, men tend to have more positive ratings of Trump’s leadership qualities than women. For example, in 19 countries, men are more likely to say Trump is well-qualified to be president and that he is honest. In 18 countries, men are more likely than women to say Trump understands complex problems. In 15 countries, men are more likely to say Trump is a strong leader. And in 11 countries, women are more likely than men to say Trump is dangerous.  How do people describe Trump? Arrogant A median of 80% across the 24 countries surveyed describe Trump as arrogant. This sentiment is especially widespread in the Netherlands (93%), Spain (93%), Sweden (93%), Canada (91%), Australia (91%) and Mexico (90%). Many more people see Trump as arrogant compared with his predecessor, Joe Biden. For example, 93% of adults in the Netherlands see Trump as arrogant, compared with 9% who said the same of Biden in 2021. This pattern holds for all 12 countries where we surveyed in both 2025 and 2021. (The 2021 survey was fielded during the COVID-19 pandemic, which made face-to-face surveying more difficult. Since we mostly conduct face-to-face interviews in middle-income countries, no middle-income nations were included in that year’s survey.) Strong leader Majorities in 18 countries say Trump is a strong leader. This view is up substantially in 19 countries where we surveyed in both 2017 and 2025. Notably, increased sentiment that Trump is a strong leader appears even in places where confidence in him is not particularly high. For example, in South Korea, where only 33% of adults have confidence in Trump to do the right thing regarding world affairs, 70% say Trump is a strong leader, up from 47% in 2017. Strong leadership is one characteristic where Trump has comparatively higher ratings than Biden in a few countries. For example, 69% of Japanese see Trump as a strong leader in 2025, compared with 42% who said this of Biden in 2021. Similar differences are seen in Greece, Italy and South Korea. But Trump is seen as less of a strong leader relative to Biden’s ratings in Canada, Germany, Sweden and the Netherlands. Dangerous Majorities in most countries surveyed see Trump as dangerous. Only in Nigeria, Israel and India do fewer than half of respondents say this describes him. In a few countries, more people see Trump as dangerous now than in 2017. This includes South Africa, where 53% consider Trump dangerous in 2025, compared with the 41% in 2017. In every country where we can compare ratings from both 2021 and 2025, Trump is seen as comparatively more dangerous on the world stage than Biden. Some of these differences are large, such as the 73-point gap measured in Sweden. Able to understand complex problems Fewer than half of adults in 17 countries say Trump is able to understand complex problems, while majorities in four countries say this describes him. In 14 nations, half of adults or more think Trump is not able to understand complex problems. (This characteristic was not included in our 2021 survey about Biden.) Well-qualified to be president A median of 41% say Trump is well-qualified to be president. Compared with Biden’s 2021 ratings, Trump is seen as less qualified to be president in every country where data is available. But relative to the start of Trump’s first term in 2017, sentiment that Trump is qualified to be president is up significantly in most countries surveyed. Diplomatic Relatively few around the world see Trump as diplomatic. A median of 41% across the 24 countries say this describes Trump. Relatively high shares say Trump is diplomatic in Nigeria (86%) and Kenya (65%), compared with under two-in-ten in Australia, Canada, Germany and Sweden. (This characteristic was not included in our 2021 survey about Biden.) Honest Trump’s lowest rating is on honesty. A median of 28% across the 24 countries surveyed say this describes him. As few as 12% of adults in Mexico and 14% each in Sweden and Turkey describe Trump as honest. And even in Israel, where Trump’s confidence ratings are high, fewer than half (46%) say he is honest. Only in India, Kenya and Nigeria do half of adults or more say Trump is honest. (This characteristic was not included in our 2021 survey about Biden.) source

4. Views of Trump’s characteristics Read More »

Video: How much ‘religious switching’ is there in the U.S.?

35% of U.S. adults no longer identify with the religion in which they were raised – that’s about 90 million people who have changed their religious identities. Pew Research Center’s Alan Cooperman, director of religion research, explains the trends. Learn more about the study at pewresearch.org/rls. Publications from the Religious Landscape Study source

Video: How much ‘religious switching’ is there in the U.S.? Read More »

1. Views of the United States

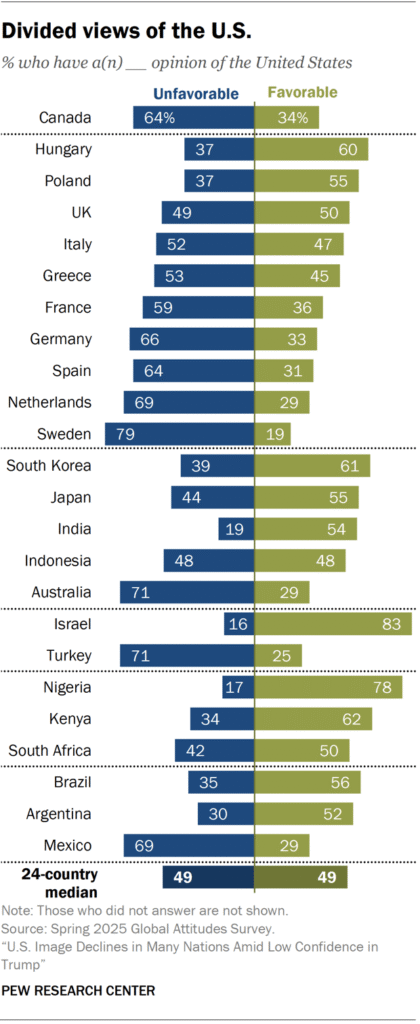
People across the 24 countries surveyed are divided in their ratings of the U.S. on a number of measures: A median of 49% of adults have a favorable overall view of the U.S. An identical share have an unfavorable view. People in eight countries tend to name the U.S. as the world’s leading economic power. In 12 nations, more consider China the top economy. In four, about equal shares name the U.S. and China. A 50% median say democracy works well in the U.S., while 46% say it works poorly. And most agree there are strong partisan conflicts in the country. In many – but not all – of the nations surveyed, views of the U.S. have become more negative since the last time we asked. Overall opinion of the U.S. Roughly half of adults across the countries surveyed view the U.S. favorably. The U.S. receives its most favorable rating from Israel, where 83% see it positively. Majorities also view the U.S. favorably in Brazil, Hungary, Japan, Kenya, Nigeria, Poland and South Korea. The U.S. receives its least positive assessment in Sweden, where 79% have a negative opinion of the country. More than six-in-ten adults view the U.S. negatively in neighboring Canada and Mexico, as do majorities in Australia, France, Germany, the Netherlands, Spain and Turkey. Ratings of the U.S. have dropped significantly in 15 countries since last year. One of the largest decreases is in Mexico, where 29% have a favorable view, compared with 61% in 2024. Canadians have also become much less likely to view the U.S. favorably (34% vs. 54% in 2024). Views of the U.S. have not changed significantly since last year in Argentina, Greece, Hungary, India, South Africa and the UK. And in Israel, Nigeria and Turkey, the share with a positive opinion of the U.S. has increased since last year. Despite this rise in favorability, Turkey still has one of the most negative assessments of the U.S., with only a quarter of adults viewing the country favorably. Views by age In most countries surveyed, adults under 35 have a more positive opinion of the U.S. than those ages 50 and older. One of the largest age gaps is in Brazil, where 73% of younger adults view the U.S. favorably, compared with 37% of older adults. There is also a large difference in Turkey (42% vs. 13%). Views by ideology People who place themselves on the ideological right tend to rate the U.S. more favorably than those on the left. In Israel, for example, 97% of those on the right have a positive opinion of the U.S., compared with 55% of people on the left. (Notably, 51% of Israelis place themselves on the ideological right, a relatively large share compared with most other nations surveyed.) There is also a large ideological divide in Australia, where 60% of those on the right view the U.S. positively, compared with 12% of those on the left. Views by right-wing party support In Europe, people with a favorable opinion of right-wing populist parties are especially likely to view the U.S. positively. For example, 63% of Alternative for Germany (AfD) supporters express a favorable view of the U.S., compared with 25% of Germans who do not support AfD. (For more on how we define populist parties, read Appendix B). Outside Europe, supporters of some right-wing parties also hold more favorable views of the U.S. For example, nearly seven-in-ten Argentines who support La Libertad Avanza – the party of President Javier Milei – rate the U.S. positively, compared with 37% of nonsupporters. U.S. favorability is also particularly high among supporters of former Brazilian President Jair Bolsonaro’s Liberal Party, Israeli Prime Minister Benjamin Netanyahu’s Likud Party and former South Korean President Yoon Suk Yeol’s People Power Party. Do people see the U.S. or China as the top global economy? When asked which is the world’s top economic power – the U.S., China, Japan or the countries of the European Union – people in eight countries tend to name the U.S. More say China is the top economy in 12 countries. And in four, about equal shares name the U.S. and China. Relatively few name the EU or Japan as the leading economic power. More than eight-in-ten adults in South Korea, and roughly two-thirds in Japan, consider the U.S. the world’s top economy. Roughly half or more in Canada, Israel, Nigeria and Turkey agree. In most European and Latin American countries surveyed, people say China is the global economic leader, including roughly six-in-ten in Greece and Italy. The share saying the U.S. is the top economic power has decreased in eight countries, including five in Europe, since this question was last asked in 2023: Australia, France, Germany, Greece, Indonesia, Italy, Mexico and Spain. In these countries, except Australia and Italy, the share naming China as the top economy has increased. Views of China as the world’s leading economic power have also increased since 2023 in Argentina, Brazil, Kenya and South Africa. Canada is the only country where more people view the U.S. as a global economic leader now than in 2023 (+10 points). Views of democracy in the U.S. The U.S. was one of many countries that held an election in 2024. Following that election, people outside of the U.S. are roughly split on whether its democracy is working well or not. Adults in Hungary, Israel, Kenya and Nigeria have the most positive views of U.S. democracy, with roughly three-quarters or more saying it works well. And majorities in Brazil, India, Indonesia, Poland and South Korea agree. But roughly half or more in most European countries, Australia, Mexico and Canada say democracy in the U.S. is functioning poorly. And in Australia, Canada, Mexico, the Netherlands and Sweden, around a third say U.S. democracy is working very poorly. This is the first time we have asked this particular question, but previous Center surveys have also found ambivalent views of American democracy. People around the world generally say the U.S. is at least as

1. Views of the United States Read More »

2. Confidence in Trump

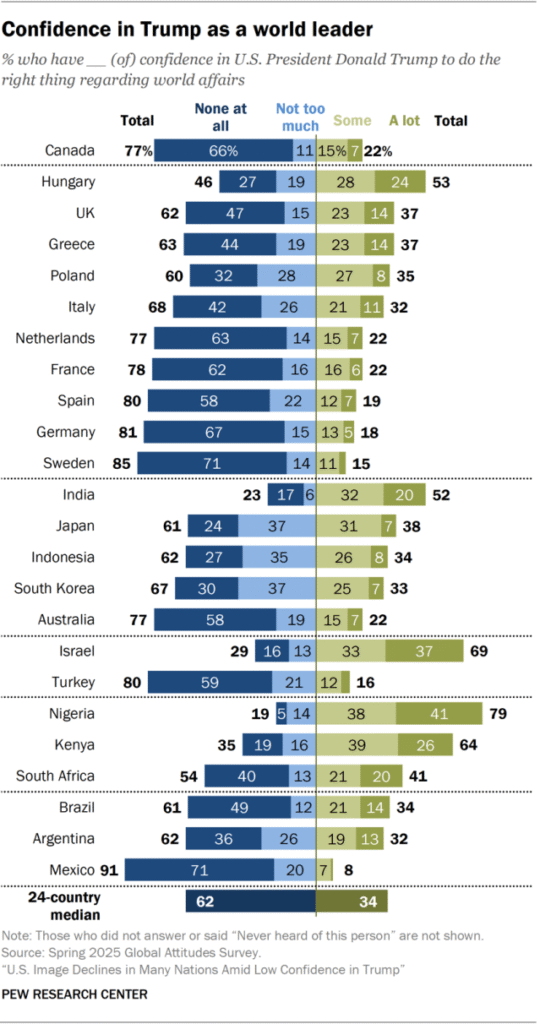
Across 24 countries, a median of 34% of adults have a lot or some confidence in U.S. President Donald Trump to do the right thing regarding world affairs. Around six-in-ten (62%) have little or no confidence in Trump. Trump’s highest ratings come from Nigeria (79% confidence), Israel (69%), Kenya (64%), Hungary (53%) and India (52%). Trump’s lowest ratings come from Mexico (8% confidence), Sweden (15%), Turkey (16%), Germany (18%), and Spain (19%). In 17 countries, confidence in Trump is higher among men than women. Trump is seen more positively among those on the ideological right and among supporters of European right-wing populist parties. Ratings of Trump are lower than 2024 ratings of Biden in 13 nations but higher in six countries. And in most of the countries where trends are available, confidence in Trump is higher now than at the start of his first term in 2017. Confidence in Trump On balance, views of Trump are negative in 19 of the 24 countries surveyed. Ratings of Trump are especially negative in Mexico (where 91% have little or no confidence in Trump’s ability to do the right thing regarding world affairs), Sweden (85%), Germany (81%), Spain (80%) and Turkey (80%). Majorities in Australia, Canada, France, Germany, Mexico, the Netherlands, Spain, Sweden and Turkey have no confidence at all in Trump. In contrast, confidence in Trump is higher in Nigeria (where 79% have some or a lot of confidence), Israel (69%), Kenya (64%), Hungary (53%) and India (52%). But in no country does a majority have a lot of confidence in the U.S. president. Of the sub-Saharan African countries surveyed, confidence in Trump in South Africa is particularly low. (The survey was fielded there well before President Cyril Ramaphosa’s Oval Office meeting with Trump on May 21.)  Views by gender In 17 countries, men are significantly more likely than women to have confidence in Trump. For example, 44% of men in Poland have confidence in Trump to do the right thing regarding world affairs, compared with 26% of women. In India, Poland and South Africa, women are also less likely than men to share an opinion. Views by age In nine countries, older people (that is, those ages 50 and older) have less confidence in Trump than younger people (ages 18 to 34). For example, 51% of younger Japanese have confidence in Trump compared with 31% of older Japanese. These age differences are also seen in Brazil, India, Poland, South Africa, Spain, Sweden, Turkey and the UK. In Brazil, South Africa and India, older adults are also less likely to provide a response. Views by ideology In virtually all countries where we asked about political ideology, those who place themselves on the right are more likely than those on the left to have confidence in Trump. By far the biggest ideological difference is in Israel, where 93% of those on the right have confidence in Trump, compared with 21% on the left. But substantial right-left differences are seen in many countries across all regions of the globe, including Australia, Canada, Hungary, Italy, Netherlands, Poland, South Korea and the UK. The only exception to this pattern is found in Turkey, where those on the left are more confident in Trump than those on the right. Views by right-wing party support Similarly, people who support right-wing populist parties in Europe are much more likely than nonsupporters to have confidence in Trump. Very large differences between supporters and nonsupporters are seen of Fidesz and Jobbik in Hungary; AfD in Germany; Law and Justice in Poland; Reform UK in the UK; Vox in Spain; Lega, Brothers of Italy and Forza Italia in Italy; Greek Solution in Greece; Party for Freedom in the Netherlands; National Rally in France; and the Sweden Democrats in Sweden. Trump is seen more positively by supporters of right-wing parties in other regions, too, including supporters of Argentina President Javier Milei’s La Libertad Avanza, former Brazilian President Jair Bolsonaro’s Liberal Party, Israeli Prime Minister Benjamin Netanyahu’s Likud Party, and the People Power Party of former South Korean President Yoon Suk Yeol. Views by religion and ethnicity Among Israelis, there is a stark divide in views of Trump by ethnicity: 83% of Jewish Israelis have confidence in Trump, while 18% of Arab Israelis say the same. A majority of Arab Israelis have no confidence at all in Trump (58%), while 45% of Jewish Israelis have a lot of confidence in him. Related: Israeli Public is Increasingly Skeptical About Lasting Peace In India, 54% of Hindus have confidence in Trump, compared with 39% of Muslims. Among Nigerians, similar shares of Christians (81%) and Muslims (74%) have confidence in Trump. Comparing confidence in Trump and Biden Attitudes toward Trump are generally low compared with assessments of his predecessor, President Joe Biden. In 13 countries, confidence in Trump is down significantly from the ratings Biden received last year. The biggest drops are in Sweden (-48 points), Germany (-45), Poland (-40) and the Netherlands (-40). Trump’s ratings are higher than Biden’s in Hungary (+24), Nigeria (+13), Israel (+12), Turkey (+8), India (+8) and South Africa (+5). Since last year, there have also been shifts in the confidence ratings of the U.S. president by ideology. In many countries, people on the ideological left give Trump far lower ratings this year than they gave Biden last year. For example, in the UK, 18% of those on the left express confidence in Trump, compared with 39% for Biden in 2024. In contrast, 59% of those on the right view Trump positively, compared with 33% for Biden last year. Trump also fares much better this year than Biden did last year among supporters of right-wing populist parties in Europe, including supporters of Fidesz in Hungary (+69), Reform UK (+29), Greek Solution (+23), Lega in Italy (+19) and AfD in Germany (+18). And among people with a favorable view of AfD, Fidesz and Reform UK, confidence in Trump is the highest it’s been during any of his years in office. In some

2. Confidence in Trump Read More »

10. Religion in Europe

As of 2020, Europe has about 753 million inhabitants, only 2% more than in 2010. Roughly two-thirds of Europeans in 2020 are Christians, and a quarter are religiously unaffiliated. Around 6% of Europe’s residents are Muslims. In many European countries, there has been a decades-long pattern of religious “switching,” with people who were raised as Christians becoming religiously unaffiliated. This widespread disaffiliation has contributed to the thinning of Europe’s Christian population and the swelling of the ranks of the religiously unaffiliated. Between 2010 and 2020, France and the United Kingdom lost their Christian majorities, and the Netherlands gained an unaffiliated majority. Religious change Between 2010 and 2020, the absolute number (or count) of Christians dropped by 9% to 505 million. Jews also decreased in count, by 8%, to 1.3 million in 2020. Meanwhile, every other major religious group grew in number in Europe. The religiously unaffiliated expanded the most, numbering 190 million in 2020 (up 37%). Muslims increased to 46 million (up 16%). Europe’s relatively small Hindu population also grew substantially, rising to 2 million (up 30%). There were also changes in the percentages (or shares) these groups made up of Europe’s overall population. The biggest driver of change between 2010 and 2020 was religious disaffiliation: The share that Christians made up of the region’s population dropped to 67% (down 8 percentage points), while the share of religiously unaffiliated people rose to 25% (up 7 points). Every other group saw less than a 1-point change over the decade. Immigration to Europe from Muslim-majority countries elsewhere in the world generated a lot of public discussion between 2010 and 2020, particularly as many refugees arrived from Syria. Overall, the share of Europe’s population that is Muslim grew by less than 1 percentage point, to 6% in 2020, but the change was not evenly distributed. In Sweden, where government policies toward Syrian refugees were generous, Muslims grew to make up 8% of the country’s inhabitants (up 4 percentage points, or roughly double the share of Sweden’s population that Muslims had been in 2010). Muslims also increased as a share of the overall population by about 4 points in Albania, where they already made up a majority in 2010. The Muslim share was more stable in other European countries. For example, in Germany, where then-Chancellor Angela Merkel’s welcoming stance toward Muslim refugees in 2015 was highly controversial, Muslims grew by about 1 percentage point as a share of the country’s population, making up 7% of the country’s residents in 2020. Substantial change within countries Among regions, Europe has the largest number of countries (23) that experienced a substantial change (of 5 percentage points or more) in at least one religious group’s share of the population. Every such change in the region reflected declining percentages of Christians. In most of these countries (20), religiously unaffiliated people increased as a share of the population by at least 5 points. How is ‘substantial change’ defined? This section highlights countries that experienced substantial change in the size of their religious populations between 2010 and 2020. We focus on cases where a religious group’s share of a country’s population grew or shrank by at least 5 percentage points. We set that threshold because wide variations in data sources make it difficult to test the statistical significance of differences in population estimates in 2010 and 2020. Refer to the Methodology for details. The largest shift, in terms of percentage point change, occurred among Christians in the United Kingdom, where Christians shrank to just under half of the UK’s population (down 13 points). At the same time, religiously unaffiliated people increased to 40% of the UK population (up 11 points). A slightly larger change among the religiously unaffiliated occurred in Estonia, where they grew to represent 44% of the country’s population (up 12 points). In Europe, two countries – France and the UK – had Christian majorities in 2010 and no longer do. Meanwhile, the Netherlands became the second unaffiliated-majority country in Europe, joining the Czech Republic. Aside from Christians and unaffiliated people, no religious group saw its share in any European country change by 5 percentage points or more between 2010 and 2020. Median age of religious groups Europeans are older, on average, than people in any other region, with a median age of 42. Europe has slower population growth than other regions largely because of relatively low fertility rates and large percentages of older adults. In fact, the populations of some European countries would have shrunk since 2000 if not for immigration, because deaths have outpaced births. Muslims are the youngest religious group in Europe, with a median age of 34. The median age of European Jews – the oldest group in the region – is approximately 53. Hindus (36 years), religiously unaffiliated people (39) and Buddhists (40) all have median ages below the region’s overall figure. We do not have sufficient data on adherents of other religions in Europe to reliably estimate their age structure. As with Jews, Christians (45) tend to be older than other Europeans. Recommended Citation: Hackett, Conrad, Marcin Stonawski, Yunping Tong, Stephanie Kramer, Anne Shi and Dalia Fahmy. 2025. “How the Global Religious Landscape Changed From 2010 to 2020.” Pew Research Center. doi: 10.58094/fj71-ny11. source

10. Religion in Europe Read More »

13. Religion in North America

North America – comprised in this report of the United States and Canada – had 378 million inhabitants in 2020, a 9% increase since 2010. Christians are by far the largest religious group in the region (63%), followed by religiously unaffiliated people (30%). All other groups, including Jews, Muslims, Buddhists and Hindus, each account for less than 2% of the population. In the period from 201o to 2020, North America experienced large shifts in the shares of two religious categories: a steep drop in Christians as a percentage of the region’s overall population, and a corresponding rise in the percentage of the population that is religiously unaffiliated. The prevailing pattern of change in the region is religious disaffiliation, particularly by people who say they were raised Christian but who have stopped identifying with any religion in adulthood. Religious change Christians were the only group in the region that declined in absolute number (or count) from 2010 to 2020, falling below 240 million (down 11%). Meanwhile, the number of religiously unaffiliated people almost doubled to 114 million (up 92%). Several religious groups with smaller footprints in the region grew much faster than the region’s population overall. North American Muslims now number about 6 million (up 52%). People in the “other religions” category (up 62%) and Buddhists (up 27%) each have grown to more than 5 million. There also are about 4 million Hindus in the region, up 55% from 2010. Most of the growth of Muslim and Hindu populations in the U.S. and Canada can be attributed to immigration. North America’s Jewish population grew by only a few tens of thousands over the decade (up less than 1%), due to a relatively old age structure, low fertility rates and the absence of any major, new wave of Jewish immigration since the collapse of the Soviet Union. (For consistency with other religious groups, the definition of Jewishness in North America is based on self-identification with Judaism as a religion. It does not include people who describe their current religion as atheist, agnostic or “nothing in particular” but who consider themselves Jewish for reasons aside from religion, such as ancestry, culture or family background. Refer to Chapter 8 for more details.) In terms of the percentage (or share) that each group made up, North America saw the two largest changes of any region: Christians dropped by 14 percentage points to 63% of the region’s population in 2020, while religiously unaffiliated people rose by 13 points to 30% of the population. Every other group’s share of the population changed by less than 1 percentage point between 2010 and 2020. Substantial change within countries Between 2010 and 2020, both the U.S. and Canada experienced drops of about 14 percentage points in the share of their populations that are Christian. Christians now make up an estimated 64% of all U.S. residents and 53% of Canada’s inhabitants. Both countries’ religiously unaffiliated populations grew substantially over the same period (by at least 5 percentage points). How is ‘substantial change’ defined? This section highlights countries that experienced substantial change in the size of their religious populations between 2010 and 2020. We focus on cases where a religious group’s share of a country’s population grew or shrank by at least 5 percentage points. We set that threshold because wide variations in data sources make it difficult to test the statistical significance of differences in population estimates in 2010 and 2020. Refer to the Methodology for details. As of 2020, about 30% of U.S. residents (of all ages) do not identify with any religion, an increase of 13 points since 2010. In Canada, religiously unaffiliated people made up about 35% of the population in 2020, up 11 points since 2010. Median age of religious groups The median age of religious groups in North America ranges from 28 among Muslims to 44 among Christians. North America’s overall median age is 39 – the second-highest of any region of the world (after Europe, where the median age is 42). In addition to Christians, Buddhists (43) and Jews (44) have higher median ages than the region overall. By comparison, Hindus (30) and the religiously unaffiliated (31) have relatively young populations in the region. Recommended Citation: Hackett, Conrad, Marcin Stonawski, Yunping Tong, Stephanie Kramer, Anne Shi and Dalia Fahmy. 2025. “How the Global Religious Landscape Changed From 2010 to 2020.” Pew Research Center. doi: 10.58094/fj71-ny11. source

13. Religion in North America Read More »

9. Religion in Asia and the Pacific

As of 2020, the Asia-Pacific region is home to 4.5 billion people, 10% more than in 2010. This large and religiously diverse region – where no single religious group constitutes a majority of the population – includes more than 1 billion each of Hindus, Muslims and religiously unaffiliated people. The region also has hundreds of millions of Buddhists, Christians and people in the “other religions” umbrella category. The vast majority of the world’s Hindus (99%) and Buddhists (98%) live in the Asia-Pacific region. Most of the world’s Muslims (59%), adherents of other religions (65%) and religiously unaffiliated people (78%) also reside in this region. The heavy concentration of all these groups in Asia and the Pacific is due to the region’s religious diversity and history, as well as its massive population (a majority of the world’s inhabitants). Hinduism, Buddhism and many religions that fall into the “other religions” category – including Daoism (also spelled Taoism), Jainism, Shintoism and Sikhism – were founded in the region. Nearly 95% of the world’s Hindus live in one country: India, where Hindus make up 79% of the nation’s 1.4 billion people. Adherents in the “other religions” category make up less than 3% of India’s population as of 2020, but even that small share is a lot of people. India contains 21% of all the people in the world who belong to the “other religions” category. (For more about India’s religious landscape, refer to our 2021 report on how the religious composition of India changed from the 1990s through 2010.) A majority of the world’s religiously unaffiliated people live in China (67%), which was the world’s most populous country in 2020, though it has since been surpassed in size by India. Fully 90% of China’s population is religiously unaffiliated. (Refer to our 2023 report “Measuring Religion in China” for additional context, including a summary of recent Chinese government policy toward religion.) Religious change Most groups in the Asia-Pacific region grew in absolute number between 2010 and 2020. Growth in population count was greatest for Muslims (up 16%), Hindus (up 12%) and the religiously unaffiliated (up 10%). As of 2020, the religiously unaffiliated were the largest group in the region, with nearly 1.5 billion people. Muslims and Hindus each numbered about 1.2 billion. Buddhists are the only group that shrank in number, to 316 million in 2020, down 6% over the preceding decade. This decline was partly due to religious disaffiliation, particularly in some East Asian countries with large Buddhist populations. In addition, Buddhism is declining for demographic reasons, including relatively low fertility rates and an older age distribution. There were modest changes in the percentage (or share) that each religion made up of the region’s overall population. The share of the region’s population that is Muslim grew to 26% (up about 1 percentage point), while the share of the population that is Buddhist decreased by about 1 point, to about 7%. Overall, the share of the region’s population that is religiously unaffiliated was stable. However, this stability masks more complex patterns at the individual country-level. Substantial change within countries Several countries in the Asia-Pacific region saw a substantial shift (of at least 5 percentage points) in one or more religious group’s share of the total population between 2010 and 2020. The religiously unaffiliated grew considerably in five countries (Australia, New Zealand, South Korea, Vietnam and Japan), while Christians shrank in three (Kazakhstan, New Zealand and Australia). Buddhists declined in South Korea and Muslims grew in Kazakhstan. How is ‘substantial change’ defined? This section highlights countries that experienced substantial change in the size of their religious populations between 2010 and 2020. We focus on cases where a religious group’s share of a country’s population grew or shrank by at least 5 percentage points. We set that threshold because wide variations in data sources make it difficult to test the statistical significance of differences in population estimates in 2010 and 2020. Refer to the Methodology for details. Australia showed the most change. Between 2010 and 2020, Australia’s Christian population fell from 67% to 47% of the country’s total population (down 20 points), while the religiously unaffiliated grew to represent 42% of the country’s inhabitants (up 17 points). Australia is one of four countries around the world that had a Christian majority in 2010 but not in 2020. Median age of religious groups The age structure of populations varies greatly by religion across Asia and the Pacific. Three groups – Muslims (26 years), Hindus (29) and Christians (31) – have median ages that are lower than the region’s overall median age (32). The figure is much higher among religiously unaffiliated people (38), Buddhists (40) and Jews (40). The age patterns by religion in Asia and the Pacific mirror those in other regions. Globally, Muslims have the lowest median age of all major religious groups, followed by Hindus; most members of these two religions around the world are under 30. Christians, followers of other religions, and religiously unaffiliated people are the next-youngest groups, both in the Asia-Pacific region and worldwide. Both in the Asia-Pacific region and globally, Buddhists and Jews have the highest median ages. Recommended Citation: Hackett, Conrad, Marcin Stonawski, Yunping Tong, Stephanie Kramer, Anne Shi and Dalia Fahmy. 2025. “How the Global Religious Landscape Changed From 2010 to 2020.” Pew Research Center. doi: 10.58094/fj71-ny11. source

9. Religion in Asia and the Pacific Read More »

12. Religion in the Middle East and North Africa

As of 2020, the Middle East-North Africa region – the birthplace of Judaism, Christianity and Islam – is home to 440 million people, up 24% since 2010. Muslims make up the vast majority of the region’s population (94%). There is no other major geographic region with such a high concentration of a single religion. While most of the world’s Muslims live elsewhere, the Middle East-North Africa region is the only large region with a Muslim majority. Christians are the largest minority group in the region, representing 3% of its population, and they are heavily concentrated in Egypt. Fewer than 2% of residents in the Middle East-North Africa region – or 7 million people – are Jewish, almost all of whom live in Israel. Hindus, Buddhists, religiously unaffiliated people and adherents of other religions – many of whom are Druze living in Lebanon and Israel – each make up less than 1% of the region’s population. Gulf Cooperation Council countries, such as Saudi Arabia and the United Arab Emirates, have attracted non-Muslim migrants, boosting the absolute numbers of several religious groups in the broader region. Religious change Every group grew in number (or count) between 2010 and 2020. The region’s small Hindu population grew the most rapidly (up 62%), followed by the even smaller religiously unaffiliated population (up 41%). Meanwhile, Muslims grew to 414 million (up 24%), and the Jewish population grew to nearly 7 million (up 18%). Christians increased their numbers to an estimated 13 million (up 9%), the lowest growth rate in the region. There were only small changes in the percentage (or share) of people represented by each group in the region. The largest change was a 0.4-point decrease in the share that Christians make up of the region’s total population. Substantial change within countries Lebanon and Oman are the only two countries in the Middle East-North Africa region that experienced a substantial change (of at least 5 percentage points) in a religious group’s share of their overall population. How is ‘substantial change’ defined? This section highlights countries that experienced substantial change in the size of their religious populations between 2010 and 2020. We focus on cases where a religious group’s share of a country’s population grew or shrank by at least 5 percentage points. We set that threshold because wide variations in data sources make it difficult to test the statistical significance of differences in population estimates in 2010 and 2020. Refer to the Methodology for details. In Lebanon, the share of the population that is Muslim rose to 68% (up 5 points), while the Christian population declined by about the same amount, to 28% of all residents of Lebanon. Much of the change was due to a large influx of Muslim refugees from Syria. Lebanon hosts the second-largest number of Syrian refugees (after Turkey) and has the highest concentration of Syrians relative to its population size – roughly one-in-five residents of Lebanon is a Syrian refugee. But the decline in the Christian share of Lebanon’s population also results from a decrease in the absolute number of Christians residing in the country. In Oman, the share of the population that is Muslim declined to 82% (down 8 points). Hindus and Christians made up rising shares of Oman’s population from 2010 to 2020 as a result of immigration, especially from India. Over the decade, immigrants accounted for most of Oman’s overall population increase of 1.8 million. Median age of religious groups The Middle East-North Africa region has a relatively young population, with a median age of about 25. The only major region of the world with a younger population is sub-Saharan Africa. Muslims tend to be younger than Jews in the Middle East and North Africa; Jews living in the region (primarily in Israel) had a median age of about 31, as of 2020. (We do not have sufficient data on people in other religious categories across the Middle East and North Africa to reliably estimate their age structure.) Recommended Citation: Hackett, Conrad, Marcin Stonawski, Yunping Tong, Stephanie Kramer, Anne Shi and Dalia Fahmy. 2025. “How the Global Religious Landscape Changed From 2010 to 2020.” Pew Research Center. doi: 10.58094/fj71-ny11. source

12. Religion in the Middle East and North Africa Read More »