CFA Institute

What Is the Future of Investing? Augmented Intelligence

Since its inception, the global financial system has evolved to manage increasing complexity with greater efficiency whilst its fundamental role as facilitator of Pareto-efficient resource allocation has remained intact. So successful has finance been in allocating resources that it has become a primary driver in the creation of negative externalities –- particularly environmental degradation — which pose a significant risk to future economic and social development. This blog post presents an advanced framework for seamlessly integrating “augmented intelligence” into investment decision-making processes. By leveraging a symbiotic relationship between human intelligence, artificial intelligence (AI), and sustainability, augmented intelligence seeks to redefine investment management paradigms. What is the Purpose of Financial Markets? Financial markets are complex adaptive systems (Lo, 2004). Their essential purpose consists of facilitating an efficient allocation of resources among their participants (Mishkin, 2018; Ross & Westerfield, 2016; Fabozzi & Modigliani, 2009). This purpose has not changed since Luca Pacioli introduced double-entry bookkeeping in 1494, the first stock exchange was launched in Amsterdam in 1602, or the interpretation of efficient allocations became standardized and scalable through Harry Markowitz et al. in 1952. What has changed throughout financial market history is the degree of complexity participants have had to master to achieve an efficient allocation. This degree of complexity is determined by the scope of the system and the dynamics within it. Humanity has extended the scope of factors to be considered for an efficient allocation decision over time. Financialization, globalization, and digitization have been dominant drivers in this extension of scope. Today, market participants can allocate their resources across a global capital stock of $795.7 trillion (Vacchino, Periasamy, & Schuller, 2024), which is unprecedented in human history. To master the increased dynamics within the system with its widened scope, market participants have had to adapt their interactions, evolving their traditional belief systems about markets to apply more insightful assessment techniques that seek to understand market complexity. This shift has led to a focus on which behaviors best contribute to integrating different sources of evidence into decisions at the point of allocation. Reasoning has morphed from deductive to inductive (Schuller, Mousavi, & Gadzinski, 2018), leading to an ever more accurate assessment of the dynamics within the financial system. Complex systems produce emergent phenomena, properties that can only be studied at a higher level. The intricate, non-linear interactions between the components of complex systems give rise to new, often unexpected properties or behaviors that cannot be explained simply by examining the system’s individual parts. Emergence is thus a natural consequence of complexity, where the whole becomes more than the sum of its parts. A primary emergent property in the history of financial markets is the dominance of humankind over nature, which came to the fore following the Scientific Revolution in the late 15th century. This dominance has led to an unprecedented density of breakthroughs by humankind, equipping itself with ever more refined and scalable tools to master complexity. Mastering Planetary Time Through Financial Systems As is common for complex adaptive systems, what started as a side effect — a negative externality — has turned into a dominant factor influencing the system. Currently, the financial system is learning how to integrate factors beyond a human-centered worldview. We have entered an era when time is no longer differentially distributed along human and non-human scales. Planetary Time represents the synchronization of human and ecological temporalities, a concept essential for addressing climate change and resource exploitation. As facilitators of capital flow, financial markets are uniquely positioned to drive this synchronization. This requires a paradigm shift from short-term profit maximization to sustainable, long-term value creation. With the necessity for humankind to reintegrate into the homeostasis of planet Earth, the purpose of financial systems — namely facilitating an efficient allocation of resources among its participants — is set in a new context. This leads to the question of how to design a financial system that adopts augmented intelligence (AI, human intelligence, and sustainability) to master the era of planetary time? Academia and practitioners are treating these three elements in silos and is acting too slowly to break through those walls to integrate them into a holistic decision design. What is the status quo for each silo? Human Intelligence in Investment Management Over the past 40 years, behavioral finance has advocated for evidence-based decision-making. We now know significantly more about the quantity of biases and why we tend to make investment decisions full of noise and bias. We have not done enough to help participants in the global financial ecosystem bridge the knowing-doing gap, however, which is essential for accelerating the diffusion of innovation. Either professional investors tend to talk more about behavioral finance than make use of its insights, or debiasing cognitive biases only has a temporary effect (Gadzinski, Mousavi, & Schuller, 2022). What has become more prominent academically is the focus on applied behavioral considerations, such as behavioral design configurations. The intent is not only to raise awareness of cognitive dissonances and their effects, but also to make it easier for decision-makers to improve such configurations with low cognitive effort. Awareness training has proven to be ineffective because it is too superficial in its impulse to facilitate behavioral change (Fleming, 2023). Alternatively, high-performance principles for designing an investment decision support system that produces evidence-based decisions are increasingly being explored (Schuller, 2021). Sustainability in Investment Management Sustainability considerations in the financial system are a possible gateway for augmented intelligence to create the impact in the real economy that is needed to reintegrate humankind into the homeostasis with planet Earth. These considerations have a long, though not critically impactful, history in finance. Many investment leaders recently have embraced sustainable development goals (SDG)-driven investing as a must have for the practice of good investment management. The road to necessity has taken decades to build (Townsend, 2020). However, a compliance-driven approach often relegates sustainability to administrative burdens rather than core investment strategies. What policymakers and regulators have only recently accepted is their inability to be the primary driver to initiate,

What Is the Future of Investing? Augmented Intelligence Read More »

Europe Rearms: What Defense Spending Means for Markets

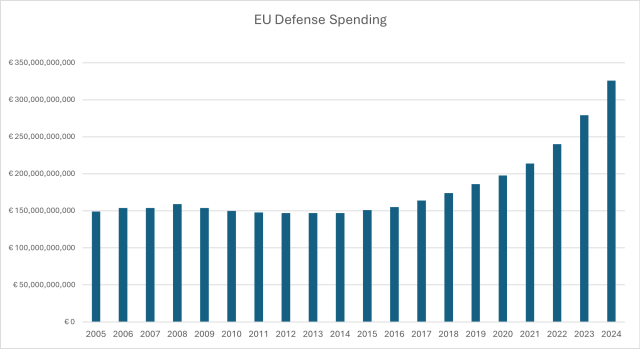
Europe is rearming at an unprecedented pace — and the investment implications are just beginning to unfold. After decades of post–Cold War retrenchment, defense budgets across the continent are rising sharply, driven by renewed focus on European security. What began as a response to Russia’s invasion of Ukraine has evolved into a broader economic and industrial transformation. For financial analysts and investors, this shift presents a rare convergence of macro transformation and micro opportunity. As defense spending becomes a pillar of EU economic policy, it is reshaping fiscal dynamics, deepening capital markets, and driving significant revaluation in the defense and aerospace sectors. Understanding how national strategies intersect with EU-level initiatives like ReArm EU will be critical for assessing sovereign risk, sector exposure, and long-term positioning in European portfolios. This post examines how Europe’s defense spending accelerated after Russia’s invasion of Ukraine, with further momentum in recent months. It explores the rollout of the ReArm EU initiative, changes to national budgets and fiscal rules, and how these policy developments are reshaping market opportunities across the continent. ReArm EU: Coordinating Defense, Reshaping Capital Flows A decisive increase in defense spending began in 2022. In March 2025, the European Commission unveiled the ReArm EU program, aiming to mobilize €800 billion for European defense this decade. Rather than a single fund, ReArm EU is a package of measures to reshape defense financing in the EU. First, the EU proposes exempting defense investments from deficit limits, giving member states greater fiscal flexibility. This could unlock an additional €650 billion in national defense spending over four years. It may also boost demand across the continent, including in countries that do not increase spending directly. The plan includes €150 billion in EU-backed loans to support joint investment in air and missile defense, artillery, drones, cyber defense, and military mobility. The aim is to reduce costs, achieve scale, and expand Europe’s capacity to produce essential weapons systems. The financing mechanism would leverage the EU’s common budget by using unused capacity to back EU bond issuance. Some member states remain cautious about common borrowing and the potential shift in fiscal authority to Brussels. The European Commission also proposes redirecting economic cohesion funds to defense and encouraging private investment, including through the European Investment Bank. Security is increasingly seen as essential to economic stability. Instruments like the European Defence Fund (for R&D) and the European Peace Facility (which reimburses members for arms sent to Ukraine) support collective efforts. The broader goal is to strengthen Europe’s defense industrial base and reduce fragmentation. Many EU militaries use different equipment, creating inefficiencies. Initiatives like ReArm EU and the PESCO framework promote joint development and procurement. A more integrated European Defense Technological and Industrial Base (EDTIB) would improve readiness and keep more procurement within the EU. As of 2023, only 18% of EU defense procurement was done jointly, well below the 35% benchmark. This push represents a continent-wide industrial policy shift. In 2024, defense investment exceeded €100 billion, or 30% of all EU defense spending, marking a shift toward procurement and R&D over personnel and legacy systems. National Defense Budgets: Fragmentation Risk? While the EU promotes coordination, fragmentation persists. Europe’s defense industry remains largely national, with limited cross-border integration. Countries differ in their procurement strategies and defense priorities. Poland is NATO’s fastest-growing defense spender, with its budget projected to reach 4.7% of GDP in 2025. Finland and Sweden, both now NATO members, have increased spending to 2.4% of GDP. Sweden aims to reach 3.5% by 2030. France plans a 30% nominal spending increase by 2030. Germany’s shift has been especially notable. Long known for modest military spending and strict budget rules, Germany announced a “Zeitenwende” (turning point) after the Ukraine invasion. It established a €100 billion fund to modernize its military and pledged to exceed 2% of GDP in defense spending. Its defense budget has nearly doubled to €70 billion since 2021. A more recent plan outlines a €500 billion multi-year commitment that would make Germany’s military among the world’s largest. Investors view this increase in debt-financed spending as a potential shift toward Europe becoming a more credible safe haven with some reduction in perceived geographic equity risk. Market Implications of the Defense Spending Surge The increase in European defense spending has long-term implications for markets. For investors, both national and EU-level initiatives open new opportunities in defense. European aerospace and defense stocks have rallied since 2022, with additional gains following recent political developments. Higher defense budgets imply growth for contractors, infrastructure, and innovation in aerospace and cybersecurity. Order backlogs are growing and valuations are rising. At the macro level, rising defense budgets and relaxed fiscal rules will likely lead to higher deficits. Yet this new wave of spending may support growth and counterbalance global trade headwinds. The EU’s growing role as a debt issuer could deepen capital markets integration and enhance the euro’s status as a reserve currency. At the micro level, European defense and aerospace firms stand to benefit significantly. Germany’s Rheinmetall, France’s Dassault, and Airbus have seen strong demand. Italy’s Leonardo and the UK’s BAE Systems are expanding contracts and production. As margins widen and investor sentiment improves, these firms may become a lasting feature in industrial portfolios. Key Takeaways For financial analysts and investors, the rise of defense spending in Europe is more than a policy shift — it’s a structural re-rating of risk and opportunity across the continent. At the macro level, increased public investment could provide a countercyclical buffer to trade-related headwinds, while deepening euro-area capital markets through expanded sovereign and EU-level debt issuance. At the micro level, European defense contractors stand to benefit from years of elevated spending, with growing backlogs, pan-European procurement, and a new wave of industrial policy support. The challenge ahead is assessing how durable this rearmament trend will be and whether national divergence or EU coordination will shape the defense sector’s next phase. Either way, defense may be emerging as a new strategic pillar of European growth and a critical theme for

Europe Rearms: What Defense Spending Means for Markets Read More »

When Tariffs Hit: Stocks, Bonds, and Volatility

It’s been only a little more than a month since the US Presidential election, and already analysts’ heads are spinning over the potential impact of trade policy. President-elect Trump has made numerous tariff threats, leaving researchers to wonder which, if any, he’ll follow through on — and what the consequences for asset prices might be. Academic economists overwhelmingly dislike tariffs for a variety of reasons. Chief among them is that they help the few at the expense of the many and likely sap long-term economic growth.[i]   Recent research suggests that the targeted tariffs in 2018 and 2019 had only a brief effect on financial markets.[ii] In a Liberty Street blog, economists at the New York Fed showed that large-cap US equities responded negatively to tariffs imposed during the first Trump Administration at the time of their announcement, but not before. [iii] That is when tariffs hit, stocks fell, at least for a time. Specifically, researchers found that US stocks fell on the day tariffs were announced (tariff day), and that this change was robust to other economic news that might plausibly affect stock prices. In this blog, using a similar but simpler approach, I extend parts of their analysis to small-cap US equities and small-cap equities in major foreign markets. I explicitly show the change in response to tariffs of a safe asset (the 10-year US Treasury) and expected volatility (as proxied by the VIX). Additionally I test the claim that average returns on tariff announcement days were indeed different from non-tariff-announcement days. I confirm that tariff announcement days were indeed bad for equities, here and abroad. Safe-haven assets (proxied by the U.S. 10-year Treasury) protected capital, just as an investor would have hoped. Tariffs also appear to have had no lasting effects on expected US stock market volatility. The VIX reverts to pre-tariff levels quickly after a tariff shock. These responses are unlikely to have happened by chance — though we can’t rule out possible bias. My analysis is performed in R, and data used is available from Yahoo Finance and FRED. Tariff dates are taken from the New York Fed’s blog.[iv] For those who want to replicate or change the analysis, R Code is available online. What Happened on Tariff Day? Table 1 shows, by tariff day date, the one-day price-return percentage change for the S&P 500 index (sp_chg), the Russell 2000 index (rut_chg), the FTSE 100 index (ftse_chg), the DAX index (dax_chg), the Nikkei 225 index (nikkei_chg), and the Hang Seng index (hsi_chg) on the 10 days Tariffs were imposed. In the case of the VIX (vol_chg) 10-year U.S. Treasury (ten_chg), differences in levels are used. On some tariff-announcement dates, certain foreign markets were closed, in which case returns were “NA.” Tariff announcements on average coincided with falling equity markets, rising 10-year US Treasury prices, and heightened expected volatility, as the New York Fed’s researchers found. Table 1. What happened when the 2018 and 2019 tariffs hit. date sp_chg rut_chg ftse_chg dax_chg nikkei_chg hsi_chg vol_chg ten_chg 2018-01-23 0.217 0.345 0.213 0.712 1.292 1.659 0.070 -0.030 2018-03-01 -1.332 -0.335 -0.778 -1.969 -1.558 0.647 2.620 -0.060 2018-03-22 -2.516 -2.243 -1.227 -1.698 NA -1.093 5.480 -0.060 2018-03-23 -2.097 -2.189 -0.442 -1.767 -4.512 -2.452 1.530 -0.010 2018-06-15 -0.102 -0.048 -1.698 -0.737 0.498 -0.429 -0.140 -0.010 2018-06-19 -0.402 0.058 -0.359 -1.217 -1.772 NA 1.040 -0.030 2019-05-06 -0.447 0.059 NA -1.014 NA -2.898 2.570 -0.030 2019-05-13 -2.413 -3.178 -0.550 -1.519 -0.720 NA 4.510 -0.070 2019-08-01 -0.900 -1.515 -0.025 0.526 0.090 -0.763 1.750 -0.120 2019-08-23 -2.595 -3.088 -0.466 -1.154 0.402 0.501 3.190 -0.100 MEAN -1.259 -1.213 -0.593 -0.984 -0.785 -0.604 2.262 -0.05 Source: Yahoo Finance, FRED Effect Significance The changes in Table 1 appear large, but they could be due to chance. To strengthen the main finding that tariffs are bad for stocks, at least in the short run, I estimate models of the form: Daily Change = Constant + Tariff + Error, where Tariff is a dummy variable using simple linear regression. Results from this comparison of means are reported in Table 2. Estimates of the effect of tariffs are shown in the first row (Tariff), while average returns on non-tariff days are shown in the second row (Constant). Standard errors are in parenthesis below each estimate, and significance is denoted by asterisks using the typical convention, as explained in the table note.   Mean values in the last row of Table 1 are of course exactly equal to Tariff coefficient plus constant estimates in Table 2. We didn’t need to run regressions to estimate the mean effect. Rather, the value in this exercise is in the error estimates, which allow us to determine significance. Table 2. Regression results. Dependent variable sp_chg rut_chg ftse_chg dax_chg nikkei_chg hsi_chg vol_chg ten_chg Tariff -1.321*** -1.258** -0.605* -1.022*** -0.818* -0.585 2.273*** -0.053*** (0.394) (0.506) (0.343) (0.390) (0.461) (0.522) (0.660) (0.018) Constant 0.062** 0.045 0.013 0.038 0.033 -0.019 -0.011 0.001 (0.030) (0.038) (0.025) (0.030) (0.033) (0.037) (0.050) (0.001) Observations 1,743 1,743 1,679 1,689 1,549 1,589 1,743 1,742 R2 0.006 0.004 0.002 0.004 0.002 0.001 0.007 0.005 Note: *p<0.1; **p<0.05; ***p<0.01 Source: Yahoo Finance, author’s regressions The effect of tariff announcements on large-cap stocks is highly significant (t-statistic = 3.4), while the effect on small-cap stocks is less so (t = 2.5). The accuracy of the estimate of foreign markets to tariff announcements is a mixed bag. Only the DAX’s response estimated remotely accurately (t = 2.6). Interestingly, Hang Seng index mean returns aren’t different, statistically, on tariff announcement days. On these days, tariffs appear to hurt US and other developed-market equities more than Chinese equities. Meanwhile, reactions of safe assets (t = 2.9) and volatility (t = 3.4) to tariffs are of the expected sign and reasonably strong. (Technical note: using “robust” standard errors doesn’t change these conclusions). The skeptical reader may still question causality. My simple model has no controls. I haven’t attempted to rule out other possible influences on the dependent variable. The New York Fed’s researchers, however, did do this — admittedly only for US equities — and it didn’t

When Tariffs Hit: Stocks, Bonds, and Volatility Read More »

Climate Change, Risk Management, and the Freedom to Invest Responsibly

Risk management is so simple a concept and so central to financial analysis that it feels superfluous to even mention it. Yet when it comes to climate change and sustainability, efforts are under way across the United States to impede our ability as investors to conduct simple risk management. Policymakers have proposed and even passed laws that make it more difficult, if not illegal, for investors to consider the financial risks of climate change. These efforts are misguided. The freedom to invest responsibly and the principle of risk management must be defended, and that requires us to go back to basics. Does climate change pose financial risk? The answer is clear. Drought, heat waves, and extreme weather all exact a signficant toll from infrastructure, supply chains, facilities, and people. Indeed, the United States recorded $165 billion in losses from climate disasters just last year. But the climate crisis also presents enormous opportunity. The Inflation Reduction Act has driven a clean energy boom across the country. Investors should not have to sit it out. Informed by these facts, investors have increasingly integrated climate considerations into their decision making precisely because the financial effects are so clear. They are acting on sound, rational logic, and governments should not interfere with that process. Yet some states have instituted new laws forbidding investors from taking climate change impacts into account when assessing bond issuances, pension fund management, and other government contracts. In effect, they are penalizing risk management. Ignoring a financial risk does not make it go away; it only makes it worse. Whether on individual balance sheets or across a national economy, failing to account for and address potential threats has a significant downside. Investors need data to assess these risks and the freedom to act on that data based on their business considerations. Their fiduciary duty requires it. When investors lack these essentials, markets are less efficient and less effective, and everyone invested in those markets suffers. If there are fewer financial institutions competing in the marketplace, states will be forced to pay millions more in extra interest payments. And if states work only with institutions that do not consider climate- and sustainability-related risks, they will expose their pension funds, beneficiaries, and taxpayers to the downsides of those risks. Most investors understand the threat and are responding as they should: by studying the data, following the trends, and keeping a watchful eye out for risks and opportunities. But being rational market actors isn’t enough. That’s why investors and private and public sector leaders have joined together to urge policymakers to protect every investor’s right to incorporate climate and sustainability risks into their decision making. They are making a clear statement that executing their fiduciary duty should not be subject to government interference. Such interference will only make it harder for them to do their jobs and serve their clients. That is why we all need to stand up, speak out, and demand the freedom to invest responsibly. If you liked this post, don’t forget to subscribe to Enterprising Investor. All posts are the opinion of the author. As such, they should not be construed as investment advice, nor do the opinions expressed necessarily reflect the views of CFA Institute or the author’s employer. Image credit: ©Getty Images / trekandshoot Professional Learning for CFA Institute Members CFA Institute members are empowered to self-determine and self-report professional learning (PL) credits earned, including content on Enterprising Investor. Members can record credits easily using their online PL tracker. source

Climate Change, Risk Management, and the Freedom to Invest Responsibly Read More »

EAM: How and Why AI-Powered Active Management Will Dominate Passive

This article is derived from “Ensemble Active Management – AI’s Transformation of Active Management” and “Methodology, Design, and Data Integrity Validation Study of Turing Technology’s 2024 Ensemble Active Management” white paper. Numerous studies have evaluated active US equity managers’ ability to outperform index funds and exchange-traded funds (ETFs). While time horizons vary, the results tend to converge on the same result: Active managers outperform standard benchmarks less than half the time. Adding to the headwinds, active investments are structurally more expensive than their passive counterparts.  Investors don’t want to pay more for equivalent returns and are voting with their wallets. As of year-end 2023, actively managed US equity funds have experienced 18 consecutive years of net outflows totaling more than $2.5 trillion, according to Morningstar Direct. The required leap for active to once again outperform passive cannot be accomplished through incremental gains. The gap is simply too large. For active management to acquire sufficient alpha to achieve a step-change improvement, a paradigm shift driven by new technologies and new methods is required. That’s where Ensemble Active Management (EAM) comes in. EAM is built on critical new technologies and employs a stock-selection approach mirroring other industries’ best practices for conducting complex decision making. It pivots from a single manager to a multi-manager approach. In short, EAM represents the paradigm shift necessary to revitalize active management. EAM is not an academic concept. It was first introduced in 2018 and EAM portfolios launched later that year. There are now dozens of EAM track records that range in age from two to five years.  This paper lays out EAM’s construction mechanics and presents three critical validation pillars that support EAM’s results to date and explain its future potential. The data shows that as of year-end 2023, live EAM portfolios represented the country’s strongest lineup of actively managed US equity portfolios. Ensemble Active Management Defined EAM must harness substantial added alpha to outperform both traditional active and passive management. To accomplish that, we apply the proven mathematics of Ensemble Methods to portfolio management. Ensemble Methods feature a multiple-expert system that improves the accuracy of single-expert predictive algorithms or engines. This is accomplished by mathematically integrating multiple predictive models based on consensus agreement. The end result is a stronger predictive engine. Ensemble Methods are thus an artificial intelligence (AI) version of the “wisdom of experts.” For clarity, EAM does not employ Ensemble Methods to design a “smarter” portfolio manager. In fact, a defining principle of Ensemble Methods is its use of multiple predictive engines. Instead, EAM generates active security selection by integrating a multi-investment-manager platform through Ensemble Methods.  Actively managed mutual funds work within an Ensemble Methods environment because they effectively operate as predictive engines wherein managers try to “predict” which stocks will outperform. Further, substantial research shows that managers’ highest conviction stock picks do reliably outperform. EAM’s breakthrough came from the discovery of how to extract a fund’s “dynamic predictive engine” from its real-time holdings and weights. Turing Technology accesses this data through its machine learning-based fund replication technology, Hercules.ai. Launched in 2016, Hercules.ai provides real-time replication of actively managed funds. It houses data representing more than $4 trillion in assets and achieves a 99.4% correlation between the replicated fund returns and the actual fund returns. To build EAM portfolios, 10 to 12 quality mutual funds are selected from a similar investment category. Turing extracts each fund’s predictive engine by accessing its real-time holdings and weights, and then maps that data against the benchmark’s weights. The relative over- or underweight positions reflect the funds’ predictive engines. Turing then deploys these extracted predictive engines within the Ensemble Methods mathematical “engine” to generate the EAM portfolio. The final result is a portfolio of up to 50 stocks, with no derivatives, no leverage, and all holdings represented in the benchmark. EAM therefore constitutes the “consensus top picks of a dozen quality managers.” Further Understanding of Ensemble Methods The subset of machine learning known as Ensemble Methods is the key to creating new sources of alpha. Ensemble Methods are integral to nearly every major computational challenge in the world, and Giovanni Seni and John F. Elder have described them as “the most influential development in Data Mining and Machine Learning in the past decade.” There are more than 250,000 published applications of Ensemble Methods, including facial recognition, early autism detection, MRI-based tumor detection, cyber threat detection, and many more. Scaled Research:  2024 EAM White Paper The following data are excerpted from “Ensemble Active Management – AI’s Transformation of Active Management,” the largest study ever conducted to measure the performance potential of EAM. 60,000 randomly constructed portfolios of 12 funds each were built. 60,000 EAM portfolios were constructed based upon the sets of 12 underlying funds. Results were evaluated over 2016 to 2022. 333 underlying funds were used from more 140-plus fund companies representing more than $3 trillion in AUM. These funds account for more than 60% of the assets of the active US equity universe. The study covered Large Value, Large Blend, Large Growth, Small Value, Small Blend, and Small Growth style boxes, or 10,000 EAM portfolios per style box. To put the scale of this research effort into perspective, 420,000 discrete calendar year performance returns were generated (seven years each, from 60,000 portfolios). This is 20 times larger than the number of discrete calendar year returns delivered by the entire active US equity industry for the past 25 years. The results are statistically significant, and were subjected to an independent academic review, verifying the study’s methodology and results. Performance Comparison vs. Standard Benchmarks The study compared the performance of the 60,000 EAM portfolios versus their corresponding benchmark (the Russell Indexes), based on rolling one-, three- and five-year periods, as well as the full seven-year window. The results, derived from more than 560 million total data points are presented in the chart below. Two of the key metrics were Success Rates and average annual excess returns. The former measures the percentage of rolling time periods that the EAM portfolio outperformed the benchmark, with the average annual excess return reflecting the average of all rolling period relative

EAM: How and Why AI-Powered Active Management Will Dominate Passive Read More »

Venture Capital: Lessons from the Dot-Com Days

The NASDAQ 100 index hit rock bottom during intra-day trading on 10 October 2002, down 77% from its all-time high on 10 March 2000. An estimated 100 million individual investors lost $5 trillion in the stock market. It took more than 15 years for the tech-heavy index to revisit its peak. Between such dot-bombed firms as Webvan and eToys and uniconned start-ups like Theranos and FTX, when it comes to venture capital (VC), the New Economy of the late 1990s and today’s gig economy share a few commonalities. New Lexicon, Old Tricks Unlike public markets, VC is all about inside information. Proprietary deals are recipes for success. At the same time, early stage investors usually follow one trend after another instead of pursuing predictable performance. The current craze for generative artificial intelligence (AI) — 44% of minted unicorns last year operated in AI and machine learning — follows the mad but short-lived dash into non-fungible tokens (NFTs) or the metaverse, which came soon after the race into anything vaguely related to blockchain and cryptocurrencies, which likewise came on the heels of huge investments in augmented reality and electric vehicles (EVs). Two Venture Capital Bubbles    1994 to 2003 2014 to 2023 Defining the Era Dot-coms Unicorns Performance Limited or no revenues,ubiquitous losses Large revenues, larger losses Launch Locale Garage or dorm room Accelerator, co-working space,work from home (WFH) Buzzwords Eyeballs, B2B, B2C,click-and-mortar, anything “e”(eCommerce, eBanking, etc.), New Economy Big data, clickbait, blockchain, deepfake,anything “tech”(edtech, fintech, proptech, etc.),machine learning, mobile apps,gig economy Hot Sectors Online advertising, e-tailing,web portals, search engines,Internet Protocol, dark fiber Electric vehicles, virtual/augmented reality,cybersecurity, anything as a service (XaaS),crypto, artificial intelligence (AI) Ownership  Publicly listed Privately owned as well asICOs and SPACs Piling Up Losses to Scale Up  Beyond the buzzwords, one distinction between the recent tech bubble and its predecessor is a new dimension of loss-making. Today’s valuations and deal sizes exceed those of the dot-com era. In 1999, the collective losses of the 200 largest dot-coms were $6.2 billion on total annual sales of $21 billion. That year, Amazon reported a $720 million loss on sales of $1.6 billion. Twenty years later, Uber alone lost $8.5 billion on $14 billion in revenue. The bets have scaled up, yet they do not provide better odds of success. Both dot-coms and unicorns sought to establish market dominance by outspending rivals, even if they employed different tactics. In 2000, as companies were being “Amazoned,” they were losing to smaller, nimbler rivals. By contrast, when they are “Uberized,” incumbents are now losing to larger competitors. Start-ups have become better at driving sales, not at turning a profit. Ad-hoc profits are also easier to manufacture — as WeWork did with its community-adjusted EBITDA, for instance — than positive, recurring operating margins. The Unicorn Generation  Unicorns follow a market strategy first tested in the dot-com days: launch innovative business ideas and grow the top line exponentially while racking up huge losses. The trick is to ensure almost unlimited access to financing.  Thanks to unprecedented money-printing throughout the 2010s, the number of unicorns rose from fewer than 200 in 2015 to more than 600 in 2020. They passed the 1,000 mark in 2022 and now exceed 1,200. Advocates of such richly valued enterprises point to the pioneers of the internet revolution — Amazon and Google, for example — that are now among the most valuable companies in the world. They rarely mention previous market darlings like AOL and Netscape. That a handful of companies become extremely successful does not imply that a long tail of market participants will justify such august hopes.  Overcapacity is another major risk. Numerous multi-billion-dollar food delivery services emerged during the pandemic, just as dark fiber was overbuilt during the internet’s early days. As the 2015 to 2021 vintages turn into vinegar, many start-ups will meet a similar, humbling fate. While they remain under private ownership, their true worth is unclear. Stock markets can be temporarily mispriced, but eventually they offer a reality check to companies seeking to float. At its initial public offering (IPO), Instacart sold at a 75% discount to its 2021 private valuation.  Yet despite regulations introduced after the dot-com crash, stock markets remain easy to manipulate, as the initial coin offerings (ICOs) of the late-2010s and the more recent glut of special-purpose acquisition companies (SPACs) illustrate. Unfortunately for those unicorn backers hoping to attract unsophisticated punters, the blank-check bubble quickly fizzled out.  The Big Long  Until two years ago, historically low interest rates artificially turbocharged the valuation of illiquid, risky assets. Central banks’ reluctance to turn off the quantitative easing (QE) spigot amplified this trend. With easy access to cheap capital, financiers and entrepreneurs adopted behaviors distinct from those of the dot-com era. Then VC backers engineered artificially inflated valuations by introducing portfolio companies to public markets and creating “first-day pops” with the cooperation of unscrupulous underwriters. Nowadays, price jumps for newly listed tech stocks are quite tame compared with their NASDAQ counterparts in the 1990s, when open-source developer VA Linux’s stock soared 733% on 9 December 1999. Transaction volumes are also much lower. In 2019, there were 159 US IPOs, one third as many as in 1999. It is not for lack of public appetite. Rather, venture capitalists realized that by exiting early they left too much money on the table. Apple listed in 1980, almost four years after its inception, at a $1.8 billion market capitalization. Amazon’s 1997 IPO valued it at $438 million less than three years after the company launched.  Today, funding is driven by the VC firms’ desire to hold onto start-ups longer. They breed unicorns in-house, which requires bankrolling portfolio companies for several more rounds of financing. They profit by inflating valuations in the years leading up to their exit, keeping most of the value expansion under wraps. The bad news for public investors is that it is much harder to register a 100%-plus price increase if a company floats or markets itself for tens of billions of dollars, as Facebook,

Venture Capital: Lessons from the Dot-Com Days Read More »

Growth, Value, and Skewness: Are Growth Stocks a Lottery-Like Bet?

Skewness in asset returns is a perplexing phenomenon and evokes different behavior from investors. Some show a preference for stocks with significant right skewness, which much like playing the lottery, hit the jackpot every once in a while and deliver outsized returns. Other investors try to steer clear of such volatility and opt for stocks that have no skewness or even demonstrate left skewness. But how does skewness in returns relate to other factors in asset pricing? Might investors be betting on particular factors precisely because they want lottery-like skewness in their returns? To answer these questions, we constructed cross-sectional growth and value portfolios and examined the distribution of monthly returns over five-year periods. From an investing universe of all the equities traded on the NYSE and NASDAQ since 1975, we created our growth and value portfolios out of the quintile of stocks with the highest and lowest P/E ratios, respectively.  Our growth portfolio exhibited more right skewness in its returns, on average, than our value portfolio did. This held true over 6 of the 10 time periods. Growth Stocks: Monthly Returns Mean Median Volatility Skewness 1975 to 1980 3.02% 0.78% 53.24% 8.92 1980 to 1985 1.33% 0.02% 44.26% 1.10 1985 to 1990 2.04% 0.85% 55.99% 20.44 1990 to 1995 1.88% 0.38% 59.80% 10.51 1995 to 2000 3.44% 1.44% 67.22% 8.99 2000 to 2005 1.43% 0.01% 71.05% 2.54 2005 to 2010 0.71% 0.02% 48.44% 2.14 2010 to 2015 1.50% 0.90% 41.30% 7.30 2015 to 2020 6.94% 0.57% 50.22% 9.97 2020 to 2022 1.22% 0.28% 59.21% 5.10 Average 2.35% 0.52% 55.07% 7.70 Value Stocks: Monthly Returns Mean Median Volatility Skewness 1975 to 1980 2.44% 0.00% 47.26% 2.07 1980 to 1985 1.66% 0.01% 44.25% 1.94 1985 to 1990 1.26% 0.02% 48.23% 14.73 1990 to 1995 1.26% 1.02% 55.05% 2.55 1995 to 2000 1.23% 0.00% 52.13% 5.62 2000 to 2005 2.43% 1.15% 18.08% 9.31 2005 to 2010 0.68% 0.00% 48.75% 2.24 2010 to 2015 1.70% 1.02% 38.59% 1.85 2015 to 2020 0.86% 0.56% 36.92% 1.45 2020 to 2022 1.38% 0.53% 82.10% 9.30 Average 1.49% 0.43% 47.13% 5.10 So, what can we glean from these results? Our theory is that skewness tends to move based on investor preferences. That is, when a particular factor is en vogue, skewness significantly increases while it’s in fashion. For instance, growth stocks were all the rage as the dot-com bubble inflated from 1995 to 2000, and they demonstrated significant skewness while value stocks showed a distinct lack of it. Growth Stocks: Monthly Returns, 1995 to 2000 Growth’s popularity took off again in the 2010 to 2020 period, while value underperformed and again showed a lack of skewness in returns. Value Stocks: Monthly Returns, 2010 to 2015 Now, these results don’t tell us which direction the association goes, only that an association exists. The data suggest to us that when a particular asset pricing style is popular among investors, returns for that style exhibit greater skewness. In sum, investors in growth stocks may be pursuing lottery-like payouts, especially when such stocks are in style. If you liked this post, don’t forget to subscribe to the Enterprising Investor. All posts are the opinion of the author. As such, they should not be construed as investment advice, nor do the opinions expressed necessarily reflect the views of CFA Institute or the author’s employer. Image credit: ©Getty Images/piotr_malczyk Professional Learning for CFA Institute Members CFA Institute members are empowered to self-determine and self-report professional learning (PL) credits earned, including content on Enterprising Investor. Members can record credits easily using their online PL tracker. source

Growth, Value, and Skewness: Are Growth Stocks a Lottery-Like Bet? Read More »

Book Review: Trailblazers, Heroes, and Crooks

Trailblazers, Heroes, and Crooks: Stories to Make You a Smarter Investor. 2024. Stephen R. Foerster, CFA. John Wiley & Sons. In 2021, the Washington Post reported that five-time FIFA world player of the year Cristiano Ronaldo triggered a $4 billion plunge in Coca-Cola’s stock market valuation. He replaced two bottles of Coke with a bottle of water at a press conference held in conjunction with a tournament sponsored by the soft drink maker. As Stephen Foerster, CFA, documents in Trailblazers, Heroes, and Crooks: Stories to Make You a Smarter Investor, however, Coca-Cola’s stock price decline actually preceded Ronaldo’s snub and was at least partly related to the shares going ex-dividend. Foerster uses the Washington Post’s fact-check failure as a jumping-off point for illustrating how investors can be led astray if they mistake correlation for causation. Relatively recent events such as the Ronaldo/Coca-Cola affair combine with venerable ones already well known to students of financial history in this highly readable and instructive book. Foerster, a professor of finance at the Ivey Business School at Western University in London, Ontario, furnishes insights that will be new to most readers, even on a story as familiar as the South Sea Bubble. He cites Andrew Odlyzko’s fresh findings on Isaac Newton’s involvement in the notorious bubble, published in 2019. Readers who are acquainted with the outlines of the Panic of 1907 and Bernie Madoff’s Ponzi scheme will gain by learning important details from Foerster’s account. Similarly, many investors who lived through the US stock market crash of 19 October 1987 are probably unaware of the comparatively obscure Major Market Index’s pivotal role in the subsequent rebound. They may also not know that Fed chairman Alan Greenspan was aboard a flight from Washington, DC, to Houston as the market plummeted. Greenspan breathed a sigh of relief when told (upon deboarding and after the close) that the Dow Jones Industrial Average was down “five-oh-eight,” thinking the speaker meant 5.08 rather than 508 points. As its title indicates, the book deals not only with famous scams and debacles but also with such innovators as Warren Buffett, Charles Ellis, and Hetty Green. They appear alongside less heralded but perhaps equally colorful characters, such as Leo “The Moon” Rugendorf and John “Donkey Ears” Wolek, bit players in the 1963 American Express salad oil scandal. Foerster’s heroes include Paul Revere, whose claim to fame in financial history is that he engraved the border of inflation-indexed bonds issued by Massachusetts in 1780. The author is a CFA charterholder and calls the designation “the gold standard of credentials in the investment industry.” Note, however, that Foerster seeks to make Trailblazers, Heroes, and Crooks accessible to the general reader by defining such basic terms as “short selling,” “IPO,” and “buying on margin.” He counsels non-professionals to consider owning passive index funds, likely to the displeasure of many active managers in his potential audience. At the same time, Foerster points out the pitfalls of abdicating responsibility by relying on the widely used target-date funds. He describes them as “autopilots” because they never update asset allocations in light of new information about individuals’ risk preferences or tolerances. (As recently noted by Elizabeth O’Brien in Barron’s, one solution is to “off-date” by choosing a fund that corresponds to one’s preferred asset mix, rather than on the basis of an intended retirement year. Neither does the author let the objective of aiding non-professionals deter him from highlighting issues that veteran analysts and portfolio managers can benefit from exploring. For example, he points out how a confounding variable may trip up efforts to adjust a portfolio’s geographic mix through use of country indexes. A switch from a US to a Canadian equity index, for instance, also produces a major shift in industry concentration. In summary, Stephen Foerster extracts lessons from exceptional episodes in financial history that ordinary investors and seasoned professionals alike can put to profitable use. The bonus is that Trailblazers, Heroes, and Crooks is immensely entertaining from start to finish. If you liked this post, don’t forget to subscribe to the Enterprising Investor. All posts are the opinion of the author. As such, they should not be construed as investment advice, nor do the opinions expressed necessarily reflect the views of CFA Institute or the author’s employer. Professional Learning for CFA Institute Members CFA Institute members are empowered to self-determine and self-report professional learning (PL) credits earned, including content on Enterprising Investor. Members can record credits easily using their online PL tracker. source

Book Review: Trailblazers, Heroes, and Crooks Read More »

The Hidden Environmental Costs of Tech Giants’ AI Investments

Global technology leaders including Alphabet, Amazon, Apple, Meta, and Microsoft are increasingly integrating artificial intelligence (AI) technologies into their product offerings. The substantial energy consumption associated with AI training and operation has raised concerns about the environmental impact, particularly regarding GHG emissions[1]. Should investors demand these companies disclose their energy consumption to calculate Scope 3 GHG Emissions? From a sustainable investor’s perspective, the carbon emissions of a company can have implications on its discount factor (i.e., cost of capital). Companies with higher emissions may face increased regulatory scrutiny, potential carbon taxes, and reputational risks, all of which could increase their Weighted Average Cost of Capital (WACC). On the other hand, companies which have made long-term commitments, for example to clean energy, might enjoy a lower discount rate due to lower environmental risks. Carbon footprint is a measure of the total amount of carbon emissions that is directly and indirectly created by an activity or over the life of a product[2]. Carbon footprint could also be used by investors as a proxy for the sustainability of companies’ operations. Companies with efficient energy use may signal to investors that they are more resilient to energy price fluctuations and regulatory changes, as well as the feasibility of success in achieving Net-Zero pledges. For the technology leaders whose energy consumption has very significantly increased due to AI operations and yet whose reported carbon footprint may not seem as greatly increased, investors might question the integrity of the company’s overall carbon neutrality[3]. Big Tech Investment in Private AI Companies Microsoft’s AI efforts have historically been somewhat fragmented, compared to the more focused strategies of competitors like Alphabet and Amazon. By investing heavily in OpenAI (~$10B), Microsoft aimed to catch up and potentially surpass its competitors[4]. OpenAI’s models, integrated into Microsoft’s Azure cloud platform, have positioned Microsoft as a formidable player in the AI space[5]. Another case of significant investment in a private AI company by mega technology companies is Anthropic. Amazon has announced a $4B investment[6]. Prior to that, Alphabet committed to investing up to $2B in Anthropic[7]. This combined stake is still thought to be in the region of 30%, putting their scale and timing a distant second to Microsoft from an investment point of view[8]. How Amazon and Alphabet will report their investment in Anthropic is yet to be seen in the upcoming financial reports and sustainability disclosures. All these large-scale corporate investments add substantially more complexity to an already-difficult problem of assessing and reporting correctly total GHG emissions. This issue of complexity and a lack of agreed approach has been explored in detail in a recent Financial Times report[9], “Big Tech’s bid to rewrite the rules on net zero,” which describes where potential loopholes are and how large energy users might be able to hide their true emissions. Our paper examines these issues and considers the broader implications for disclosures where companies have substantial corporate investments in AI-focused ventures. Challenges and Implications The Greenhouse Gas Protocol, which supplies the world’s most widely used greenhouse gas accounting standards and guidance, introduced three “Scopes” (Scope 1, Scope 2, and Scope 3) for GHG accounting and reporting purposes[10]: Scope 1: Direct GHG emissions. Direct GHG emissions occur from sources that are owned or controlled by the company. Scope 2: Electricity-indirect GHG emissions. Scope 2 accounts for GHG emissions from the generation of purchased electricity consumed by the company. Scope 2 emissions physically occur at the facility where electricity is generated. Scope 3: Other indirect GHG emissions. Scope 3 is an optional reporting category that allows for the treatment of all other indirect emissions. Scope 3 emissions are a consequence of the activities of the company, but they occur from sources not owned or controlled by the company. “Technical Guidance for Calculating Scope 3 Emissions” provided by the Greenhouse Gas Protocol recommends that companies should account for the proportional Scope 1 and Scope 2 emissions of the investments that occur in the reporting year[11]. As such, disclosing investee company’s Scope 1 and 2 in the investor company’s Scope 3 emissions, proportionally to the ownership, aligns with global sustainability goals and guidance, but there are several challenges: Accurately measuring and reporting indirect emissions requires robust data-collection and verification processes. Detailed disclosures may reveal sensitive information about operational efficiencies and competitive strategies. Integrating GHG emissions data from partners, such as OpenAI, for example, into Microsoft’s reporting framework involves significant logistical and technical challenges, and possible double counting. Understanding Carbon Neutrality and Net Zero To evaluate a company’s environmental commitments, it is important to distinguish between “carbon neutrality” and “net-zero” emissions. Carbon neutrality refers to the reduction of a company’s emissions through credits or other measures without necessarily reducing the emissions at the source. In contrast, achieving net zero means that a company is reducing its overall emissions across its supply chain and operations to as close to zero as possible, using offsets only to cover unavoidable emissions. The Science-Based Targets Initiative (SBTi)[12] defines net zero as “a state of balance between anthropogenic emissions and anthropogenic removals.” To stabilize global temperatures, net-zero GHG emissions must be achieved worldwide, and targets under the SBTi Net-Zero Standard must cover all emissions defined by the United Nations Framework Convention on Climate Change (UNFCCC)/Kyoto Protocol[13]. The SBTi’s Corporate Net-Zero Standard guides companies on how to align with global net-zero goals[14]. It requires rapid, deep emission cuts, with a 50% reduction by 2030 and at least 90% by 2050 to limit global warming to 1.5°C above pre-industrial levels. Companies claiming carbon neutrality may offset CO2 without reducing emissions to the levels needed for net-zero or covering all GHGs. Renewable Energy Certificates Furthermore, current GHG accounting standards allow companies to use “Renewable Energy Certificates” (RECs) to report reductions in emissions from purchased electricity (Scope 2) as progress towards meeting their science-based targets[15]. A renewable energy certificate is a market-based instrument that represents the property rights to the environmental, social, and other non-power attributes of renewable electricity generation. One REC is issued when one megawatt-hour (MWh) of electricity is generated

The Hidden Environmental Costs of Tech Giants’ AI Investments Read More »

Trick or Treat? Bobbing for Multibaggers in the Small-Cap Market

In Agatha Christie’s mystery novel Hallowe’en Party, a young guest who may have witnessed a murder drowns in an apple-bobbing basket. In the wrong place at the wrong time, the unfortunate partygoer’s fate is a metaphor for that of the unlucky investor who bites into a losing stock and tastes the consequences. Taking a page from Benjamin Graham and David Dodd, Howard Marks, CFA, co-chair and co-founder of Oaktree Capital Management, describes fixed-income investing as “a negative art”: Success depends not on finding winners but on avoiding losers, on not buying those companies likely to default on loans and drag down returns. In Winning the Loser’s Game, Charles D. Ellis, CFA, draws a similar parallel between professional money management and tennis and golf. In tennis and golf, the winner tends to be the player who makes the fewest errors, not necessarily the one who makes the best shots. Small-cap investing is a similarly “negative art.” But in addition to steering clear of losers — avoiding mistakes — small-cap investors have to demonstrate the “positive art” of finding winners. By achieving that equilibrium and, importantly, selecting a smaller subset of very big winners, small-cap investors stand the best chance of harvesting alpha. Investing in smaller, early-stage companies has specific pitfalls that make risk control paramount. Many such firms have unproven business models and inexperienced management teams. They often lack sufficient financial resources, which could lead to significant dilution as they seek to raise funds for operations. In some cases, the value of the enterprise could go to zero and investors could experience total capital loss. That’s why prudens investor should avoid these types of companies just as they would invitations to Christie’s Hallowe’en party. By ignoring the “bad apples,” investors can focus on that subset of companies that are likely to do well, potentially so well they become the drivers of great long-term returns. Indeed, research demonstrates that almost 40% of stocks lose money, while only 20% account for most returns. So, is there a recipe for finding such a stellar investment, say, a stock that returns $100 for every $1 invested and joins the so-called “100-Bagger Club”? Yes, there is, and while it may be simple, it is far from easy. The 100-Bagger Recipe Multiple Growth + Earnings/Intrinsic Value + (Earnings Growth of 25x) x (Multiple Expansion 4x) = 100x Return But there are other important attributes to screen for. So, remember: Smaller is better. Why? Because smaller companies tend to adapt more quickly to changing market conditions and often have faster growth rates. Prioritize companies with differentiated products and services. Don’t underrate the value of a long runway and a large addressable market. A proven, long-term-focused management team whose incentives are aligned with investors. Focus on underfollowed firms. Avoid crowded trades to obtain greater value than what you pay. When an investor finds a subset of these companies, history has shown it pays to hold on for as long as earnings are increasing. Taking profits is standard operating procedure for investors because no one wants to experience the regret of seeing significant paper gains dissipate. Yet, as Marks pointed out in his memo, the investor who held onto Apple stock from its split-adjusted cost of $0.37 in 2003 would have enjoyed a 500-fold return by 2023. When bobbing for tasty investments, we have to focus just as much on avoiding the sour ones as we do on snagging the winners. Over time, the winners will take care of themselves. If you liked this post, don’t forget to subscribe to Enterprising Investor. All posts are the opinion of the author. As such, they should not be construed as investment advice, nor do the opinions expressed necessarily reflect the views of CFA Institute or the author’s employer. Image credit: ©Getty Images / andyh Professional Learning for CFA Institute Members CFA Institute members are empowered to self-determine and self-report professional learning (PL) credits earned, including content on Enterprising Investor. Members can record credits easily using their online PL tracker. source

Trick or Treat? Bobbing for Multibaggers in the Small-Cap Market Read More »