CFA Institute

Book Review: The New World Economy in 5 Trends

Book Review: The New World Economy in 5 Trends: Investing in Times of Superinflation, Hyperinnovation and Climate Transition. 2024. Koen De Leus and Philippe Gijsels. Lannoo Press. One kind of reader may be looking for a sober analysis of the economics of megatrends. Another may be looking for something more wide-ranging, humorous, and eclectic, replete with pointers toward investment opportunities. For both kinds of reader, The New World Economy in 5 Trends will be a welcome find. The book presents an interaction between its two authors, who have contrasting styles that manage to come together as a coherent whole. Koen De Leus, chief economist at BNP Paribas Fortis in Belgium, and Philippe Gijsels, chief strategy officer at the same institution, coauthored this book. De Leus is the diligent economist who approaches his topics with thorough data-driven analysis, focused on identifying the future implications for the economy of today’s changing world. Gijsels focuses on identifying the investment implications of these economic changes. Clearly a bookworm, Gijsels refers again and again to his wide reading. He has a weekly presentation of new books on LinkedIn, “Over My Shoulder,” and his style of analysis can lead him in unexpected and interesting directions. At its core, the book examines five specific trends that the authors believe will have the greatest impact on economies and investments between now and the middle of this century. The trends highlighted are innovation and productivity, climate, multiglobalization, debt, and aging. Analysis of trends or megatrends is nothing new. Note, for example, that something similar features in the CFA Institute curriculum for the Certificate in ESG Investing. What may be new here is the use of such detailed economic analysis to inform investment implications. The section on aging offers a particularly good example of how the economist and the strategist interact. De Leus analyzes global demographic trends comprehensively, by age group, country, and region. He looks at trends in the dependency ratio, the resulting “time bomb under the social security system,” and impacts on interest rates and inflation, as well as possible remedies available to different countries. Gijsels’s contribution to the chapter is more eccentric. He “interviews” nineteenth century economists Thomas Malthus and David Ricardo. He coins new terms like “seniorescence” and “transiteer,” and he refers to French fables. Out of these eclectic elements, however, comes solid analysis of investment opportunities — biotechnology, robotics, the experience economy, battery technologies, real estate, and more. Naturally, the authors stress that the ideas in the book “should in no way be seen as investment advice. We are merely providing you with a few foundational concepts.” The trends often overlap. For example, the section on aging has an interesting analysis of the effect of demographics on innovation (“oldtimers do not innovate”). Real estate comes into play in several sections, and the prospects for commodities are analyzed in both the climate and multiglobalization sections. The authors neatly summarize each of the five trends, first with “Ten points to remember” and then with “Ten to invest in.” The suggestions about where or how to invest tend to be general in nature, suggesting where to start for further analysis rather than offering full-fledged investment proposals. For example, in relation to innovation and productivity, there is advice on how to deal with the AI boom and an assertion that “whoever owns data has the power and gets the profits.” In the section on climate, we read that “the energy transition is one of the biggest investment opportunities ever. Don’t miss your chance.” Of the five trends discussed, multiglobalization may be the one with the most novel treatment. On the one hand, there is a study of phenomena such as re-shoring and diversifying global supply chains. On the other hand, the authors provide analysis of how services can become globalized, especially “intermediate” services such as data entry rather than “final” services such as accountancy. The scale of digital services exports is significant, totaling €38 trillion globally in 2022, according to the authors (citing an International Monetary Fund report). The resulting investment opportunities are somewhat unclear, but we are advised that “it would be unwise not to sit at the Chinese table from an investment perspective.” A similar sentiment applies for “low-cost growth markets.” One way that the book looks ahead to the future is through occasional simulated news reports from the 2040s and 2050s. These offer a mixture of negative and positive predictions. For example, one such report describes the dire state of the planet resulting from climate change and “past government leaders’ procrastination.” The section on globalization foresees a reduction in global growth resulting from greater import restrictions, albeit this reduction in growth can be reversed by more open trade policies. On a more positive note, the authors predict huge increases in productivity resulting from innovation like AI and quantum computing. These reports are further examples of the book’s ever-varying structure. This variety, along with an engaging writing style (and even attractive typesetting), keeps the reader’s interest in this volume of more than 400 pages. For all the book’s good qualities, it is disappointing to find errors and typos throughout the text. These may result from translation error — the book was originally published in Dutch, while the version being reviewed is an English translation. Nonetheless, a more thorough proofreading might have avoided errors such as misspelling “rigthly” and “artifially”, confusing the World Health Organization and the World Trade Organization, and rewriting Mario Draghi’s renowned phrase “whatever it takes” as “everything possible.” Referring to another title, Gijsels comments, “The book does what any good book should do: It provides insights and is a starting point for analysis and discussion.” This is an apt comment about The New World Economy in 5 Trends itself. Many of the book’s prognostications may ultimately fail to come true, and surely trends not referred to here will emerge in the decades ahead. Nonetheless, the book does an admirable job of looking through current trends to one possible future, thereby helping its readers

Book Review: The New World Economy in 5 Trends Read More »

So, You Want to be an Investment Consultant?

I recently had the pleasure of participating in the CFA Program Career Webinar Series and was thrilled when I was invited to share insights from my 25 years of investment experience with Enterprising Investor readers. This blog post is a resource for early career investment professionals interested in the world of investment consulting. I’m a managing director and partner at Marquette Associates, an independent firm that is based in Chicago. I also chair the firm’s defined contribution services committee and act as primary consultant on several client relationships. My Indirect Path into Investment Consulting My career began with aspirations in economics back in the United Kingdom, where I grew up and completed all my non-professional education. Opportunities a few years out of university led me to the United States, where I joined Merrill Lynch. At Merrill, I was exposed to both asset management and consulting sides of the business. New doors opened for me after passing each level of the CFA exam, which prepared me to work as a fixed income credit analyst at Merrill. While I gained valuable experience in the role, for several reasons this was not my ultimate calling. My exposure to capital markets and asset management at Merrill laid a foundational understanding for my eventual move to consulting. I discovered that consulting blended my backgrounds in both economics and asset management beautifully. As a consultant, I handle asset allocation, manager selection, and market discussions with clients, allowing me to draw on my varied experiences. Consulting as a Calling Consulting is an intricate dance of using quantitative analysis and relationship management. The diversity of tasks and clients played to my innate curiosity and desire to find solutions to a variety of situations. On any given day, I get to engage with different industries, personas, and portfolios, continually learning and expanding my knowledge base. I see myself as a matchmaker.  When all is said and done, I am seeking the right asset classes, the right strategies, and the right managers to meet the needs of the client’s portfolio. Investment consulting clients range from large institutions to small entities, public to private sectors, and more. Our role involves understanding each client’s specific investment goals, risk tolerance, and liquidity needs. This deep understanding helps tailor asset allocations, choose appropriate strategies, and ultimately lead clients towards successful investment outcomes. Balancing Your Personal Skills Portfolio An investment consultant must balance the technical with the relational. Quantitative skills are crucial for assessing investments, while equally, if not more important, are the communication and relationship-building skills. You must be able to explain complex quantitative data in simple terms to clients and forge trust-based relationships to effectively advise them. Opening the Door to Investment Consulting Breaking into investment consulting can seem challenging, especially when job postings require previous experience in consulting. My transition from Merrill to Mercer was facilitated by my CFA designation. It became clear that while I didn’t have direct consulting experience, my background in asset management, portfolio management, and economic insights equipped me with a holistic understanding of investments. I was fortunate to have some great mentors and department heads at Mercer who saw this. I always advise aspiring consultants to leverage their networks. Conversations over a cup of coffee can open doors. The right mix of curiosity, humility, and a strong foundation in investment principles often impresses prospective employers. Technology and AI: Understand it and Learn to Harness its Power Looking to the future, artificial intelligence (AI) is poised to revolutionize our industry. As it stands, AI can manage vast datasets, aiding in more efficient decision-making processes. While there’s a possibility AI might streamline some roles, the essence of relationship-based consulting remains irreplaceable, in my humble opinion. AI will likely complement rather than replace the nuanced, human aspects of consulting, fostering more advanced efficiencies and freeing up advisors to focus on strategic counsel and creative solutions. Key Takeaway Investment consulting is continually evolving, demanding both intellectual rigor and interpersonal acumen. With every new challenge and client interaction, it offers unparalleled opportunities to learn and grow. As technology evolves, so will our approaches, yet the core of consulting — relationship-driven, strategic advice — will remain steadfast. Stay curious, embrace the journey, and as I always say, be comfortable with the uncomfortable. source

So, You Want to be an Investment Consultant? Read More »

Outperformed by AI: Time to Replace Your Analyst?

Your Analysts Have Competition — And It’s Not Human. Six AI models recently went head-to-head with seasoned equity analysts to produce SWOT analyses, and the results were striking. In many cases, the AI didn’t just hold its own; it uncovered risks and strategic gaps the human experts missed. This wasn’t theory. My colleagues and I ran a controlled test of leading large language models (LLMs) against analyst consensus on three companies: Deutsche Telekom (Germany), Daiichi Sankyo (Japan), and Kirby Corporation (USA). Each was the most positively rated stock in its region as of February 2025 — the kind of “sure bet” that analysts overwhelmingly endorse. We deliberately chose market favorites because if AI can identify weaknesses where humans see only strengths, that’s a powerful signal. It suggests that AI has the potential not just to support analyst workflows, but to challenge consensus thinking and possibly change the way investment research gets done. The Uncomfortable Truth About AI Performance Here’s what should make you sit up: With sophisticated prompting, certain LLMs exceeded human analysts in specificity and depth of analysis. Let that sink in. The machines produced more detailed, comprehensive SWOTs than professionals who have spent years in the industry. But before you eliminate the need for human analysts, there’s a crucial caveat. While AI excels at data synthesis and pattern recognition, it can’t read a CEO’s body language or detect the subtext in management’s “cautiously optimistic” guidance. As one portfolio manager told us, “Nothing replaces talking to management to understand how they really think about their business.” The 40% Difference That Changes Everything The most striking finding? Advanced prompting improved AI performance by up to 40%. The difference between asking “Give me a SWOT for Deutsche Telekom” and providing detailed instructions is the difference between a Wikipedia summary and institutional-grade research. This isn’t optional anymore — prompt engineering is becoming as essential as Excel was in the 2000s. Investment professionals who master this skill will extract exponentially more value from AI tools. Those who don’t will watch competitors produce superior analysis in a fraction of the time. The Model Hierarchy: Not All AI Is Created Equal We tested and ranked six state-of-the-art models: Google’s Gemini Advanced 2.5 (Deep Research mode) — The clear winner OpenAI’s o1 Pro — Close second with exceptional reasoning ChatGPT 4.5 — Solid but notably behind the leaders Grok 3 — Elon Musk’s challenger showing promise DeepSeek R1 — China’s dark horse, fast but less refined ChatGPT 4o — The baseline for comparison The reasoning-optimized models (those with “Deep Research” capabilities) consistently outperformed standard versions such as ChatGPT-4o. They provided more context, better fact-checking, and fewer generic statements. Think of it as hiring a senior analyst versus a junior analyst — both can do the job, but one needs far less handholding. Timing matters too. The best models took 10 to 15 minutes to produce comprehensive SWOTs, while simpler models delivered in less than a minute. There’s a direct correlation between thinking time and output quality — something human analysts have always known. The European AI Deficit: A Strategic Vulnerability Here’s an uncomfortable reality for European readers: Of the models tested, five are American and one is Chinese. Europe’s absence from the AI leadership board isn’t just embarrassing — it’s strategically dangerous. When DeepSeek emerged from China with competitive performance at a fraction of Western costs, it triggered what some called a “Sputnik moment” for AI. The message was clear: AI leadership can shift rapidly, and those without domestic capabilities risk technological dependence. For European fund managers, this means relying on foreign AI for critical analysis. Do these models truly understand ECB communications or German regulatory filings as well as they grasp Fed statements? The jury’s out, but the risk is real. The Practical Integration Playbook Our research points to a clear four-step approach for how investment professionals should use these tools 1. Hybrid, Not Replacement: Use AI for the heavy lifting — initial research, data synthesis, pattern identification. Reserve human judgment for interpretation, strategy, and anything requiring genuine insight into management thinking. The optimal workflow: AI drafts, humans refine. 2. Prompt Libraries Are Your New Alpha Source: Develop standardized prompts for common tasks. A well-crafted SWOT prompt is intellectual property. Share best practices internally but guard your best prompts like trading strategies. 3. Model Selection Matters: For deep analysis, pay for reasoning-optimized models. For quick summaries, standard models suffice. Using GPT-4o for complex analysis is like bringing a knife to a gunfight. 4. Continuous Evaluation: New models launch almost weekly. Our six-criteria evaluation framework (Structure, Plausibility, Specificity, Depth, Cross-checking, Meta-evaluation) provides a consistent way to assess whether the latest model truly improves on its predecessors. Please refer to the full research report for more details: “Outperformed by AI: Time to Replace Your analyst?” (Michael Schopf, April 2025). Beyond SWOT: The Expanding Frontier While we focused on SWOT analysis, the implications extend across the entire investment process. We list a few of these below, but there are many more: Earnings call summarization and analysis in minutes, not hours ESG red flag identification across entire portfolios Regulatory filing analysis at scale Competitive intelligence gathering Market sentiment synthesis Each application frees human analysts for higher-value work. The question isn’t whether to adopt AI — it’s how quickly you can integrate it effectively. The Uncomfortable Questions Let’s address what many are thinking: “Will AI replace analysts?” Not entirely, but it will replace analysts who don’t use AI. The combination of human + AI will outperform either alone. “Can I trust AI output?” Trust but verify. AI can hallucinate facts or miss context. Human oversight remains essential, especially for investment decisions. “Which model should I use?” Start with Gemini Advanced 2.5 or o1 Pro (or the successors) for complex analysis. But given the pace of change, reassess quarterly. “What if my competitors use AI better?” Then you’ll be playing catch-up while they’re finding alpha. Staying on the sidelines while competitors build AI advantage means ceding ground in an increasingly competitive landscape. The Path Forward The genie is out of the bottle. LLMs have

Outperformed by AI: Time to Replace Your Analyst? Read More »

A Guide for Investment Analysts: Working with Historical Market Data

Q: How far back does the US stock and bond record go? A: Good data series are available from the 1790s. This is the first of three posts that are pitched at analysts interested in working with older historical data. It is easy to download a historical data set and proceed immediately to statistical analysis. But pitfalls lurk for the unwary. The farther back in time, the more different the circumstances. Context matters when interpreting results. I also have an eye on investors who enjoy reading historical accounts. I see a lot more of these accounts in the press and in white papers than when I first started probing the record 15 years ago. These posts will lift the hood — or turn over the rock — to give you a better understanding of what underlies these accounts. I’ll start by dating and defining the fully modern era and then trace the roots of the modern era to the 1920s. Later posts will push further back in history. Full-Fledged Modernity: the 1970s Stocks From the end of 1972 the Center for Research into Security Prices (CRSP) includes in its database stocks trading over the counter on the NASDAQ. It had added stocks trading on the AMEX as of 1962. Before 1962, there is no true Total Stock Market Index to track. Indexes labelled as “the market” include only stocks listed on the New York Stock Exchange. Which is to say, include only the largest firms that are able to meet the strict listing standards of the NYSE. Before 1972, most of the smallest firms in the United States and those with the weakest financials — literally thousands — were excluded from the historical record. Accordingly, factor analyses before this period are suspect. “Small stocks” were the smallest of the largest stocks, those able to qualify for NYSE listing. Banks and other financial service firms are not tracked in CRSP data before 1972. These were not listed on the NYSE. Bonds Only by this point is there a regular issue of Treasury bonds and notes spread through the maturity spectrum. As described below, at the outset of the modern period in the 1920s, most Treasuries were long issues, and issuance was irregular. Years could go by with no new Treasury issues. Only in the 1970s does a Total Bond Market index appear, with all traded maturities included and with government and corporate issues combined. Roots of the Modern Era: the1920s You may have read the phrase, “Since 1926, stocks have returned …” and idly wondered what happened in 1926 that was so special. The short answer: nothing. The December 1925 anchor for the Standard & Poor’s index and for the total stock market index published by CRSP represents an arbitrary starting point set by time and cost limitations facing early data compilers. Nonetheless, for the moment, precise data at the level of individual stocks — daily price change, ex-dividend day, splits, mergers and acquisitions, other corporate actions — only extends back to January 1926. Before that point, the analyst must typically work with index data, over a monthly interval at best. With that caveat, the true point of beginning for the modern period was around the end of World War I. Before the war, the markets looked very different, especially the bond market. The available data for interpreting market returns, even at the index level, also begins to thin out. Whereas from January 1919, a host of macro- and micro-economic data series can be found in Federal Reserve publications. By the 1920s: Hundreds of stocks traded on the New York Stock Exchange, which, decades prior, had established its predominance over all other US exchanges. Almost all the largest firms in the US were listed on the NYSE. These stocks were distributed across more than a dozen distinct sectors, including transportation, utilities, diverse industrial sectors — including durable goods and packaged goods manufacturers — and emerging services like chain retailing. A deep and liquid US Treasury market had emerged following World War I. However, still missing as of 1926 are some elements that the 21st century investor takes for granted. For stocks: Again, banks and most financial services firms did not trade on the NYSE and were not included in either the CRSP or the S&P indexes for the period. The Securities and Exchange Commission did not yet exist (1935), nor did the Investment Companies Act of 1940. There were few regulations to prevent market manipulation or the dissemination of false or self-interested information. The Federal Reserve does not yet regulate the margin required to buy stock. Depending on the customer, stock, and brokerage firm, a margin as low as 10% might have been all that was required to trade. For bonds: Only a few maturities were available for Treasuries, most of them long. Only during the 1930s, as the Treasury attempted to alleviate the Depression with multiple issues of varying length, did the maturity spectrum begin to be populated. There was no regular schedule of offerings, at any maturity. In fact, for most of the 1920s the government was engaged in paying down the debt accumulated from the war, with new offerings designed primarily to refinance that debt, particularly the short-term notes, into an extended maturity schedule convenient for the government. The mindset of this era approached government debt as a regrettable exigency of war, to be worked down and paid off as peacetime conditions permitted. The modern Treasury bill, defined as a very short-term note, offered on a regular schedule and allowing amounts to be rolled over indefinitely, was not inaugurated until 1929.  Takeaways There is now almost 100 years of data that permit comprehensive analysis of stock and Treasury return,  not much different from what the analyst could do over the past 50 or even 20 years. But as soon as the analyst ventures back before the 1920s, data series taken for granted today begin to thin and disappear. Notably: There was no Treasury bill, hence no good

A Guide for Investment Analysts: Working with Historical Market Data Read More »

Why the New T+1 Settlement Cycle Matters: A Global Index Provider’s Perspective

The clearing and settlement of equity trades may not sound like the most exciting subject, but it is an important one. And this year something big is happening. The US equity market is moving to a shorter settlement cycle. Beginning May 28, trades in US stocks will settle the day after the trade date (T+1). Currently, the settlement cycle is two days after the trade date (T+2). Trades in US corporate bonds and unit investment trusts will also move to the shorter cycle, as will the national equity markets of Canada and Mexico. This will place the US equity market on a shorter settlement cycle than most other developed markets, which operate on a T+2 or T+3 cycle. Faster settlement protects market participants by reducing systemic risks, operational risks, liquidity needs, and counterparty risks. It also helps to reduce margin requirements and allows investors quicker access to the proceeds from a sale trade. Faster exchange of securities for cash is in line with technological advances and may have further to go. If we can send money instantaneously — as most of us now can via faster payments systems — why can’t we move the cash associated with our equity trades in real time as well? The answer is that money and securities move on different settlement “rails” with different operating procedures. Beyond that, we still operate in a world of national currencies and national securities markets. Moving money between them is not always seamless. Why Does This Matter to a Global Index Provider? FTSE Russell’s role as a global index provider is to offer an objective view of markets’ behaviour. This means creating and managing a wide range of indices, data, and analytical solutions to meet clients’ needs across asset classes, styles, and strategies. It also means looking behind the daily headlines of market movements and into the way those markets operate. Settlement cycles matter to us because we can’t look at any particular equity market in a vacuum — from the perspective of local traders and investors. In fact, a US trader or investor buying and selling Amazon or Microsoft shares probably won’t notice that much has changed at the end of May. But the new T+1 settlement cycle for US equities creates complexities for non-domestic investors in US shares. For anyone outside the US buying or selling US shares, there likely will be an associated foreign exchange (FX) transaction. A foreign buyer of US shares may need to sell his or her currency to buy US dollars to acquire the shares. Equally, a seller of US shares will probably want to convert the dollars received into another currency. The FX market’s convention is T+2 settlement. After May 28, there will be a mismatch between FX and equity settlement periods. Knock-on Effects The shortening of the US equity settlement cycle may have various knock-on effects for other financial market participants around the world. This may be exacerbated, depending on the time zone in which an investor operates. Among those affected could be index fund managers. The replicability of regional or global benchmarks may be tested, for example, if the new settlement cut-off times are unattainable for a typical index-tracking portfolio. Importantly, US shares currently represent more than 60% of global equity indices by weight. Keeping an Eye on Equity Market Structure Changes to equity markets’ operating procedures are inevitable and ongoing. They are something FTSE Russell monitors closely via our equity country classification process. The quality of regulation, the dealing landscape, and custody and settlement procedures within individual equity markets impact that process. We conduct a formal annual review of country classification within the FTSE global equity indices each September using a comprehensive, transparent, and consistent methodology, and an interim country classification review each March. We publish the results of each review shortly afterward. In the last three decades, we have witnessed a welcome shift toward more seamless post-trade procedures and a shortening of settlement times. But the changes to market practices resulting from the impending contraction of the US equity settlement cycle is one area we will be following closely. Two resources to help bring you up to speed on this topic are the market and index impact of the shorter US equity settlement cycle and The challenges and opportunities for FX from the US and Canada shift to T+1. If you liked this post, don’t forget to subscribe to the Enterprising Investor. All posts are the opinion of the author. As such, they should not be construed as investment advice, nor do the opinions expressed necessarily reflect the views of CFA Institute or the author’s employer. Image credit: ©Getty Images / Ascent / PKS Media Inc. Professional Learning for CFA Institute Members CFA Institute members are empowered to self-determine and self-report professional learning (PL) credits earned, including content on Enterprising Investor. Members can record credits easily using their online PL tracker. source

Why the New T+1 Settlement Cycle Matters: A Global Index Provider’s Perspective Read More »

Investing in U.S. Financial History: Three Principles, Three Excerpts

“There can be few fields of human endeavor in which history counts for so little as in the world of finance. Past experience, to the extent that it is part of memory at all, is dismissed as the primitive refuge of those who do not have the insight to appreciate the incredible wonders of the present.” — John Kenneth Galbraith After four years of painstaking research, writing, and editing, I am happy to report Investing in U.S. Financial History is now available online and in select bookstores in the United States and across the world. I hope it provides educational value to all investors regardless of their experience and serves as a reliable reference that helps readers contextualize the present and envision the future. The story begins in 1790 with Alexander Hamilton’s financial programs and ends in March 2023 with the US Federal Reserve’s ongoing effort to contain inflation. Sprinkled throughout are brief “points of interest” that explain critical investment, economic, and financial principles. Despite the passage of more than two centuries, many principles are just as relevant today as they were when the United States was in its infancy. Here I provide a sneak peek by sharing three excerpts that each illuminate one important financial concept. The first considers the “Paradox of Speculation,” or how speculation in US securities markets produces hardship for many while also driving national progress. The second examines a challenge that most investment professionals eventually confront: whether to abandon the status quo after it has outlived its usefulness or continue to extract value from clients for outdated services that no longer deliver any. This dilemma has recently become especially acute for investment consultants serving institutional plan trustees. The final principle reveals how many “financial firefighters” often endure widespread contempt and ridicule despite considerable personal sacrifice. This phenomenon has persisted for more than 200 years and affected Hamilton, J. Pierpont Morgan, Hetty Green, Paul Volcker, and Hank Paulson, among others. Whether you choose to read Investing in U.S. Financial History in full, I hope these excerpts provide value that far exceeds the time you invest in reading them. 1. The Paradox of Speculation  The Principle Speculative activities by investors in the United States cause both suffering and prosperity. This paradox of speculation is an important concept because we often focus inordinately on the pain, which tends to be more salient in the short term. In contrast, decades may pass before society reaps the benefits that speculative activities have helped create. This paradox has existed since the very first securities were traded on Wall Street, soon after the initial public offering (IPO) of the First Bank of the United States. The Excerpt “He [the American] launches with delight into the ever-moving sea of speculation. . . . Some individuals lose, but the country is the gainer; the country is peopled, cleared, cultivated; its resources unfolded; its wealth increased.” — Michel Chevalier (1836)  The emergence of Wall Street as the nation’s financial capital was aided by the peculiar paradox of speculation. From its very inception, Wall Street was the preferred venue for US speculators. In the 1700s, they were called stock jobbers. In the 1800s, they were called stock plungers. In the early 1900s, they were called stock operators. And now they are a mix of analysts, hedge fund managers, and the latest gurus on CNBC.  America has always and likely will always have a love/hate relationship with Wall Street speculators. Their actions can create great wealth or great misery for those who follow their lead. Yet at the same time, the repetitive process of mania, failure, and renewal has made markets more liquid, more efficiently priced, and ultimately more attractive to investors. This, in turn, has enabled American entrepreneurs to acquire funding for countless ventures. Without Wall Street, many of the world’s greatest inventions would likely remain locked in the brains of people who have long since passed. The genius and folly of American speculators could fill several volumes. Each time, you will observe the odd paradox of speculation. Every mania, bubble, fraud, crash, and depression was followed by renewal and advancement. It is this paradox that has helped drive American progress. The constant battling between bulls and bears also created a safe but unappreciated wake that inspired the greatest financial innovation of the 20th century: the index fund. 2. The Long-Term Rewards of Honesty and the Destructive Fear of Obsolescence The Principle To serve clients well, investment advisers must continuously reevaluate whether their services will add value in aggregate. If advisers discover they do not — and they value their integrity — they must voluntarily abandon their existing service model and search for new ways to add value. Alternatively, they can cling to the status quo and hope clients never discover that their claimed value proposition no longer exists. History reveals that those who give up on the status quo are the same people who invent new ways to add value and, in doing so, benefit themselves as much as their clients. But those who stick with outdated practices eventually see their business evaporate — and sacrifice their personal integrity along the way.  Merrill Lynch’s bold effort to restore the brokerage industry’s reputation in the late 1940s demonstrates this dynamic. The Excerpt “The customer may not always be right, but he has rights. And upon our recognition of his rights and our desire to satisfy them, rests our chance to succeed.” — Charles Merrill, founder of Merrill Lynch  When faced with moral dilemmas, characters in old cartoons consulted with an imaginary devil on one shoulder and an angel on the other. The devil encouraged acts that were wrong but self-serving, while the angel encouraged them to do what was right but seemed self-destructive. In the long term, the angel’s advice always proved to be both right and rewarding, while the devil’s advice provided short-term relief at the expense of long-term self-destruction.  Investment professionals are constantly presented with this dilemma. Serving clients honestly — which is in every investment

Investing in U.S. Financial History: Three Principles, Three Excerpts Read More »

Book Review: The Revolution That Wasn’t

The Revolution That Wasn’t: Gamestop, Reddit, and the Fleecing of Small Investors. 2022. Spencer Jakab. Penguin Random House. In The Revolution That Wasn’t: GameStop, Reddit, and the Fleecing of Small Investors, Spencer Jakab, current editor for the Wall Street Journal and former stock analyst at Credit Suisse, describes the real winners and losers in the 2021 GameStop short squeeze — who are not the winners and losers we’ve been led to believe they are. He takes us through the fascinating events that led to the short squeeze and explains how financial and technological mechanisms such as Robinhood’s “free” trading app made it possible. The financial media described it as a watershed moment when power was placed back in the hands of ordinary retail investors. Despite Wall Street advertising the “democratization of finance,” however, Jakab argues that it is still Wall Street, not the everyday retail investor, who is the ultimate winner from the meme stock revolution. The class of investors that became the primary target of intense scorn on WallStreetBets was the short sellers, who may have taken a permanent hit. Because short squeezes can now be facilitated on social media, for portfolio managers and traders to be short has become much riskier. Short sellers now know they can be “ganged up on” by a motley crew of retail traders. This development will likely reduce short interest in the future. And because short positions play a critical role in maintaining price efficiency, a reduction in short interest will likely lead to more bubbles in the future — bubbles in which the most likely buyers will be everyday retail investors. A mid-2020 estimate of the average length of time a share is held, according to the author, fell to less than half a year from as much as eight years in the 1950s. Shares now change hands about 17 times as frequently as they did in the 1950s. Although each individual trade is less costly because of the elimination of commissions and a reduced gap between the bid and offer price, the new crop of retail investors, including those who facilitated the GameStop short squeeze, will be leaving significant money on the table as part of their active trading. The combination of more ordinary retail investors in the market plus their belief that they can outsmart the market will likely be a boon for Wall Street practitioners. According to Jakab, the democratization of finance and retail rebellion was an illusion that the financial media bought into too readily. If you cater to people’s propensity to gamble when they have money for the first time and to tell them they can make 30–50 trades a day commission-free but you are selling their order flow, you are creating an indirect way for Wall Street to make money. Investor advocates, such as the Consumer Federation of America, are pushing for rules to protect investors from such gambling on the basis of their instincts and are critical of the free-trading model. Many of the new retail investors will learn their lessons by paying Wall Street tuition in the form of losses. One of the most pernicious effects of young retail investors losing a small sum of money is that they eventually become discouraged from investing at all. A dollar lost early can be more punishing than one lost in middle age because of compound interest. Stock market wealth is already very unevenly distributed by age, race, and income. In summary, the author notes that competition and technology have made Wall Street a friendlier and more profitable place for individuals, provided they play a not-too-exciting game. If commission-free trading had been around decades ago, Jakab estimates that Warren Buffett might have earned 150–200 times as much as the overall market. Despite the meme stock revolution, the new boss in finance appears to be still the same old boss, and Wall Street is still a place where investors lose too much of their money when they think they can beat the house. If you liked this post, don’t forget to subscribe to the Enterprising Investor. All posts are the opinion of the author. As such, they should not be construed as investment advice, nor do the opinions expressed necessarily reflect the views of CFA Institute or the author’s employer. Professional Learning for CFA Institute Members CFA Institute members are empowered to self-determine and self-report professional learning (PL) credits earned, including content on Enterprising Investor. Members can record credits easily using their online PL tracker. source

Book Review: The Revolution That Wasn’t Read More »

Can Machine Learning Help Predict the Next Financial Crisis?

What do we mean by financial crisis? What are some of the classical methods that predict such crises? How can machine learning algorithms contribute to anticipating them? Financial crises take a variety of forms: They range from sovereign defaults to bank runs to currency crises. What these episodes all have in common is that an internal vulnerability worsens over time and, after an associated trigger, precipitates a financial crisis. Pinpointing the specific trigger can be difficult, so the evolution of internal vulnerabilities must be monitored. What precisely are these internal vulnerabilities? In statistical terms, they are the explanatory variables in crisis models. In historic crisis episodes, they often served as the response variable. While this is part of the classical approach to modeling financial crises, it isn’t the only way to model financial risks. In the classical crisis model, the standard method is to use logistic regressions to estimate the probability of a financial crisis. Explanatory variables are connected to the response variable with a non-linear link function. The dependent variable is 0 for no crisis and 1 for crisis. This approach hinges on the definition of financial crisis. The past variables are modeled with the help of maximum likelihood by varying the exposures of the explanatory variables to the response variable. In machine learning terms, this a supervised learning technique or a logistic regression with one hidden layer. It is also known as a shallow neural network. Determining default or crisis probabilities from market prices are among the other crisis modeling methods. For example, from credit default swaps (CDS), an implied default probability can be calculated. Of course, this is fundamentally different from both the logistic regression described above and the application of machine learning algorithms described below. So, what can machine learning algorithms do to improve on the estimation of financial crisis probabilities? First, unsupervised learning is distinct from supervised learning in that there is no response variable. Clustering is one technique that is worth highlighting. The goal of clustering is to group data points in a sensible way. These data groups will be associated with a center of mass to help determine the structure within the datasets. Clustering can be applied to both the dependent and independent variable. Rather than using a fixed threshold to determine a currency crisis, for example, we can split currency returns into different clusters and derive a sensible meaning from each cluster. Machine learning algorithms can add significant value in this way. While clustering is only one example of the power of coding, these algorithms have a number of other useful applications Of course, while machine learning is simply an umbrella term for many useful algorithms, whether the machine actually learns is a different question entirely. To split the time series in a training and test set is, however, is still among machine learning’s major weaknesses. How do you determine the split? Often the decision is arbitrary. Whatever these shortcomings, they hardly detract from the significant benefits that machine learning can bring. Indeed, now is the time to invest in these capabilities. If you liked this post, don’t forget to subscribe to the Enterprising Investor All posts are the opinion of the author. As such, they should not be construed as investment advice, nor do the opinions expressed necessarily reflect the views of CFA Institute or the author’s employer. Image credit: ©Getty Images/noLimit46 Professional Learning for CFA Institute Members CFA Institute members are empowered to self-determine and self-report professional learning (PL) credits earned, including content on Enterprising Investor. Members can record credits easily using their online PL tracker. source

Can Machine Learning Help Predict the Next Financial Crisis? Read More »

Geopolitical Change: Investors Should Focus on the Long Term

In our interconnected world, geopolitical events — ranging from trade disputes and regulatory shifts to conflicts and pandemics — capture headlines and influence market sentiments. As investment professionals, it’s crucial for us to understand these dynamics without losing sight of long-term client objectives. At CFA Institute, our role is clear: we educate financial professionals. We do not take positions on geopolitical matters. Rather, we focus our work through the lens of investment outcomes and improving the financial system for the benefit of all market participants. Since our founding in 1947 — the post–World War II era — every decade has been marked by significant strife and economic disruption. The Cold War defined geopolitics for decades. Borders shifted in Eastern Europe and were drawn and redrawn over time. The 1960s brought massive cultural and governmental changes to many parts of the world. The 1970s saw significant inflation, high interest rates, and oil-supply shocks. I could go on, but the point should be clear: every epoch poses unique sets of challenges for investors. As financial professionals, we must serve client needs and remain focused on our mandate to improve investor outcomes. We must not allow news alerts or our own personal views on the issues of the day to distract us from the work of fundamental analysis and our fiduciary duty to clients. And at CFA Institute, we must focus on our mission: “To lead the investment profession globally by promoting the highest standards of ethics, education, and professional excellence for the ultimate benefit of society.” Recognizing the significance of geopolitical factors, the CFA® Program curriculum contains comprehensive content on this subject. In Level I, candidates explore the “Introduction to Geopolitics,” which examines how geography influences politics and international relations, and how these, in turn, impact global economies and investment markets. This content is also available to our members as a refresher reading. We don’t “teach” positions on these matters. We focus on the core: what does it mean for investors? This inclusion of geopolitics in the curriculum underscores our commitment to equipping members and candidates with the tools to assess and navigate geopolitical risks effectively. Taking a long-term perspective stands the test of time. Historical data indicates that while geopolitical events can cause short-term market disruptions, the long-term impact on returns is often limited. Markets tend to absorb ebbs and flows over time, with prices ultimately realigning when underlying economic fundamentals normalize. The challenge, therefore, is identifying secular trends that may indeed have enduring consequences: what is episodic vs. a realignment of the status quo. Overall, maintaining a long-term perspective remains essential in the face of geopolitical uncertainties. Short-term market movements, driven by immediate reactions to geopolitical events, can tempt investors to make hasty decisions that may not align with their strategic objectives. By focusing on long-term goals and adhering to a well-crafted investment plan, investors can better navigate the volatility associated with geopolitical events. As we all know, diversification remains a cornerstone of investing; it is essential to mitigating the impact of geopolitical risks. By allocating investments across various asset classes, sectors, and geographical regions, advisors can help cushion clients’ portfolios against disruptions and strive for more stable long-term returns. Geopolitical events will remain an inherent aspect of the global investment environment. Our role as investment professionals is to navigate these complexities with a balanced and informed perspective, always aligning the advice we provide with the long-term goals of our clients and stakeholders. And our role here at CFA Institute for the past 75-plus years has been to educate. When we do advocate, it is for a distinct purpose: to seek improvements in the investment ecosystem. Our Research and Policy Center contains a library of resources on geopolitics. Our Future State of the Investment Industry report includes a whole section on “Diverging Worlds,” exploring deglobalization, geopolitical tensions, demographic disruption, and more. By leveraging the insights from the CFA Program curriculum, our deep body of research, and adhering to principles of diversification and disciplined investing, we can effectively manage geopolitical risks and continue to uphold the highest standards of professionalism in our industry — all without getting dragged into the raging debates of the day. source

Geopolitical Change: Investors Should Focus on the Long Term Read More »

Bear Market Playbook: Decoding Recession Risk, Valuation Impact, and Style Leadership

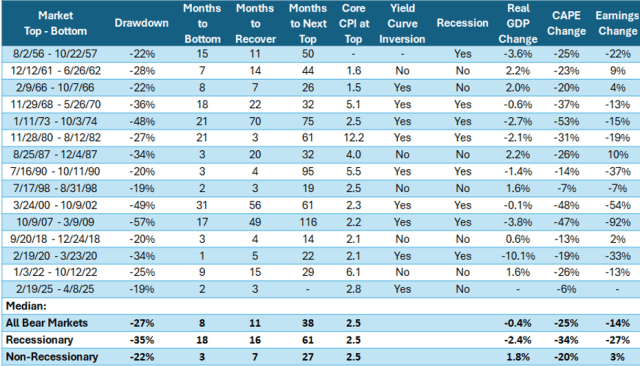
Bear markets are notoriously nerve racking with each drawdown presenting its own set of unique circumstances. Yet history shows that staying invested through volatility is often critical to achieving long-term success.  As the saying goes, volatility is the price you pay for long-term performance. Even the most severe bouts of volatility have not stood in the way of success for investors who maintained a long-term approach to investing. This post provides data to help investors put bear markets in historical context and gain confidence in their long-term investment plans. To do that, we analyzed 15 bear markets since 1950, using the S&P 500 to compare recessionary and non-recessionary declines across three key dimensions — during both drawdowns and recoveries: Magnitude and Duration of Drawdown Magnitude of non-recessionary bears is a shallower -22% compared to the median -35% drawdown felt when bear markets coincide with recessions. Duration of non-recessionary bears averaged only three months compared to 18 months for recessionary. Monetary and Fiscal Policy Trends All the recessionary bear markets occurred with an inverted yield curve. In the only yield curve inversion where a recession was avoided, the deficit to GDP ratio increased by 3% during the period of fed tightening and curve inversion. This has also been true so far in current yield curve inversion period. Investment Style Differentiation Low Volatility and Dividend styles were the most resilient in drawdowns regardless of whether recessionary conditions were present. Recovery performance in non-recessionary periods favored Quality and Growth compared to Value and Small Caps after recessionary bear markets. Recessionary vs. Non-Recessionary There are key differences in recessionary and non-recessionary bear markets. The median drawdown for recessionary bear markets was -35%, about 50% deeper than non-recessionary bears. Non-recessionary bear markets are usually caused by temporary fear that the economy is stalling or entering a recession. And as positive data emerges, the fear — and drawdown — subside. The additional 10% to 20% drawdown seems to coincide with evidence of recession finally surfacing in the data, additionally supported by an extra year of duration as it digests the negative data (not sentiment). Interestingly, there was only one time in history that we have experienced back-to-back, non-recessionary bear markets, and that was during the fiscally supportive 1960s. Figure 1: Bear Markets by the Numbers Disclosures: Please see appendix for definitions and citations.  Bear Markets Tend to Run Deeper When Valuations Are High For our valuation measurement, we decided to use the CAPE ratio because trailing 12-month earnings are highly volatile during recessions, thus distorting the P/E ratio. For example, the 92% drop in earnings in 2008 didn’t reflect longer term views regarding what earnings were likely to be five to 10 years in the future, which is the foundation for point-in-time valuations. We found valuation to be a terrible timing mechanism for both bear markets and recessions, but valuation did often factor into the severity of a bear market — with lofty valuations more often associated with severe bear markets. The link between the severity of the recession and the depth of the bear market is questionable at best. For example, the 2000s bear market started with extreme valuation that was reduced by almost half by the time the market found a bottom. Notably, the 2000s bear market stands out because it had the smallest decline in real GDP of all the recessionary bears, yet it produced one of the longest and deepest drawdowns. Another example of changes in valuation mattering to the severity of bear markets is the 1980 to 1982 drawdown. This was one of the most severe recessions and real GDP declines. However, the starting valuation was cheap, especially by today’s standards, resulting in a rather mild recessionary bear market decline of -27%.  Figure 2: Change in Valuation During Bear Markets Disclosures: Please see appendix for definitions and citations.  Earnings and GDP Impact We took Shiller’s S&P 500 Earnings and analyzed the differences between recessionary and non-recessionary bears. The median earnings decline during recessionary bears was typically negative, corresponding with the shrinking economy. On the other hand, non-recessionary periods often had growing earnings. Another interesting difference between recessionary and non-recessionary bear markets is where the market peaks and bottoms relative to earnings. Non-recessionary bear markets tend to peak and bottom relatively close with earnings. However, recessionary bears tended to bottom in advance of earnings by nine months. Figure 3: Change in Earnings During Bear Markets Disclosures: Please see appendix for definitions and citations.  Monetary and Fiscal Policy: Clues to Recession Risk Fiscal and monetary policy also contribute to the severity of bear markets since they can influence the probability of recessions. The yield curve remains the most reliable predictor over horizons greater than one year, notes a Federal Reserve Bank of Chicago paper. Fed hiking cycles are usually the culprit of yield curve inversions. We count 11 hiking cycles resulting in nine yield curve inversions and eight recessions with corresponding bear markets. The current hiking cycle and yield curve inversion is excluded because the cycle has not yet completed with a yield curve steadily in a positive sloping direction for at least two quarters. The only time a yield curve inversion didn’t lead to a recession was in 1966, when the Fed was raising rates to fight inflation. At the same time, fiscal policy was expansionary, with the deficit-to-GDP ratio rising 3% due to simultaneous spending on the Great Society programs (Medicare and Medicaid) and the Vietnam War. However, government spending increases to boost growth are often followed by an increase in prices, as we just saw post-Covid. In 1967, as inflation reaccelerated, the Fed began a second series of rate hikes leading to the recession and bear market of 1968 to 1970. There are similarities today. Monetary policy has been restrictive but has been offset by government spending with a 3% increase in the deficit-to-GDP ratio. If the goal of Congress and the Administration is to get the budget deficit back down to 3% from its current 6% to 7%

Bear Market Playbook: Decoding Recession Risk, Valuation Impact, and Style Leadership Read More »