CFA Institute

The Fed’s “Time of Testing”: Is This Where the Trouble Will Stop?

“This is a time of testing — a testing not only of our capacity collectively to reach coherent and intelligent policies, but to stick with them.” — Paul Volcker, 9 October 1979 Paul Volcker and his colleagues on the Federal Open Market Committee (FOMC) deserve praise for sticking to their campaign to tighten monetary policy despite the painful recession of 1981 to 1982. Their actions ended the brutal stagflation that tormented the nation in the latter stages of the Great Inflation of 1965 to 1982. Forty years later, it is easy to forget that Volcker’s programs were much harder to defend when he was, in monetary policy terms, blazing a trail through virgin forest. The United States has suffered devastating depressions and financial panics in the course of its history, but there has only been one Great Inflation. Resolving this extraordinary crisis required the US Federal Reserve to enact untested policies that all but assured a deep recession, a sharp decline in asset values, and a painful spike in unemployment. Volcker spoke to the American Bankers Association (ABA) on 9 October 1979 to win their support for these policies, knowing that his prescription would inevitably cause pain and hardship in the short term. He appealed to his audience’s sense of collective responsibility, acknowledging the extraordinary weight placed on their shoulders. After all, bankers, financiers, and investment professionals are stewards of the nation’s credit, which was repaired by Alexander Hamilton in 1790. The ability to maintain that creditworthiness has fueled the US economy, rescued it from economic crises, and protected the nation from foreign threats. The persistent inflation that Volcker was trying to eliminate had damaged the nation’s economic health. Why was inflation so tenacious in the 1970s? One of the most important reasons was a collective failure of policymakers to delay gratification. Unwilling to sacrifice his Great Society programs, scale back the conflict in Vietnam, or damage his own reelection prospects, President Lyndon Johnson insisted the Fed maintain an overly accommodative monetary policy. President Richard Nixon pursued a similarly self-interested course, and inflation took hold and became endemic. Rather than assert the Fed’s independence, Fed chairs William McChesney Martin, Jr., and Arthur F. Burns succumbed to the political pressure. By letting inflation fester for so long, they made it that much more difficult for their successors to tame. Far more economic pain was required to fix the problem than if the Fed had decisively intervened earlier. Volcker recognized the damage that the Fed’s wavering resolve had caused, but he vowed to persevere. “Some would suggest that we, as a nation, lack the discipline to cope with inflation,” he told the ABA. “I simply do not accept that view.” On 13 September 2022, the US Bureau of Labor Statistics reported that the CPI increased at an annualized rate of 8.3%, placing more pressure on the Fed to respond aggressively. When Jerome Powell says that the Fed will keep tightening until the job is done, I strongly believe that he is sincere. But it remains to be seen whether the Fed’s actions will match these words over the coming months. The first series of rate increases and quantitative tightening were relatively painless. The next phase won’t be. If the Fed follows through, the economy will contract, unemployment will rise, and markets will fall. All of this pain is necessary to ensure that the current temporary inflationary event does not morph into a replay of the Great Inflation, which would threaten our long-term prosperity. During the Panic of 1907, J. Pierpont Morgan realized that the failure of the Trust Company of America would be a fatal tipping point that could plunge the country off the economic precipice. Morgan famously stated, “This is where the trouble stops,” and proceeded to orchestrate a rescue. Even after stopping the run at the Trust Company of America, panic continued to spread on Wall Street. Morgan spent the next three weeks rallying the support of trust companies, national banks, private corporations, politicians, and other stakeholders. Together, they pooled their resources and steered the United States away from the edge of the abyss.  His timely leadership — combined with politicians’ terror at the prospect of confronting a future panic without J. Pierpont Morgan — inspired the creation of the Fed six years later. The Fed leadership now faces a similar tipping point. They will need to decide whether they have the resolve to prevent a second Great Inflation. But countering inflation is not the Fed’s responsibility alone to bear: The moment that is now upon us will require everybody to decide whether we will cling to the excessive but unsustainable spoils of the present or sacrifice now in order to build a richer legacy for future generations. I hope we choose the latter. If you liked this post, don’t forget to subscribe to the Enterprising Investor. All posts are the opinion of the author. As such, they should not be construed as investment advice, nor do the opinions expressed necessarily reflect the views of CFA Institute or the author’s employer. Image courtesy of the Edmond J. Safra Center for Ethics. This file is licensed under the Creative Commons Attribution 2.0 Generic license. Cropped. Professional Learning for CFA Institute Members CFA Institute members are empowered to self-determine and self-report professional learning (PL) credits earned, including content on Enterprising Investor. Members can record credits easily using their online PL tracker. source

The Fed’s “Time of Testing”: Is This Where the Trouble Will Stop? Read More »

Equity Risk Premium Forum: Term Structure, Mean Reversion, and CAPE Reconsidered

For more insights on the equity risk premium from Rob Arnott, Cliff Asness, Mary Ida Compton, Elroy Dimson, William N. Goetzmann, Roger G. Ibbotson, Antti Ilmanen, Martin Leibowitz, Rajnish Mehra, Thomas Philips, and Jeremy Siegel, check out Revisiting the Equity Risk Premium, from CFA Institute Research Foundation. “I see evidence of mean reversion over time horizons from 3 years up to 15 years. It’s similar to business cycles having turned from 4-year cycles into 10-year cycles. We have many questions on structural changes. The evidence is really fuzzy, and usable or actionable evidence is almost zilch because of all this horizon uncertainty.” — Antti Ilmanen Does the equity risk premium (ERP) vary depending on the term structure? Does reversion to the mean dictate that it will decrease the longer the time horizon? In the third installment of the Equity Risk Premium Forum discussion, Laurence B. Siegel and fellow participants Rob Arnott, Elroy Dimson, William N. Goetzmann, Roger G. Ibbotson, Antti Ilmanen, Martin Leibowitz, Rajnish Mehra, and Jeremy Siegel explore these questions as well as the effect of noise on the value premium, whether the CAPE works internationally, and how to test a stock–bond switching strategy, among other topics. Below is a lightly edited transcript of this portion of their conversation. Martin Leibowitz: We’ve been talking about “the” risk premium. Will Goetzmann pointed out, though, that over the course of time, the risk premium has declined, depending on whether you invest for 40 years or 400. The idea of the risk premium being a term structure is very important. Because what premium you would demand if you’re investing for 1 year will be different from when you’re investing for 5 years or, say, 100 years. We would expect that to be a declining curve. That’s very important, because investors can choose their time horizon, just as they can in bonds. Over a long time horizon, the risk that is relevant for them may be much less. Rajnish Mehra: No, Marty, that is not correct. You’re assuming mean reversion. If you have an IID [independent and identically distributed] process, then horizon shouldn’t matter. The result that Will got is precisely because there is a mean-reverting component in the dividend structure. If you have mean reversion, Marty, you are 100% correct. Risky assets will look less risky over time. But if the returns are IID draws, then the time horizon wouldn’t make a difference. Jeremy Siegel: That is true, but I’m making one correction. You have to have a degree of risk aversion over 1 for that. You need two conditions for getting a higher equity allocation for longer time periods: mean reversion and risk aversion greater than 1. Rob Arnott: Mean reversion has been a lively topic. It is weak on a short-term basis, which is one reason the CAPE is such a lousy predictor of one-year returns. But on longer horizons, it’s pretty good. Jeremy, you’ve written about this, where 30-year S&P volatility, when annualized, is distinctly lower than the volatility of 1-year returns. This comes from the fact that there is mean reversion over long horizons. For example, 10-year real returns for US stocks have a –38% serial correlation with subsequent 10-year earnings; and 10-year real earnings growth has a –57% correlation with subsequent 10-year earnings growth. That means there is mean reversion. But it acts over a long enough horizon that most people think that returns are IID. William N. Goetzmann: I just have to put in a word here. I spent the first 10 years of my early research career on the weakness of the mean reversion evidence. But then the 2013 Nobel Prize award cited Bob Shiller’s work demonstrating the predictability of stock returns. The evidence is always a bit marginal and depends on your assumptions and on where you get the data. And, as Amit Goyal and Ivo Welch have shown, sometimes it sort of falls in the statistically significant zone, and sometimes it kind of falls out of it. It depends on when you’re doing your measurement. So, it’s a bit of a chimera to say that we know for sure. I’m not entirely convinced that you would bet your wealth on this reversion process. Antti Ilmanen: When I look at the literature, I see evidence of mean reversion over time horizons from 3 years up to 15 years. It’s similar to business cycles having turned from 4-year cycles into 10-year cycles. We have many questions on structural changes. The evidence is really fuzzy, and usable or actionable evidence is almost zilch because of all this horizon uncertainty. By the way, I wanted to comment earlier on mean reversion in a different context, not about the premium but about the riskiness of stocks being related to the time horizon. There is a counterargument by Lubos Pastor and Robert F. Stambaugh that equity risk doesn’t decline with horizon. When you take into account parameter uncertainty — the fact that we don’t know how big the equity premium is — their analysis suggests that risk in equities doesn’t decline with the time horizon and, if anything, rises with it. Visualizing Returns over Time: Trumpets and Tulips Roger Ibbotson: Even if returns were IID, what you would get, of course, is a lognormal spreading out of wealth outcomes over time — times the square root of time. And the compounded return is divided by the square root of time. So, you get two entirely different shapes, depending on whether we’re talking about the compound return or just your ending wealth. Over time, ending wealth spreads out, in the shape of a tulip. The compound annual return, in contrast, is averaging out and looks more like a trumpet. The tulips and trumpets apply only if returns are IID. If there’s some other sort of return pattern, then the shapes will be different. Coping with Parameter Uncertainty J. Siegel: Antti, I want to return to what you said about Pastor and Stambaugh. Parameter uncertainty also applies to bond returns — you don’t know what the parameters are for the real rcapeisk-free

Equity Risk Premium Forum: Term Structure, Mean Reversion, and CAPE Reconsidered Read More »

Do Sentiment Metrics Matter to the Markets?

Consumer spending accounts for almost 70% of nominal US GDP. As such, consumer sentiment ought to have some correlation with market performance. Financial journalists certainly act as though it does. Whenever new sentiment or confidence numbers — consumer or otherwise — are released, pundits spring into action, speculating on what the data’s implications are for the markets and the overall economy. But how much do these measures actually matter to market performance? To answer this question, we explored the correlations between consumer and business sentiment metrics and market returns. Specifically, we examined monthly data from the University of Michigan Consumer Sentiment Index, the Conference Board’s US Consumer Confidence Index (CCI), and the Business Confidence Index (BCI) and compared their relationship to the performance of nine different MSCI stock and bond indices going back to the 1970s, focusing on US high-yield bonds, US long-term bonds, US short-term bonds, US aggregate fixed income, US growth equity, US value equity, US small cap, US large cap, and international equity.  In aggregate, we did not find any significant or sustained correlation between market returns and the three sentiment measures over the entire 50-plus year sample period. The highest correlation, between the University of Michigan Consumer Sentiment Survey and US small-cap stocks, maxed out at a weak 0.21. Correlations between Changes in Consumer Confidence Indices and Investment Returns, 1970s to 2020s Michigan ConsumerSentiment Index Consumer ConfidenceIndex (CCI) Business ConfidenceIndex (BCI) US High-Yield Bond 0.18 0.17 –0.01 US Long-Term Bond –0.01 0.04 –0.10 US Short-Term Bond –0.01 0.03 –0.11 US Fixed Income –0.01 0.08 –0.13 US Growth 0.14 0.12 0.07 US Value 0.17 0.15 0.07 US Small Cap 0.21 0.14 0.11 US Large Cap 0.15 0.15 0.06 International 0.15 0.18 0.12 Yet over time, the correlations exhibit some illuminating trends. The University of Michigan Consumer Sentiment Index’s correlation with equity returns has diminished. Indeed, since 2010, it has fallen precipitously and been statistically indistinguishable from zero. University of Michigan Consumer Sentiment Index: Historical Market Correlations 1970s 1980s 1990s 2000s 2010s 2020s US High-Yield Bond 0.24 –0.05 0.34 0.35 –0.09 0.20 US Long-Term Bond 0.24 –0.19 0.01 0.17 –0.13 –0.07 US Short-Term Bond 0.23 –0.09 –0.09 0.05 –0.16 0.14 US Fixed Income 0.22 –0.15 –0.01 0.13 –0.18 0.09 US Growth 0.09 0.29 0.12 0.24 –0.04 –0.05 US Value 0.13 0.27 0.11 0.31 –0.07 0.01 US Small Cap 0.08 0.33 0.18 0.36 0.00 0.04 International 0.08 0.31 0.10 0.28 –0.12 0.06 US Large Cap 0.11 0.25 0.13 0.28 –0.03 –0.02 International 0.08 0.31 0.10 0.28 -0.12 0.06 The CCI, however, has displayed the greatest positive correlation to equity returns since the 2000s. And since 2020, equity correlations and bond correlations have averaged a rather significant 0.30. Consumer Confidence Index (CCI): Historical Market Correlations 1970s 1980s 1990s 2000s 2010s 2020s US High-Yield Bond 0.25 0.014 0.16 0.15 0.20 0.35 US Long-Term Bond 0.09 0.01 –0.04 –0.02 –0.09 0.26 US Short-Term Bond 0.04 –0.04 –0.09 –0.09 0.10 0.34 US Fixed Income 0.16 0.03 –0.07 –0.04 0.05 0.36 US Growth 0.00 0.01 0.03 0.25 0.18 0.22 US Value 0.04 –0.01 0.04 0.30 0.19 0.27 US Small Cap 0.08 0.01 0.06 0.22 0.17 0.32 US Large Cap –0.02 0.01 0.04 0.29 0.18 0.24 International 0.03 0.01 0.10 0.28 0.22 0.41 The BCI shows a similar trend. The BCI has charted its highest positive correlations with the equity return measures, with the upswing beginning in the 2010s. The Business Confidence Index (BCI): Historical Market Correlation 1970s 1980s 1990s 2000s 2010s 2020s US High-Yield Bond –0.29 –0.15 0.03 0.13 0.19 0.22 US Long-Term Bond –0.35 –0.21 –0.11 0.05 –0.06 0.09 US Short-Term Bond –0.12 –0.17 –0.22 0.04 0.06 0.06 US Fixed Income –0.39 –0.18 –0.16 0.08 0.06 0.14 US Growth 0.14 –0.04 0.07 0.09 0.20 0.11 US Value 0.05 –0.09 0.05 0.10 0.23 0.23 US Small Cap 0.13 –0.02 0.10 0.15 0.23 0.23 US Large Cap 0.06 –0.09 0.07 0.09 0.21 0.17 International 0.11 0.01 0.15 0.16 0.17 0.28 That markets correlate more with the CCI and BCI than the University of Michigan Consumer Sentiment Index has several potential implications. Perhaps the CCI and BCI have grown in prestige over time relative to the Michigan index and now the market pays more attention to them. Or maybe their methodologies better reflect an evolving market and economy. Of course, whatever the roots of these phenomena, the larger takeaway given the relative weakness of these correlations is that financial journalists and commentators may derive more meaning from these metrics than they warrant. If you liked this post, don’t forget to subscribe to the Enterprising Investor. All posts are the opinion of the author. As such, they should not be construed as investment advice, nor do the opinions expressed necessarily reflect the views of CFA Institute or the author’s employer. Image credit: ©Getty Images / Natee Meepian Professional Learning for CFA Institute Members CFA Institute members are empowered to self-determine and self-report professional learning (PL) credits earned, including content on Enterprising Investor. Members can record credits easily using their online PL tracker. source

Do Sentiment Metrics Matter to the Markets? Read More »

Top 10 Posts from 2024: Private Markets, Stocks for the Long Run, Cap Rates, and Howard Marks

Asset owners have dramatically increased their allocations to private markets over the past two decades, driven largely by a mistaken belief that private debt and equity deliver returns that are orders of magnitude above those of public markets. What makes most investors believe that private capital funds are such clear outperformers? In the first of his three-part series, Ludovic Phalippou, PhD, says the use of since-inception internal rate of return (IRR) and the media’s coverage are to blame. This is the third in a three-part series from Edward McQuarrie that challenges the conventional wisdom that stocks always outperform bonds over the long term and that a negative correlation between bonds and stocks leads to effective diversification. In it, McQuarrie draws from his Financial Analysts Journal paper analyzing US stock and bond records dating back to 1792. The relationship between capitalization rates (cap rates) and interest rates is more nuanced than first meets the eye. Understanding their interplay is a cornerstone of real estate investment analysis. In this blog post, Charles De Andrade, CAIA, and Soren Godbersen dissect historical data and discuss current and future opportunities. Risk is not simply a matter of volatility. In his new video series, How to Think About Risk, Howard Marks delves into the intricacies of risk management and how investors should approach thinking about risk. He emphasizes the importance of understanding risk as the probability of loss and mastering the art of asymmetric risk-taking, where the potential upside outweighs the downside. With the help of our Artificial Intelligence (AI) tools, we summarized key lessons from Marks’s series to help investors sharpen their approach to risk. Private equity portfolio companies are about 10 times as likely to go bankrupt as non-PE-owned companies. Granted, one out of five companies going bankrupt doesn’t portend certain failure, but it is a startling statistic. To understand what private equity is at its worst is a call to action, personally and professionally. We need to monitor the specific and repetitive activities that benefit the operators and no one else. Alvin Ho, PhD, CFA, and Janet Wong, CFA, share strategies gleaned from their fireside chat with Brendan Ballou and hosted by CFA Society Hong Kong. Will the son of a billionaire perpetuate his inherited wealth? Apparently not, if history is any guide. In fact, there is strong evidence that most “rich families” will be poorer after several generations. Some of the reasons for this are systemic, but most factors that diminish a family’s wealth over generations are the choices that heirs make, writes Raphael Palone, CFA, CAIA, CFP. Traditional investment approaches assume investors have equal access to market information and make rational, emotionless decisions. Behavioral finance challenges this by recognizing the role emotions play. But the ability to quantify and manage these emotions eludes many investors. They struggle to maintain their investment exposures through the ups and downs of market cycles. In this post, Stephen Campisi, CFA, introduces a holistic asset allocation process to manage the phenomenon of regret risk by considering each client’s willingness to maintain an investment strategy through market cycles. Hedge funds have become an integral part of institutional portfolio management. They constitute some 7% of public pension assets and 18% of large endowment assets. But are hedge funds beneficial for most institutional investors? Richard M. Ennis, CFA, found that hedge funds have been alpha-negative and beta-light since the global financial crisis (GFC). Moreover, by allocating to a diversified pool of hedge funds, many institutions have been unwittingly reducing their equity holdings. He proposes a targeted approach that may justify a small allocation to hedge funds and cites new research that leaves the merit of hedge fund investing open to debate among scholars. Robert Shiller’s cyclically adjusted price-to-earnings ratio (CAPE) is approaching historically high levels. In fact, CAPE’s current value has been exceeded only twice since 1900. But should you care? Investment professionals know that despite CAPE’s historical tendency to anticipate equity market returns, it isn’t a reliable market-timing tool. Marc Fandetti, CFA, shares evidence that CAPE changed in the 1990s and that mean-reversion concerns may be misplaced. After World War II, the portfolios of US institutional investment plans began growing rapidly. As of 2021, the total assets held by US public and private pensions alone exceeded $30 trillion. Much like their predecessors in the mid-1900s, the trustees that oversee these assets have limited time and variable levels of expertise. This forces them to rely on the advice of staff and non-discretionary investment consultants. Mark J. Higgins, CFA, CFP, reveals an especially pernicious bias of investment consultants that is often masked by the inaccurate claim that their advice is conflict-free.  source

Top 10 Posts from 2024: Private Markets, Stocks for the Long Run, Cap Rates, and Howard Marks Read More »

Project Finance: Beware Interest Rate Miscalculations

Interest rates are like the weather. We can prepare for typical fluctuations, but sudden changes can still catch us by surprise. After the global financial crisis (GFC), for example, we enjoyed a decade of clear skies and low rates. Even as the winds rose in 2019 and the economy struggled with a higher federal funds rate, the gusts soon dissipated and zero interest rates returned. But in the last two years, the interest rate equivalent of a violent storm has descended. Desperate to battle inflation, the US Federal Reserve has hiked at an unprecedented pace as the federal funds rate hit its highest point in more than 22 years, with a target range of 5.25% to 5.50%. The Fed’s moves have caught many unprepared. Consider Saudi Arabia. Its private sector has experienced remarkable credit expansion in the last few years. The July 2023 Monthly Statistical Bulletin from the Saudi Central Bank (SAMA) indicates that banks’ credit exposure to the private sector grew at a compounded annual rate of 10% from 2018 to 2022. This growth culminated in a record outstanding credit of SAR 2.4 trillion, or the equivalent to US$0.64 trillion. Notably, almost half of this exposure has a maturity period exceeding three years. Meanwhile, since the launch of the 2030 Vision, Saudi Arabia has announced around US$1 trillion in real estate and infrastructure projects. Last June, the National Privatization Center & PPP (NPC) declared a pipeline of 200 projects across 17 sectors, reinforcing the commitment to public-private partnership initiatives. These initiatives, combined with the massive credit expansion in the private sector, mean that many projects have long-dated floating borrowing exposure. And interest rate volatility has put them under more pressure than ever before. The risk? Failing to accurately plan for rate changes. The consequences? Spiraling costs, blown budgets, and an uncertain future. The question is, How do we navigate this storm? The Financial Model and Interest Rate Assumptions Interest rate assumptions are central to leveraged transactions with extended exposure. For long-term projects under SAR borrowing, liquidity typically permits hedging for five to seven years. Consequently, lender covenants require many projects to hedge a substantial portion of this borrowing. But how do we address the exposure’s remaining lifespan? Many projects apply static, unsubstantiated interest rate assumptions, particularly for periods beyond 7 to 10 years. These are clearly unsuitable for today’s climate of evolving rates. Therefore, the models have to be recalibrated to reflect elevated rates and a reasonable interest rate curve extrapolated. Addressing the Present Dilemma Adjusting models to the current interest rate environment after the fact will undoubtedly affect core profitability metrics and may even compromise a project’s financial viability. The ramifications grow more severe with increased leverage. Yet failing to address the problem will only compound the negative consequences. Projects facing higher interest rates need to update the models to assume a painful current environment if the floating debt portion is material. This challenge remains even when the debt is partially hedged. Therefore, the project company has to examine long-term borrowing implications as well as the immediate exposures. So, how should companies navigate this environment? And is derivative hedging the only answer? The On-Balance-Sheet Approach A primary approach should be looking at the balance sheet. The financial evaluation of a project must consider the prevailing interest rate conditions. If it shows enhanced performance in its current phase — whether construction or operation — then debt refinancing for more favorable terms may be an option. Alongside this review, the project’s covenants need to be monitored in line with both commercial and accounting objectives. Any refinance proposition, however, must correspond to the agreed terms and conditions governing the underlying financing documents. Project finance lenders usually agree to a soft mini perm financing structure. What is a mini perm? It is a type of loan that has a short- to medium-term initial period during which the borrower pays only interest or a combination of interest and a small amount of principal. This incentivizes projects to refinance at initial maturity (medium term; five to seven years post drawdown). For new projects, the cash sweep, pricing mechanism, and other key terms need to be carefully recalibrated to best influence the underlying project economics for the sponsors. Increased financial performance and creditworthiness could lower the credit spread upon refinancing. This can reduce interest expenses, bolster the cash flow, and otherwise cushion the impact of a higher rate environment. Improved project outcomes also afford companies increased leverage in negotiations, potentially securing advantageous debt terms and less stringent covenants. This facilitates greater financial and operational latitude. A vital component of this on-balance-sheet strategy is the potential to release equity value by refinancing on more flexible terms. Replacing a segment of debt with equity financing can sustain the project company’s balance sheet and amplify its financial resiliency. Proper refinancing can recalibrate the capital structure, ensuring that debt maturity and costs correspond with the project’s cash flow capabilities — and strengthen its financial standing. Ultimately, these benefits can bolster investor trust, particularly for publicly traded entities. Enhanced confidence can widen the investor pool and augment the liquidity of debt securities in secondary markets, especially in instances of public Bond/Sukuk issuance. The Off-Balance-Sheet Approach The “Blend and Extend Strategy” enjoyed its time in the sun during the pandemic. Interest rates presented an opportunity, and many sought to prolong their higher fixed interest rate swaps (IRS) hedging. This extended high-rate hedges beyond their maturity to capitalize on reduced swap rates, thereby achieving a blended, diminished rate. By merging an existing swap and a new one into an extended term swap, entities could immediately ease cash flow burdens and spread the swap’s adverse liability over a prolonged period. The current scenario presents the reverse opportunity. A project company with an extended IRS but only partial hedging against debt exposure can alleviate liquidity risk and looming covenant breaches. The project company might reduce the duration, channeling the favorable mark to market (MTM) to broaden short-term hedge coverage. But what about the

Project Finance: Beware Interest Rate Miscalculations Read More »

Distressed Debt: Which Sectors Offer Value?

Each cycle in distressed debt investing is different. During the global financial crisis (GFC), many otherwise viable companies faced a liquidity crisis. Prior to that, as the tech bubble burst in the early aughts, Global Crossing, Nortel, and Lucent, among other firms, applied too much leverage and, in the face of insufficient demand, had to restructure or in some cases go into liquidation. In the 14 years of the post-GFC cycle, the US federal funds rate and the Government of Canada rate stayed exceptionally low, hovering around 1%, plus or minus. During this era, every financial transaction, whether a business acquisition or refinancing, created paper at historically low rates. Now, in a higher rate regime, many of these layers of corporate debt cannot be easily refinanced. Clearly, this is bad news for the original owners of that paper. But it could be very good news for investors seeking attractive, non-correlated returns in publicly traded stressed and distressed credit. Indeed, amid speculation about what central banks will do next, investors cannot ignore how far bond prices have dropped. For stressed companies, the price dislocation has increased, and that creates a growing opportunity set for credit market investors. Since 2008, central banks have been quick to buy bonds and other securities to shore up the markets during periods of high volatility. One outcome of this quantitative easing (QE) regime is that distressed debt investors must be poised and ready to seize opportunities in whatever sector they arise. Right now may be an ideal time to lean into a stressed and distressed debt mandate. The quality of companies experiencing credit stress has never been higher, and in some sectors the margins of safety have not been this favorable in decades. According to Howard Marks, CFA, co-founder of Oaktree Capital, we are in a “sea change” environment of nominally higher rates where “buyers are not so eager, and holders are not so complacent.” Companies experience credit stress for a variety of reasons. It could be the classic case of taking on too much debt. It could be the result of a poor acquisition or ill-advised debt-funded share repurchases. Maybe the managers’ forecasts were overly optimistic and earnings and cash flow disappointed. In such moments, rolling over the debt may no longer be an option, and in a rising rate environment, the debt becomes harder to service. Investors begin calculating the probability of a default or sale, and the price of the bonds goes down. Utilities and REITs are among the sectors that are often funded by debt issuance. Nevertheless, sector agnosticism is advisable when it comes to stressed and distressed credit. After all, such investments are idiosyncratic by nature, and whatever the industry, buying a good-quality bond for 50 cents on the dollar is always a good idea. Not so long ago, in 2015 and 2016, the energy sector experienced a drought, and in 2018, it was the homebuilding industry’s turn. There will always be pockets of stress in different sectors at different times. Today, traditionally defensive sectors may offer a rich vein of value. Health care and telecommunications, for example, have tended to be resilient in this regard. Why? Because people are much more likely to cancel their Maui vacation than their iPhone, and given the choice between a hip replacement and a Winnebago, they will opt for the former. Hence, the top lines in these sectors tend to remain quite strong. Nevertheless, we are in a recessionary period, and rising labor costs are pinching margins. The small and middle ends of the issue market are also worth exploring. These may offer a better risk/reward scenario with less competition since the larger distressed credit funds cannot invest in companies of this size. After all, size is the enemy of returns: At some point, the largest funds become the market and can no longer generate alpha. Smaller, more nimble investors are thus better positioned to jump in and capitalize on the opportunities. All in all, the current environment may be the best that credit investors have seen in at least a generation. Unlike equity investors, they have capital priority, and even in a worst-case-scenario, those holding the higher tiers in the capital structure will realize value — sometimes abundant value. Nevertheless, credit investors should stay more risk-focused than return-focused and work to identify those investments with the most appealing risk/reward ratios. If you liked this post, don’t forget to subscribe to the Enterprising Investor. All posts are the opinion of the author(s). As such, they should not be construed as investment advice, nor do the opinions expressed necessarily reflect the views of CFA Institute or the author’s employer. Image credit: ©Getty Images / Ivan-balvan Professional Learning for CFA Institute Members CFA Institute members are empowered to self-determine and self-report professional learning (PL) credits earned, including content on Enterprising Investor. Members can record credits easily using their online PL tracker. source

Distressed Debt: Which Sectors Offer Value? Read More »

Escaping the Benchmark Trap: A Guide for Smarter Investing

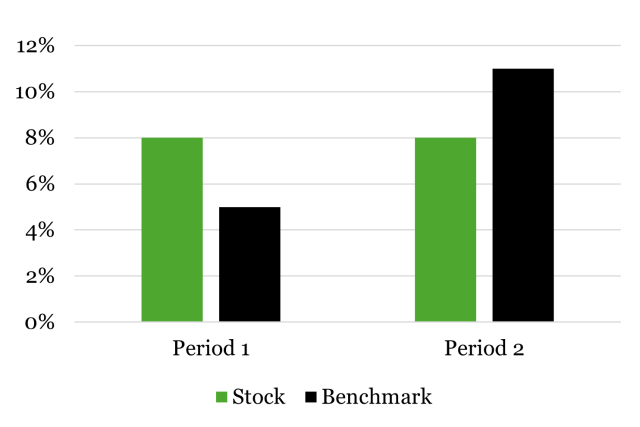
Pim van Vliet, PhD, is the author of High Returns from Low Risk: A Remarkable Stock Market Paradox with Jan de Koning. In the world of professional investing, a scary obsession has taken hold: the fixation on benchmarks and relative performance. This phenomenon, which I’m coining “benchmarkism,” is distorting incentives and pulling many institutional investors in the wrong direction. It’s time to explore how we can escape this benchmark trap for smarter investing where the focus is on  stable long-term wealth growth. The Rise of the Benchmark The rise of investment benchmarks started in the late 19th century when Charles Dow introduced the Dow Jones Industrial Average in 1896. At that time, the role of benchmarks was minimal. Investors were primarily focused on dividends, as demonstrated by funds like those offered by Robeco. Benchmarks played no role in Robeco’s funds until decades after the firm was founded in 1929. It wasn’t until the efficient market hypothesis gained prominence in the 1960s that benchmarks started becoming the investment industry’s central performance yardstick. Today, beating benchmarks is often seen as the definitive measure of success, overshadowing the most fundamental rules of investing — don’t lose capital and achieve an adequate return. Investors are increasingly fixated on relative short-term performance. John Maynard Keynes once quipped, “It is better to fail conventionally than to succeed unconventionally.” Nowhere is this statement embraced with as much approbation as in today’s benchmark-driven world. The Core Problem of Benchmarkism The crux of the problem with benchmarkism is that it shifts the investor’s focus away from absolute returns and capital preservation. Benchmarkism shifts the focus to outperforming the benchmark. But this can result in irrational decision-making. Imagine a portfolio manager choosing between a stable stock offering an 8% return and an index fund that averages 8% but fluctuates wildly. Logically, most investors would pick the stable stock for its lower absolute risk. Yet, a manager aiming to beat the benchmark might avoid the stable stock because it offers periods of no outperformance, which is a substantial risk in the realm of benchmarkism. This dilemma is illustrated in Figure 1. Exhibit 1. Stable stock versus volatile benchmark. A hypothetical example of returns of a stock and the benchmark in two periods. This behavior reflects how the drive to beat benchmarks can push investors to take on additional risks, diverting attention away from the two fundamental investment principles: capital preservation and long-term wealth growth. In bond markets, for example, debt-laden countries or corporations often get larger weights in bond indices. As a result, portfolios are often tilted toward the riskiest issuers, simply because they carry more debt. That’s the paradox of benchmark investing: it encourages risk-taking in pursuit of relative gains, sometimes at the expense of common sense. Historical Lesson of Fisher Black The focus on relative return over risk management isn’t new. Fisher Black — one of the architects of the now 60-year-old capital asset pricing model (CAPM) — tried to launch a low-risk equity fund at Wells Fargo in the early 1970s. His research demonstrated that low-beta stocks could achieve market-like returns with reduced capital risk. The fund aimed to profit from this principle of “winning by losing less.” Yet, it didn’t take off. The problem? Black’s innovative strategy faced leverage constraints, and investors were more focused on beating the market than reducing risk.[i] Ironically, it wasn’t until the dot-com bubble burst in 2000 and the financial crisis of 2008 that defensive, low-volatility strategies gained real traction. Several low-volatility ETFs became very popular, attracting large inflows in the early 2010s.[1] Today, Black’s idea is more relevant than ever. Defensive strategies have demonstrated their resilience by outperforming during downturns such as in 2022. However, the emphasis on relative performance often makes these strategies appear less appealing against an increasingly concentrated benchmark in bullish markets, as seen in the ongoing US tech rally of 2024. The Broader Risks of Benchmarkism The unintended consequences of benchmarkism extend beyond individual portfolios. By focusing solely on beating the benchmark, many institutional investors have become hostages to indices. This focus can lead to misallocation of capital, where risky investments become overvalued and safer ones remain underappreciated. A clear example of this was during the late 1990s tech bubble, when technology stocks became grossly overvalued as they gained larger and larger weights in the indices. Worse still, regulatory frameworks can reinforce this behavior. In countries like the Netherlands, corporate pension funds are required to explain why their performance deviates from the benchmark, often penalizing funds that pursue more defensive strategies. In Australia, the “Your Future, Your Super” law pressures investors to stick to benchmark-like returns, even when it might not be in the best long-term interest of their beneficiaries. The result? Professional investors, bound by fiduciary duties and regulatory oversight, cannot reduce the absolute risk in their equity portfolio to avoid falling behind their increasingly concentrated benchmark, even in markets that exhibit speculative bubbles or systemic instability. The Role of Index Committees The influence of benchmark providers, such as MSCI, is another critical factor to consider. These committees wield immense power in deciding which stocks or countries are included in an index. Their decisions, often shaped by lobbying efforts, have profound implications for global investment flows. A notable example is the inclusion of local Chinese stocks in global indices since 2018, which prompted investors worldwide to allocate capital to China, regardless of specific governance issues or geopolitical risk involved. Index providers are also lobbying to embed their benchmarks into regulatory frameworks. Recent moves in Brussels to incorporate Paris-Aligned benchmarks into the Sustainable Finance Disclosure Regulation (SFDR) illustrate how the subjective choices of index providers can steer large-scale investment flows. Yet these indices are not always consistent. For example, Nexans, a company central to the energy transition, was excluded from the Paris-Aligned High Yield Index due to its carbon emissions, while Ford Motor — a largely carbon-fuel-based automaker — was included. Such inconsistencies reveal the risks of relying too heavily on benchmarks. Benchmarks Unchained: Is There an

Escaping the Benchmark Trap: A Guide for Smarter Investing Read More »

The Witch of October Is Here: Remember Short-Term Pain = Long-Term Progress

The month of October strikes fear in the hearts of many Wall Street veterans — and for good reason. Over the last 123 years, 7 of the 10 worst days in US stock market history occurred during this seemingly haunted 31-day stretch. But there’s nothing supernatural about these October scares: They are the remnants of the 19th century agricultural financing cycle. During the 1800s, farmers harvested and shipped their crops to market in the fall, paying for the operation with large withdrawals from their local banks. These banks, in turn, withdrew funds from larger New York City banks and trusts to replenish their reserves, which made Wall Street financial markets especially vulnerable to panics. Even after the United States transitioned to an industrial economy and re-established a central banking system in the early 1900s, the memories of past Octobers seem to have conditioned investors to erupt in panic out of habit. October 2022 may be just the latest manifestation. Costs of Closet Tactical Asset Allocation Panic is the mortal enemy of long-term investors, especially in volatile markets, but that does not mean that we should sit idly by in the face of another October scare. At times like these, the late David Swensen‘s observation in his classic Unconventional Success is worth remembering: “Perhaps the most frequent variant of market timing comes not in the form of explicit bets for and against asset classes, but in the form of passive drift away from target allocations.” Many investors fail to heed this advice at the very moments when it is most valuable. Instead, they let their gains ride in bull markets and then freeze up when markets descend into bear territory. This is precisely the insidious form of tactical asset allocation referenced by Swensen. But history shows this is never wise. For every savant who successfully traverses the treacherous macroeconomic currents, many more suffer financial ruin while making the attempt. Failure to rebalance may not be ruinous, but it will almost certainly drag down long-term returns. Dow Jones Industrial Average: 10 Worst Trading Days: Date One-Day Decline 19 October 1987 -22.6% 28 October 1929 -12.8% 29 October 1929 -11.7% 18 December 1899 -8.7% 14 March 1907 -8.2% 26 October 1987 -8% 15 October 2008 -7.9% 18 October 1937 -7.8% 1 December 2008 -7.7% 8 October 2008 -7.3% Source: Dividend.com So, why is such tactical asset allocation so common among pension funds, foundations, endowments, and other institutional investors? Since many are advised by non-discretionary investment consultants who lack the authority to rebalance portfolios, they simply neglect to advise their clients to do so. But trustees need to take the initiative and ensure that they follow through on rebalancing during times like these. Short-Term Pain and Long-Term Gain In Principles, Ray Dalio advises readers to seek painful feedback so that they can confront their deficits and attain the insight necessary to eliminate them. He often repeats the mantra: Pain + Reflection = Progress. Economic events follow a similar principle. Today’s economic pain will likely intensify in the coming months, but that doesn’t mean that we suffer needlessly. The mistakes of the past must be corrected. Elevated inflation has persisted for too long, and re-establishing price stability is absolutely essential to ensure future economic prosperity. We learned this in the 1980s. There is no need to learn it again in the 2020s. We have to break the back of inflation, and while that will be painful, it will be worth it. Today’s hardships will not be for naught. After the recession of 1981 and 1982 subsided, the US economy came back stronger. Fueled by extraordinary technological innovation, the country went on to enjoy two decades of economic prosperity. The past two and a half years have had plenty of financial scares. We may see more this October and in the months ahead. But when it passes, we will breathe freely again. In the meantime, we need to steel our nerves, rebalance our portfolios, and trust that the pain we suffer now will be rewarded in the future. If you liked this post, don’t forget to subscribe to the Enterprising Investor All posts are the opinion of the author. As such, they should not be construed as investment advice, nor do the opinions expressed necessarily reflect the views of CFA Institute or the author’s employer. Image credit: ©Getty Images/Đorđe Milutinović Professional Learning for CFA Institute Members CFA Institute members are empowered to self-determine and self-report professional learning (PL) credits earned, including content on Enterprising Investor. Members can record credits easily using their online PL tracker. source

The Witch of October Is Here: Remember Short-Term Pain = Long-Term Progress Read More »

Global Fungible Money Flows Heighten Volatility Risks

Rapid yen appreciation in this year’s third quarter attracted policy attention when it triggered a brief-but-disruptive volatility surge across major asset markets. The precise contagion emerged quickly. The unwinding of yen carry-trades estimated in the order of several hundred billion dollars ignited a vicious cycle of forced liquidations. As currency gains lifted the repayment costs of yen loans funding non-yen investments, attempts to sell non-yen assets in haste to repay yen debt exacerbated both the yen rally and the local currency assets rout. Even though market sentiment eventually rebounded and volatility fell, the existence of substantial fair-weather carry-trades — made possible by institutional foreign currency borrowing — attracted policy attention. A mirage of “plentiful liquidity” that comingles “sticky” money supply with “transitory” flows likely overstated the financial system’s resiliency and market depth. In the context of Warren Buffett’s remark that “You don’t find out who’s been swimming naked until the tide goes out,” transitory liquidity from carry-trades were part of a recent phenomenon that kept markets’ “water level” artificially high and swimmers content, at least until 3Q 2024 demonstrated the fleeting nature of “liquidity-on-loan.” Fungible Money Sustained Buoyant Asset Prices Despite Rate Hikes In a subsequent interview, BIS Economic Adviser and Head of Research Hyun Song Shin reflected on the implications of the yen carry-trade unwind. Prior to the volatility episode, asset markets were recipients of inflows from institutional currency borrowing, commonly known as FX swaps. Such swaps bridges sources of cheap liquidity — like Japan — with markets of higher-yielding assets — like the United States. Amid rising FX swap flows, the yen carry-trades gradually evolved from retail investors in Japan putting yen savings into higher-yielding foreign currencies to market-moving institutional “yield-seeking” flows.   Figure 1. While FX swaps originally served the goal of currency hedging, Shin noted that financial uses of the FX swaps to convert borrowed cash into foreign currencies now represent the lion’s share of this market. Thus, institutions “not constrained by the funding currency” can source liquidity anywhere that is economic to do so, and FX swaps “project” these funds from one market to another, potentially drowning out local monetary measures and market signals. Shin proposed that if money is already “fungible across currencies” in the current system, then such borderless money erodes the importance of local money supply managed by national central banks. This also rationalizes the puzzling coexistence of high interest rates and buoyant asset valuations. If money supply is tight in the United States but loose in Japan, FX swaps can turn cheap liquidity under BOJ’s easing regime into “fungible dollars” to buy US assets and erode the effect of Fed tightening. This also explains the 3Q 2024 volatility spike and subsequent risk sentiment rebound seen in Figure 2. Both did not coincide with material changes in U.S. domestic liquidity conditions. For carry-trades inject or drain “transitory” liquidity unrelated to domestic liquidity conditions under the Fed’s purview. Figure 2. Borderless, Flighty Liquidity Complicates Policy Transmission and Heightens Market Volatility Under contemporary central bank frameworks, asset prices are key to monetary policy transmission. The state of risk appetite in equity and corporate debt markets, short-term and long-term interest rates, and currency valuations act as central banks’ conduit to influence activities in the real economy. Numerous financial conditions indices (FCIs) would measure the effective policy stance transmitted to the economy: Easier FCI: Markets relay looser policy to the economy via higher equity prices, lower yields, cheaper currency. Tighter FCI: Markets transmit restrictive policy via lower stock prices, higher yields, and stronger currency.  The existence of substantial carry-trade flows therefore adds “noise” to policy transmission by easing or tightening FCI on its own. If a national central bank intends to tighten policy, large carry-trade inflows enabled by cheap liquidity abroad and FX swaps erode such policy stances. Conversely, a carry-trade unwind reduces the easing effect of rate cuts. To asset markets, weaker policy influence on financial conditions implies greater hurdles to assess liquidity risk premium. Money supply suggests one liquidity condition, while “transitory” institutional carry-trades further modifies that calculus. The policy and market challenges together suggest higher symmetrical market volatility. In other words, euphoric rallies from inflows that eclipse policy tightening vs. asset routs from panic-induced unwinds that fuel calls for policy easing. If you liked this post, don’t forget to subscribe to the Enterprising Investor. All posts are the opinion of the author. As such, they should not be construed as investment advice, nor do the opinions expressed necessarily reflect the views of CFA Institute or the author’s employer. Image credit: ©Getty Images / Ascent / PKS Media Inc. Professional Learning for CFA Institute Members CFA Institute members are empowered to self-determine and self-report professional learning (PL) credits earned, including content on Enterprising Investor. Members can record credits easily using their online PL tracker. source

Global Fungible Money Flows Heighten Volatility Risks Read More »

The Downgrade Is Done. The Investor Response Is Just Beginning

For global investors and institutional asset managers, Moody’s downgrade of US sovereign debt is more than a symbolic signal — it’s a market event with portfolio-level consequences. The move by Moody’s to cut the US rating to Aa1 reflects growing concern about long-term fiscal stability, and it forces investment professionals to reassess Treasury exposure, sovereign risk modeling, and forward-looking allocation strategies. Downgrade with Real Implications When Moody’s stripped the United States of its triple-A rating after markets closed last Friday (May 16), it cited a “rising tide of debt” and prolonged fiscal inaction. While the downgrade does not change the fundamentals of the US economy, it marks a moment of strategic reflection for global investors. Rising Debt and Political Gridlock Moody’s decision did not occur in a vacuum. It followed years of fiscal strain amid gridlock in Washington. Federal debt has surged relative to GDP, and Moody’s projects deficits reaching nearly 9% of GDP by 2035, up from 6.4% in 2024. The political context was pivotal. The downgrade came amid contentious showdowns over the debt ceiling and federal budget. As this blog went to press, the US House narrowly passed a sweeping tax and spending bill. The statutory debt limit, reinstated in January 2025 at $36.1 trillion, was fast approaching. Analysts warned that the United States could default by mid-July if Congress failed to act. The Trump Administration and Congress had prioritized tax relief and strategic investments to support economic growth, while maintaining a commitment to fiscal responsibility over the long term. Moody’s warned that extending the 2017 tax cuts would significantly worsen the outlook, adding roughly $4 trillion to deficits over the next decade. Just hours before the downgrade, budget negotiations faced renewed challenges in Congress, underscoring the complexities of achieving bipartisan consensus on long-term fiscal solutions. Investor Response and Repricing Risk The downgrade jolted investors but did not trigger panic. Treasury yields jumped in early trading on Monday (May 19) and stocks dipped initially, reflecting routine market adjustments in response to updated credit assessments. “Very surprising…markets were not expecting this at all,” admitted one Wall Street trading head who was caught off guard by the downgrade. However, there was no mass exodus from US assets. Global investors continued to view Treasuries as a safe haven even with a lower rating. For institutional investors, the downgrade serves as a reminder to revisit sovereign risk frameworks. Portfolio managers may need to adjust asset allocations, hedge exposure to US Treasuries, or recalibrate models that rely on triple-A-rated government debt as a benchmark. While the market response was muted, the rating shift could subtly influence capital weightings and collateral requirements. Any rise in US borrowing costs was modest. Credit spreads on highly rated corporate and municipal bonds widened only slightly, signaling a minor repricing of risk rather than a loss of confidence. One notable move was gold’s surge above $3,200 per ounce — a flight-to-safety response. Meanwhile, the US dollar held firm, its reserve-currency status unshaken by a one-notch rating change. Global Spillovers and EM Vulnerabilities Moody’s downgrade of US sovereign debt carried symbolic weight far beyond American shores. Financial leaders from Frankfurt to Beijing watched closely, mindful that any shift in US credit conditions can send ripples through global markets. In this case, the ripples were subtle but significant. Global investors reassessed their portfolios over the weekend, balancing the slight uptick in US risk with conditions elsewhere. Emerging markets felt a chill. Some emerging economy bonds and currencies came under pressure as the news sparked a modest “risk-off” mood. When the world’s benchmark risk-free asset is perceived as marginally riskier, investors often become more cautious toward riskier sovereigns. Indeed, analysts noted a small widening of emerging market sovereign bond spreads on Monday, and a few developing-nation currencies slipped as money moved toward dollar assets. At the same time, higher US yields — even marginally higher — can attract capital flows out of emerging markets, raising their borrowing costs. For some emerging economies already navigating global financial tightening, the downgrade added a layer of complexity to their outlook. Some finance ministers from Asia and Africa voiced concern that their countries could face capital outflows or higher interest on new debt issuance if global investors demand a higher premium. The consensus among many economists, however, is that the overall impact on emerging markets likely will be contained. Liability-driven investors, insurance companies, and global fixed income managers may face ripple effects if credit rating changes affect capital reserve calculations or yield expectations. Even minor shifts in perceptions of US credit quality can cascade through models that prioritize safety and duration matching. Fiscal Credibility and the Investor Outlook Despite the political drama and Wall Street jitters, the prevailing view in policy circles is that the United States retains extraordinary financial resilience. Moody’s itself acknowledged that US creditworthiness rests on “exceptional credit strengths” — a diverse and productive economy, unrivaled monetary flexibility, and the government’s unblemished record of honoring debt through every crisis. The downgrade has not changed the fact that US Treasury bonds remain the world’s safe asset of choice, underpinning the dollar-based international financial system. No other nation can yet match the United States’ capacity to issue debt at such scale, in its own currency, at relatively low cost. The real question now is how US policymakers respond. The Moody’s downgrade is more than symbolic; it’s a warning to restore fiscal credibility. That means a medium-term plan to reduce deficits, stabilize debt-to-GDP, and improve policy predictability. As the IMF and others have noted, governance matters: recurring brinkmanship risks eroding investor confidence in Treasuries as the global benchmark. For long-term investors, a credible bipartisan approach — focused on spending discipline, targeted revenue, and durable policy frameworks — could reinforce the US Treasury market’s central role in global finance. In contrast, ongoing gridlock may lead to higher risk premiums or a shift toward sovereign diversification. Early signals are modest but encouraging. Lawmakers have revived talks on a fiscal commission, and the White House has shown openness to reform. For markets, what matters isn’t the downgrade — it’s the path forward. The world still depends on a financially sound America. Investors

The Downgrade Is Done. The Investor Response Is Just Beginning Read More »