CFA Institute

The Unspoken Conflict of Interest at the Heart of Investment Consulting

Mark J. Higgins, CFA, CFP, is the author of Investing in U.S. Financial History: Understanding the Past to Forecast the Future from Greenleaf Book Group Press. After World War II, the portfolios of US institutional investment plans began growing rapidly. As of 2021, the total assets held by US public and private pensions alone exceeded $30 trillion. Much like their predecessors in the mid-1900s, the trustees that oversee these assets have limited time and variable levels of expertise. This forces them to rely on the advice of staff and non-discretionary investment consultants. My purpose here is to reveal an especially pernicious bias of investment consultants. This revelation is important because it is often masked by the inaccurate claim that their advice is conflict-free.  The problem is that while investment consultants may claim their advice is conflict-free — and their clients may believe them — in reality, it is often heavily biased by the investment consultants’ own self-interest. The Origins of the Conflict The basic premise of the investment consulting profession’s “no conflicts of interest” claim is that their recommendations are unbiased because they have no financial interest in the funds that they recommend. Such a claim may have had been valid during the profession’s formative years in the 1970s and 1980s when investment consulting firms limited their services to performance reporting. But by the 1990s, competition had intensified to such an extent that most of these firms had added proprietary asset allocation and asset manager recommendations as a way to differentiate from competitors. Emboldened by their reputation as trusted advisers, they started to push actively managed funds in traditional asset classes even as evidence mounted that such investments were unlikely to add value. Making matters worse, they sought to emulate the success of the Yale Endowment at the turn of the 21st century and promoted the construction of increasingly complex portfolios with allocations to private investments in alternative asset classes. Despite the shift in their business models, consulting firms continued to provide performance reporting services, and their reports more and more came to resemble an evaluation of their own recommendations. Today, investment consulting firms still compete primarily on the depth of their resources in asset allocation, active manager selection, and alternative asset classes, among other areas. Many maintain that their recommendations are trustworthy because their business models remain “unconflicted.” The problem, however, is that this claim implicitly assumes that investing in complex portfolio allocations, active managers, and alternative asset classes will benefit clients in aggregate. What if the opposite is true? What if these strategies actually destroy value? Would investment consultants tell their clients? Just asking these questions presents an existential dilemma. If most clients are better off simplifying their portfolios, replacing active managers with low-cost index funds, and avoiding alternative asset classes, then the current investment consulting business model is obsolete. This is an understandably hard truth to accept, and investment consulting firms rarely discuss these issues for obvious reasons. The conflict of interest impairs their judgment. That’s why most firms continue to compete based on their (largely unfounded) asset allocation and manager selection capabilities. Trustees also have a difficult time challenging consultants’ claims. Why? Because investment consultants almost always choose the benchmarks against which plan performance — and, by extension, their performance — is evaluated. It is not in their interest to set the bar too high. In fact, Niklas Augustin, Matteo Binfarè, and Elyas Fermand found that private equity benchmarks have migrated toward lower and lower thresholds of outperformance. By any standard, this is a deeply conflicted practice, but the widely accepted claim that consultants are conflict-free makes it even more damaging. So, how does this conflict play out? One example occurs when investment consulting firms recommend actively managed funds yet bear almost no accountability for the outcomes. This may seem hard to believe but ask an investment consulting firm to provide a third-party assessment of their fund manager hire-and-fire recommendations. Few firms voluntarily provide this information because (a) they never thought to do the analysis; (b) they don’t want to do the analysis because of what it may reveal; or (c) they have done the analysis but won’t share it because of what it does reveal. None of these explanations inspire confidence. But investment consultants are rarely challenged because of their non-discretionary status. Since trustees are the final decision makers, consultants are unaccountable for proving whether their recommendations offer any value. Ironically, the “non-discretionary cloak of invisibility” protects consultants from providing the very transparency that prompted the profession’s formation in the first place. The late Charlie Munger once described a similar problem. Asked why irrational behavior was so common in the investment management profession, he told an anecdote about shopping for a fishing lure in Minnesota. He couldn’t fathom how the lure’s glittery, technicolor sheen would attract fish. So, he asked the store owner whether it actually worked. The owner confessed his ambivalence: “Mister, I don’t sell to fish.” Trustees of institutional investment plans find themselves in a similar position. They design complex allocations and purchase expensive alternative asset classes and actively managed funds despite mounting possibility that the corresponding fees are unlikely to produce attractive outcomes. So, What Is the Solution? Fortunately, a small but growing community of academics and investment professionals is asking the difficult questions and humbly accepting the answers. Over several decades, Charles D. Ellis, CFA, and Richard M. Ennis, CFA, among others, have followed the evidence and proposed a way forward. For trustees, the first step is to recognize that the firms they depend on for investment advice are anything but conflict-free. Once they acknowledge that, they can open their minds to the evidence that a less complex and less costly strategy may have benefits. For investment consultants, the first step is to let go of the obsession with portfolio complexity and the quixotic quest to outwit ruthlessly efficient markets. Those who accept this reality will discover that clients still need their services. In fact, by spending less time on

The Unspoken Conflict of Interest at the Heart of Investment Consulting Read More »

Climate Change Doesn’t Care What You Think About It

. Early in my investment career a senior colleague said to me, “Stocks don’t care what you think about them,” meaning that my opinion on a stock had no bearing on how it was going to behave. That was an extremely valuable insight because all too often individuals think that their opinions influence real-world outcomes, leading to very serious mistakes. Climate change is the same. What individuals think about it is not going to change the fact that we can observe, in real time, that climate change has real world consequences.  Let’s start with the influence of climate change on near-term weather. Scientists are debating whether the warming of the oceans and other phenomena are increasing the number and frequency of hurricanes, tornadoes, fires, and other natural disasters. We may or may not be able to tease out a scientific model that proves a connection with absolute certainty. Markets Don’t Care What You Think About Climate Change But the markets don’t care whether we can build a model or not, what we can observe is that there has been a building boom in Florida’s coastal areas, that hurricanes have caused hundreds of billions of dollars of damage, and that homeowner insurance is hard to get and much more expensive than the rest of the country. Florida homeowners face serious obstacles when it comes to homeowners insurance. Many insurers have reduced their presence in Florida through non-renewals and limited writing of new business. In addition, 16 companies have voluntarily withdrawn from the state, including AAA, Bankers Insurance, Centauri Insurance, and Lexington Insurance. A further 16 insurers have gone insolvent since 2017. Still, other companies like Liberty Mutual haven’t responded to quote requests for Florida ZIP codes, and Farmers Group has stopped writing new policies statewide. All this market volatility has left homeowners saddled with higher costs and a tough time finding the coverage they need. Proprietary data from Insurify reveals that Florida homeowners already pay an average annual insurance premium of $11,759 per year. This is the highest of any state, and rates are likely to rise even more next year.” Insurance Markets Don’t Care What You Think About Climate Change The insurance markets don’t care whether anyone thinks climate change is real or not, whether the Florida home insurance market is flawed, or whether it was bad planning to build on barrier islands. All it knows is that hurricanes have increased in frequency and power and that the losses sustained require much higher insurance rates. Or not quoting rates at all. The energy markets don’t care whether anyone really believes that wind turbines kill birds and whales, cause cancer, or any other unconventional ideas. All it knows is that the wind blows hard in Texas, a major oil producing state, and that wind turbines are very profitable.  The Texas Comptroller of Public Accounts notes that Texas is a 17-year leader in US wind energy production, accounting for more than a quarter of all US wind energy, more than 40 MW of production, and 25,000 jobs that pay more than $100,000 a year. Some 28% of all electricity in Texas is generated by wind, and its marginal cost is often the lowest in the state.  Climate change doesn’t care whether or not people prefer internal combustion cars over electric vehicles (EVs). What we observe is that EVs are now about 9% of the auto market (up from 5% in 2022) and that EVs and hybrids together are now about 30% of the auto market. As unit prices drop, batteries become cheaper, and charging infrastructure grows, the percentage of EVs will rise. The market doesn’t care if anyone objects to the rise of EVs or that  the trend can be marginally influenced by incentives. Objecting to horseless carriages as devil wagons[4] did not work. Just like early EVs, the first autos were curiosities owned by wealthy eccentrics. It took a while for them to become ubiquitous, but the trend was irreversible because they were cheaper, better, and faster than horse-drawn carriages. What is the lesson in all this? That the markets, the real world, and the economy do not care if anyone believes in climate change or not. There are direct consequences of climate change, many of which we aren’t yet able to observe, but the real-world is already adapting and changing because of the immediate consequences of climate change.  Climate activists can stop worrying about people who don’t believe in climate change. They can stop worrying because climate change doesn’t care what anyone thinks. You May Also Like: Navigating Net-Zero Investing Benchmarks, Incentives, and Time Horizons source

Climate Change Doesn’t Care What You Think About It Read More »

Frankenstein’s Index Fund

Arthur Frankenstein did not set out to create a monster. He had the best scientific intentions. He hoped to create a living being from, well, body parts. As Mary Shelley’s story plays out, we learn that Frankenstein’s experiment ended badly. A much less grisly experiment began in 1911 in Massachusetts. That’s where the first statewide pension fund in the United States came into being. It proved to be a much more successful experiment but not without its own unforeseen consequences. Today, all 50 states maintain at least one statewide pension plan. All but five have multiple statewide plans. And then there are all the city and county plans. Jurisdictions with multiple pension plans are the subject of this post. Diversification is a cardinal principle of prudent pension fund management. The principle is written into fiduciary law everywhere. Public plan trustees have been scrupulous in their efforts to diversify investments. They invariably establish an asset allocation plan for diversifying among asset classes. They hire multiple investment managers. They use index funds. Their returns hew to broad market indexes. For example, my studies indicate that, on average, large public fund returns have an R2 of 98% with those of the market. Public pension funds are diversified to the nth degree. Diversification Gone Haywire Here is where things begin to get sticky. Large public funds use an average of more than 150 asset managers.[1] A precept of efficient portfolio management is that the investor does not use active managers for diversification, which can be carried out much more cheaply with index funds. Hiring scads of managers is costly. I estimate that public pension funds, with their 35% average allocation to pricey alternative investments and 20% or less in index funds, incur investment expenses of 100 to 150 bps per year. And they underperform market indexes by a like amount. Trustees are getting their diversification, yes — but with woeful inefficiency.[2] The Monster We Built Things get worse when there are multiple pension funds in a single jurisdiction. This results in redundancy amounting to de facto consolidation of all the individual funds, for that is its bottom-line impact on taxpayers. Consider a taxpayer in Los Angeles. Their taxation is influenced by the performance of three city pension funds, one county fund, and three statewide funds. The consolidated fund incorporates more than 1000 actively managed portfolios with countless individual positions. One portfolio’s losers offset another’s winners; investment bets by the hundreds cancel one another out. The result is an unholy index fund, patched together without intention and giving rise to a monster of inefficient diversification. There are $5 trillion of public defined benefit assets in the United States. I estimate public plans waste $50 billion a year through inefficient diversification. The waste adds to the already enormous burden of funding public pension plans, which ultimately falls upon the taxpayers. What is the solution? A few states, such as Minnesota, have a state board of investment. Although Minnesota has several statewide pension plans, their assets are pooled for the purpose of investment. This is a step in the right direction. But, as noted, individual pension funds tend to be inefficiently diversified, so there is no assurance that simply pooling plan assets will achieve the desired result. And state boards of investment typically leave out local funds. A surer alternative is to index public pension assets in fact. Jumbo-size, government-run pension funds operating in a political goldfish bowl lack comparative advantages as investors. Passive investing at next to no cost transforms the game into one in which public funds can be consistent winners. Key Takeaways Public pension plans may use index funds or seem to follow market benchmarks, but in reality, they: Still employ hundreds of active managers Take on expensive alternative investments End up with aggregate portfolios that mirror the market but at much higher cost [1] See Aubry, J-P and K. Wandrei. 2020. “Internal vs. External Management for State and Local Pension Plans.” Center for Retirement Research, Boston College. [2] See Ennis, R.M. 2025. “The Demise of Alternative Investments.” The Journal of Portfolio Management (forthcoming). https://papers.ssrn.com/sol3/papers.cfm?abstract_id=5163511. source

Frankenstein’s Index Fund Read More »

Can Equal Weight Solve Our Concentration Crisis? Not So Fast…

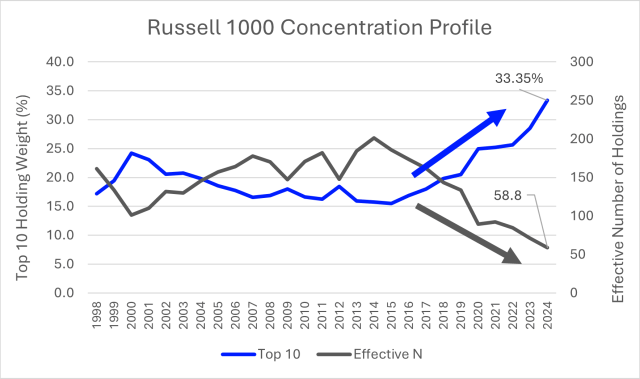
The US stock market has never before been this top heavy, and no easy solution, or indeed any solution, appears to be within the grasp of investors. The peak of the dot.com bubble seems quaint by comparison to the present market structure, with the top 10 weight currently standing at a resounding 33.35% of market capitalization. The diversification dilemma is real.  My goal in this blog post is three-fold. First and foremost, I will diagnose the illness pervading the US stock market. Second, I will examine why equal weighting — the back-up index strategy of choice — distorts a portfolio with far-from-equal exposures. Third, I will explain why a factor application can naturally distribute portfolio weights for ideal diversification. The factor portfolio has greater breadth than a market-capitalization portfolio, without the practical and performance liabilities of equal weighting.  Big Money, Bigger Problems Mega-cap concentration has exploded, increasing by 115% from a 25-year low in 2015, when top 10 holdings accounted for 15.52% of total index weight. Having first surpassed the historic dot.com bubble concentration levels in 2020, concentration now stands at a 38% premium to such excesses. US stocks have long since crossed the concentration Rubicon. The corollary to an increasingly top-heavy benchmark is that market diversification and breadth have never been more limited. This issue can be conceptualized by looking at the effective number of stocks provided by an index — the size of an equally weighted basket that provides equivalent diversification.  Exhibit 1. The startling conclusion is that, despite the Russell 1000 nominally providing exposure to its namesake number of stocks, the index affords an effective diversification of only 59 stocks. This figure represents a historic low and a decrease to only 29.2% of the effective number of holdings (N) of 202 stocks achieved in 2014. Not only does market-cap weighting induce substantial single-stock risk, but the diversification provided by this foundational asset class has evaporated by 70% over the past decade. Hence, the concentration crisis.   Equal Weight to the Rescue? Unlikely… If weighting by market cap is pushing portfolios to their breaking point, surely weighting companies equally can achieve the diversification for which investors are clamoring? For all the same reasons the market is so concentrated, the equal-weight methodology produces quite radical portfolio constructions, with outcomes perhaps even less desirable than the concentration itself. This is a classic case of the cure being worse than the disease. Exhibit 2. Notes: Relative returns of the Russell 1000 Equal-Weight Index and the Russell 1000 Comprehensive Factor Index to the Russell 1000 Index. Bottom window depicts the change in 10-Top index weight of the Russell 1000 from its minimum in 2015. Source: FTSE Russell Data, June 2024. This is not your grandfather’s equal-weight market. What is often perceived as a simple alternative is no longer a substitute benchmark, but instead an aggressive active strategy. Specifically, equal weight suffers from significant operational costs, underperformance, questionable assumptions, and skewed risk bets. As market-cap and equal-weight portfolios have diverged in structure, tracking error has soared to 8.05% on an annualized basis. This is the highest tracking error on record outside periods of market stress, even though volatility is only at the 21st percentile measured on a 20-year range. To illustrate just how extreme this tracking error is, the 60 largest active mutual funds in the US average 5.50% annualized tracking error. Yes, that’s correct, equal weight is far more active than the leading active funds owing to its onerous reallocation schema. As a card-carrying active strategy, equal weight exhibits the familiar encumbrances of high turnover and tepid performance. The need to countermand all share-price movements at each rebalance means that the Russell 1000 Equal Weight Index has averaged 71.0% two-way turnover since 2000. Moreover, this turnover is historically inconsistent ranging from a low of 44% in 2012 to a high of 132% at the height of the dot.com bubble. This imprecision is a resonating theme of equal weighting. Exhibit 3. Notes:  Decomposition of benchmark, equal-weight and multifactor returns around June 30 2014, the peak of equal weight returns. Source: FTSE Russell Data, June 2024. Yet, it is the performance drag that most indicts the equal-weight framework. When returns have been so inequitably distributed, owning companies in equal measure has been a perilous approach. The mega caps did not achieve stratospheric concentration by performing poorly.  Indeed, equal performance was maximized when the degree of market concentration was minimized. The halcyon days for equal weighting were a decade ago, the absolute peak notched on June 30, 2014. Since then, the strategy has underperformed relentlessly in nearly every market condition.  Exhibit 3 illustrates this stark bifurcation in performance juxtaposed against changes in top 10 index concentration. Whereas equal weight outperformed by 405 basis points (bps) annualized from 2005 to mid-2014, it underperformed by nearly identical measure (408 bps) over the subsequent 10 years. In fact, for every one-point increase to top 10 index concentration from 2015 levels, the Russell 1000 Equal Weight Index lost 2.17 points of relative performance to its market-weighted counterpart. Betting on Knowing Nothing Why does this schism in equal-weighted returns emerge starting in 2014? While cap weighting assumes markets are efficient, with asset prices accurately reflecting all information, equal weighting takes the opposite approach. It assumes we cannot know anything about the market.  When concentration rests at manageable levels, this “know nothing” assumption still looms large, but equal weighting is implementable, nonetheless. On the other hand, as the market cap of the largest companies expands to 7,658 times the average size of the smallest 10 stocks in the Russell 1000, equally weighting these companies has long since passed credulity. This size spread between largest and smallest companies is not only emblematic of the concentration dilemma, but indicative of why equal weighting fails in this market regime. In 2005, this size gap was a 224-fold multiple, increasing nine times to a 2,018 multiple by 2015, before expanding a further 3.8 times to present levels. This scale factor increase of 34 times means

Can Equal Weight Solve Our Concentration Crisis? Not So Fast… Read More »

How Can Family Offices Leverage Artificial Intelligence? Four Applications

For more on artificial intelligence (AI) in investment management, check out The Handbook of Artificial Intelligence and Big Data Applications in Investments, by Larry Cao, CFA, from the CFA Institute Research Foundation. Artificial intelligence (AI) has created substantial buzz and substantial fear in the business world and popular culture alike. Everyone has heard of ChatGPT and other generative AI platforms, and more and more people are using them in both their personal and professional lives. The investment world is no different, and financial professionals are searching for ways to both implement generative AI and protect themselves from it. While AI is a useful tool that can create powerful and positive outcomes, it also involves substantial risks. That’s why family offices need to understand its strengths and limitations and work to responsibly integrate AI into their practices while being mindful of the potential threats. How AI Can Help Serve Clients AI can generate investment recommendations, analyze scenarios, run simulations, and monitor various investment factors. Companies deploy AI for risk analyses, supply chain management, accounting exercises, and financial planning, among other purposes. By incorporating AI into their tech stacks, family offices can increase productivity and cut costs. After all, an adviser’s time may be better spent building client relationships, increasing innovation, and expanding market share rather than, say, data modeling. This improves efficiency without necessarily rendering human staff obsolete. By leveraging AI, family offices can reallocate their human capital to where it brings the most value. AI-Inspired Personalization AI’s chief value proposition for family offices is through investment software. By processing massive datasets, AI can help identify potentially alpha-generating trends and patterns. Augmented by human judgment and restrained by clear boundaries, AI can help fine-tune the investment process and deliver individually tailored client solutions. How Can Family Offices Best Leverage AI? Family offices can deploy AI wealth management models trained on historical financial data, market trends, and other relevant factors and apply them to the following tasks: 1. Investment Analysis AI-generated investment scenarios and simulations can help guide and inform family office investment strategies by providing insights into the potential risks and returns. Just as financial planners run through sequence-of-return-risk scenarios, family offices generate alternative investment scenarios and performance simulations based on massive datasets. By bringing AI to bear, they can make more sophisticated and data-driven decisions. 2. Portfolio Allocation Optimization AI can simulate different allocation strategies; account for risk preferences, return objectives, and constraints; and suggest optimal portfolio compositions that align with investment goals. As such, AI-driven investment analysis gives family offices the means to test assumptions and run through contingency plans. 3. Risk Management Risk management in family offices has always been challenging. But AI is helping to address this. By monitoring market data, macroeconomic indicators, and other relevant factors, AI can help flag risk scenarios. Enabled by AI, family offices can sandbox test catastrophic events against their datasets and model the magnitude of their risk. But AI’s value add goes beyond diagnosis; it provides a toolbox with which to monitor potential threats and respond at strategic times. 4. Alternative Data Analysis By using AI to process and analyze alternative data sources, such as social media feeds, news articles, and online sentiment, family offices can now identify emerging trends and investment opportunities, gaining insights that traditional analysis has overlooked in the past. There is massive potential to explore qualitative data and add nuance to datasets that previously were out of reach or too costly to analyze. Intentional — But Cautious — Adoption of AI AI will continue to grow in importance and capability. With that in mind, firms are right to explore the advantages that AI offers as well as its potential excesses and downsides. Executive teams need to devote resources to understanding how AI can strengthen or threaten the business and assign team members to monitor and explore these programs and their impacts on the organization. While AI’s strengths are many and obvious, AI applications are only just beginning to be deployed, and as with any new and largely untested technology, there is reason to be cautious. Indeed, family offices navigate highly regulated fields and often have sensitive intellectual property considerations to keep in mind. Each office will have to decide the boundaries to set around AI implementation. The risks are real: Samsung software engineers uploaded sensitive source code to ChatGPT servers. A lawyer who relied on ChatGPT received completely fabricated case law that exposed them to sanctions and ethics violations. Given these risks, family offices need to build in redundancies and quality controls to ensure their intellectual property is safe and the information they provide clients is accurate. AI will revolutionize family office operations. That’s why each office must be intentional about its AI adoption formula, governance procedures, and long-term AI roadmap. The tools are out there — it’s up to family office innovators to determine how best to deploy them. If you liked this post, don’t forget to subscribe to Enterprising Investor. All posts are the opinion of the author. As such, they should not be construed as investment advice, nor do the opinions expressed necessarily reflect the views of CFA Institute or the author’s employer. Image credit: ©Getty Images/dan Professional Learning for CFA Institute Members CFA Institute members are empowered to self-determine and self-report professional learning (PL) credits earned, including content on Enterprising Investor. Members can record credits easily using their online PL tracker. source

How Can Family Offices Leverage Artificial Intelligence? Four Applications Read More »

Private Capital: Lessons from the Conglomerate Era

Global private capital firms are charting a well-traveled course. With their sprawling empires, the largest alternative asset managers have adopted strategies that borrow extensively from the octopus-like corporate conglomerate business model. The Age of Private Market Empires Many private equity (PE) firms are building product lines that are adjacent if not necessarily complementary to their traditional buyout activities. These product lines all sit under one common umbrella: capital solutions. That is why the moniker “financial conglomerate” now applies. By aggregating multiple and sometimes loosely related businesses, these modern conglomerates achieve two main purposes: They consolidate market power and diversify away economic risks. Infrastructure, credit, life insurance, real estate, and venture capital have as much in common today as the General Electric (GE) domestic appliances line had with its aircraft engine production unit, or the General Motors (GM) former subsidiary Frigidaire had with its main automobile manufacturing business. For today’s financial conglomerates, as with their corporate predecessors in the last century, asset accumulation and revenue maximization have taken priority over strategic coherence. Fifty years ago, buyout pioneers believed corporate conglomerates were overly complex and that corporate carve-outs could create greater value. Yet today, in a bid to shed their reputation as financial engineers, PE fund managers are acting more like industrial owners, holding onto portfolio assets for a decade or longer rather than the conventional three to five years. They also play a more active role in portfolio management — with operating partners, sector experts, and when needed, turnaround specialists — than they did when they first emerged in the 1970s. Back then, they behaved more like holding companies: They were neither operationally nor strategically involved in the day-to-day running of investee companies. Though established to improve corporate governance and strategic focus, private capital firms now emulate old corporate conglomerates. But if this is the case, it is worth examining why the practice of vertical and horizontal integration so often led to failure in the past. What went wrong with the corporate conglomerate business model? The Conglomerate Discount Conglomeration is a good way to maintain control over family businesses, as Reliance, Mahindra, and Tata, among other firms, have demonstrated in India, and can also help governments set industrial policies in strategic sectors, as with some keiretsu in Japan, chaebols in South Korea, and jituan in China, as well as in much of Europe. But conglomerates have rarely maximized long-term shareholder value. Too often, whatever synergies they manage to create fail to compensate for the costs associated with the increased complexity. Such conglomerates seek out scope as well as scale, even when they lack expertise in the targeted sectors. In Europe, for example, the now-disbanded Hanson Trust group spanned retail fashion, typewriters, chemicals, gold mining, toys, tobacco, and beyond. The temptation to devise economies of scope is hard to resist, even when it stretches a conglomerate’s capabilities. Five years ago, the world’s largest telecom operator, AT&T, acquired the WarnerMedia entertainment group, for example, only to unwind the deal three years later. Like other industrial concerns, GE operated under the principle that centralized strategic planning and capital allocation was the most efficient way to run separate business units. Yet, during the global financial crisis (GFC), its GE Capital financial division faltered and starved the whole enterprise of cash. This helped force the sell-off of its mass media unit NBCUniversal. Giant corporate conglomerates often hire strategy consultants to help address the challenges posed by their size. Various management fads in the 1980s made way for operational solutions and systems implementation in the 1990s. Under CEO Jack Welch, for example, GE adopted Six Sigma process-improvement methods. But these practices ended up mostly overengineering management structures. In PE, financial engineering tends to drive investment performance. So, the corporate fixers in financial conglomerates are not management consultants but leveraged finance and turnaround experts, especially in distressed scenarios. Eventually, the corporate conglomerate came to suffer from a fundamental weakness: The whole was worth less than the sum of its parts, and unrelated divisions were “worth less than if they were stand-alone units,” as Michael E. Porter writes. The combination of business and market risks led public investors to assess most conglomerates at a discount relative to their breakup value. Risk Diversification and Return Dispersion Demergers became the most efficient way to extract the true value of the underlying assets and demonstrated that individual corporations did have an optimal structure. Therefore, the main challenge for modern-day private capital firms is achieving both horizontal cohesion and vertical integration. Many corporate conglomerates started out by building a dominant competitive position in one or a handful of businesses. Once the strong core was established, they expanded vertically and horizontally. The strategy became so popular that, by 1970, 20% of Fortune 500 companies were conglomerates. Private capital firms emulated this pattern, first refining their expertise in one or two asset classes — frequently leveraged buyouts, infrastructure, or real estate — before branching out into credit, venture capital, insurance, distress investing, and even natural resources. The rationale behind the emergence of private capital supermarkets is simple: They offer the convenience of one-stop shopping to investors that lack the wherewithal to execute a diversification strategy. Alleviating performance cyclicality is the obvious benefit of this approach. Diversification across a broad range of uncorrelated asset classes mechanically reduces volatility, as when infrastructure is paired with growth capital or when the steady income flows of the insurance business are counterbalanced by the unpredictable earnings of early-stage financing. Yet, conglomeration is not an efficient way to reduce investment risk. There is a fine line between diversification and dispersion. After all, investors can likely gain better diversification at lower costs across the entire spectrum of asset classes through an index tracker than by investing in the few assets identified and acquired by a financial or industrial conglomerate’s management team. Sponsors Benefit More Than Investors “The overriding drive among fund managers is for asset size, seemingly above all else, simply because piling assets on assets results in fees piled on

Private Capital: Lessons from the Conglomerate Era Read More »

Navigating Troubled Waters: What the Surge in Bankruptcy Filings Means for the Economy

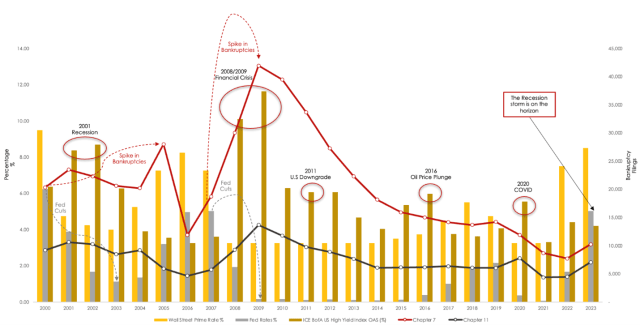
The financial landscape is showing signs of strain as bankruptcy filings surge, with businesses and consumers alike feeling the pressure of shifting economic conditions. Despite Federal Reserve rate cuts aimed at stabilizing the market, historical patterns suggest that monetary policy alone may not be enough to stem the tide. As cracks in the system become more apparent, understanding the drivers of the rise in bankruptcies is crucial for navigating the challenges ahead. Statistics reported by the Administrative Office of the US Courts show a 16% surge in bankruptcy filings in the 12 months before June 30, 2024, with 486,613 new cases, up from 418,724 the previous year. Business filings saw an even sharper increase, rising by 40.3%. These figures indicate growing financial stress within the US economy, but the real storm may be just around the corner. During the 2001 recession, the Federal Reserve’s aggressive rate cuts failed to prevent a sharp increase in corporate bankruptcies. Despite lower interest rates, the Option-Adjusted Spread (OAS) for high-yield bonds widened significantly, reflecting heightened risk aversion among investors, and increasing default risks for lower-rated companies.  Trend Analysis: Fed Rates and OAS Spread Compared to Bankruptcy Filings Image Source: Fred Economic Data, St Louis: The American Bankruptcy Institute and Author Analysis The Disconnect Between Monetary Easing and Market Conditions As a result, the period saw a sharp spike in corporate bankruptcies as many businesses struggled to manage their debt burdens amid tightening credit conditions and deteriorating economic fundamentals. This disconnect between monetary easing and market realities ultimately led to a surge in bankruptcies as businesses struggled with tightening credit conditions. A similar pattern emerged during the 2008 global financial crisis. For 218 days, the ICE BoFA US High Yield OAS Spread remained above 1000 basis points (bps), which signaled extreme market stress. This prolonged period of elevated spreads led to a significant increase in Chapter 7 liquidations as companies facing refinancing difficulties opted to liquidate their assets rather than restructure. ICE BoFA US High Yield OAS Spread Image Source: Fed Economic Data, St Louis and Author Analysis The sustained period of elevated OAS spreads in 2008 serves as a stark reminder of the crisis’s intensity and its profound impact on the economy, particularly on companies teetering on the edge of insolvency. The connection between the distressed debt environment, as indicated by the OAS and the wave of Chapter 7 liquidations, paints a grim picture of the financial landscape during one of the most challenging periods in modern economic history. The Federal Reserve’s interest rate policies have frequently lagged the Taylor Rule’s recommendations. The Taylor Rule is a widely referenced guideline for setting rates based on economic conditions. Formulated by economist John Taylor, the rule suggests that interest rates should rise when inflation is above target, or the economy is operating above its potential. Conversely, interest rates should fall when inflation is below target or the economy is operating below its potential. The Lag The Fed’s rate adjustments lag for several reasons.  First, the Fed often adopts a cautious approach, preferring to wait for clear evidence of economic trends before making rate adjustments. This cautiousness can lead to delayed responses, particularly when inflation begins to rise, or economic conditions start to diverge from their potential. Second, the Fed’s dual mandate of promoting maximum employment and stable prices sometimes leads to decisions that diverge from the Taylor Rule. For example, the Fed might prioritize supporting employment during economic slowdowns, even when the Taylor Rule suggests higher rates to combat rising inflation. This was evident during prolonged periods of low interest rates in the aftermath of the 2008 financial crisis. The Fed kept rates lower for longer than the Taylor Rule suggests to stimulate economic growth and reduce unemployment. In addition, the Fed’s focus on financial market stability and the global economy can influence its rate decisions, sometimes causing it to maintain lower rates than the Taylor Rule prescribes. The rule’s goal is to avoid potential disruptions in financial markets or to mitigate global economic risks. Historical Fed Funds Rate Prescriptions from Simple Policy Rules Image Source: Federal Reserve Board and Author Analysis The consequence of this lag is that the Fed’s rate cuts or increases may arrive too late to prevent inflationary pressures or curb an overheating economy, as they did in the lead-up to previous recessions. Cautious timing for rate cuts may also delay needed economic stimulus, which prolongs economic downturns. As the economy faces new challenges, this lag between the Fed’s actions and the Taylor Rule’s recommendations continues to raise concerns. Critics argue that a more-timely alignment with the Taylor Rule could lead to more effective monetary policy and reduce the risk of inflation or recession, ensuring a more stable economic environment. Balancing the strict guidelines of the Taylor Rule with the complexities of the real economy remains a significant challenge for policymakers. As we approach Q4 2024, the economic landscape bears unsettling similarities to past recessions, particularly those of 2001 and 2008. With signs of a slowing economy, the Federal Reserve has cut the interest rate by 0.5% recently to prevent a deeper downturn. However, historical patterns suggest this strategy may not be enough to avert a broader financial storm. Furthermore, easing monetary policy, which typically involves lowering interest rates, will likely shift investor behavior. As yields on US Treasuries decline, investors may seek higher returns in high-yield sovereign debt from other countries. This shift could result in significant capital outflows from US Treasuries and into alternative markets, putting downward pressure on the US dollar. The current global environment, including the growing influence of the BRICS bloc, the expiration of Saudi Arabia’s petrodollar agreements, and ongoing regional conflicts, make the US economic outlook complex. The BRICS nations (Brazil, Russia, India, China, and South Africa) have been pushing to reduce reliance on the US dollar in global trade, and petrodollar petrodollar contracts are weakening. These trends could accelerate the dollar’s depreciation. As demand for US Treasuries declines, the US dollar could face significant pressure, leading to depreciation. A weaker dollar,

Navigating Troubled Waters: What the Surge in Bankruptcy Filings Means for the Economy Read More »

Equity and Bond Correlations: Higher Than Assumed?

Introduction Investing can seem like an endless cycle of booms and busts. The markets and instruments may change — tulips in 1634, tech stocks in 2000, cryptocurrencies in 2021 — but the speculator’s drive to make fast money remains constant. Yet once investors have lived through a bubble or two, we tend to become more conservative and cautious. The ups and downs, the peaks and crashes, combined with the trial-and-error process, help lay the foundation for our core investment strategy, even if it’s just the traditional 60-40 portfolio. With memories of past losses, battle-worn investors are skeptical about new investing trends. But sometimes we shouldn’t be. Once in a while, new information comes along that turns conventional wisdom on its head and requires us to revise our established investing framework. For example, most investors assume that higher risk is rewarded by higher returns. But ample academic research on the low volatility factor indicates that the opposite is true. Low-risk stocks outperform high-risk ones, at least on a risk-adjusted basis. Similarly, the correlations between long-short factors — like momentum and the S&P 500 in 2022 — dramatically change depending on whether they are calculated with monthly or daily return data. Does this mean we need to reevaluate all the investing research based on daily returns and test that the findings still hold true with monthly returns? To answer this question, we analyzed the S&P 500’s correlations with other markets on both a daily and monthly return basis. Daily Return Correlations First, we calculated the rolling three-year correlations between the S&P 500 and three foreign stock and three US bond markets based on daily returns. The correlations among European, Japanese, and emerging market equities as well as US high-yield bonds have increased consistently since 1989. Why? The globalization process of the last 30 years has no doubt played a role as the world economy grew has more integrated. In contrast, US Treasury and corporate bond correlations with the S&P 500 varied over time: They were modestly positive between 1989 and 2000 but went negative thereafter. This trend, combined with positive returns from declining yields, made bonds great diversifiers for equity portfolios over the last two decades. Three-Year Rolling Correlations to the S&P 500: Daily Returns Source: Finominal Monthly Return Correlations What happens when the correlations are calculated with monthly rather than daily return data? Their range widens. By a lot. Japanese equities diverged from their US peers in the 1990s following the collapse of the Japanese stock and real estate bubbles. Emerging market stocks were less popular with US investors during the tech bubble in 2000, while US Treasuries and corporate bonds performed well when tech stocks turned bearish thereafter. In contrast, US corporate bonds did worse than US Treasuries during the global financial crisis (GFC) in 2008, when T-bills were one of the few safe havens. Overall, the monthly return chart seems to more accurately reflect the history of global financial markets since 1989 than its daily return counterpart. Three-Year Rolling Correlations to the S&P 500: Monthly Returns Source: Finominal Daily vs. Monthly Returns According to monthly return data, the average S&P 500 correlations to the six stock and bond markets grew over the 1989 to 2022 period. Now, diversification is the primary objective of allocations to international stocks or to certain types of bonds. But the related benefits are hard to achieve when average S&P 500 correlations are over 0.8 for both European equities and US high-yield bonds. Average Three-Year Rolling Correlations to the S&P 500, 1989 to 2022 Finally, by calculating the minimum and maximum correlations over the last 30 years with monthly returns, we find all six foreign stock and bond markets almost perfectly correlated to the S&P 500 at certain points and therefore would have provided the same risk exposure. But might such extreme correlations have only occurred during the few serious stock markets crashes? The answer is no. US high yields had an average correlation of 0.8 to the S&P 500 since 1989. But except for the 2002 to 2004 era, when it was near zero, the correlation actually was closer to 1 for the rest of the sample period. Maximum and Minimum Correlations to the S&P 500: Three-Year Monthly Rolling Returns, 1989 to 2022 Source: Finominal Further Thoughts Financial research seeks to build true and accurate knowledge about how financial markets work. But this analysis shows that changing something as simple as the lookback frequency yields vastly conflicting perspectives. An allocation to US high-yield bonds can diversify a US equities portfolio based on daily return correlations. But monthly return data shows a much higher average correlation. So, what correlation should we trust, daily or monthly? This question may not have one correct answer. Daily data is noisy, while monthly data has far fewer data points and is thus statistically less relevant. Given the complexity of financial markets as well as the asset management industry’s marketing efforts, which frequently trumpet equity beta in disguise as “uncorrelated returns,” investors should maintain our perennial skepticism. That means we’re probably best sticking with whatever data advises the most caution. After all, it’s better to be safe than sorry. For more insights from Nicolas Rabener and the Finominal team, sign up for their research reports. If you liked this post, don’t forget to subscribe to Enterprising Investor. All posts are the opinion of the author. As such, they should not be construed as investment advice, nor do the opinions expressed necessarily reflect the views of CFA Institute or the author’s employer. Image credit: ©Getty Images / BanksPhotos Professional Learning for CFA Institute Members CFA Institute members are empowered to self-determine and self-report professional learning (PL) credits earned, including content on Enterprising Investor. Members can record credits easily using their online PL tracker. source

Equity and Bond Correlations: Higher Than Assumed? Read More »

Are Your Data Governance and Management Practices Keeping Pace with the AI Boom?

As financial services firms scramble to keep pace with technological advancements like machine learning and artificial intelligence (AI), data governance (DG) and data management (DM) are playing an increasingly important role — a role that is often downplayed in what has become a technology arms race. DG and DM are core components of a successful enterprise data and analytics platform. They must fit within an organization’s investment philosophy and structure. Embracing business domain knowledge, experience, and expertise empowers the firm to incorporate management of BD alongside traditional small data. No doubt, the deployment of advanced technologies will drive greater efficiencies and secure competitive advantages through greater productivity, cost savings, and differentiated strategies and products. But no matter how sophisticated and expensive a firm’s AI tools are, it should not forget that the principle “garbage in, garbage out” (GIGO) applies to the entire investment management process. Flawed and poor-quality input data is destined to produce faulty, useless outputs. AI models must be trained, validated, and tested with high-quality data that is extracted and purposed for training, validating, and testing. Getting the data right often sounds less interesting or even boring for most investment professionals. Besides, practitioners typically do not think that their job description includes DG and DM. But there is a growing recognition among industry leaders that cross-functional, T-Shaped Teams will help organizations develop investment processes that incorporate AI and big data (BD). Yet, despite increased collaboration between the investment and technology functions, the critical inputs of DG and DM are often not sufficiently robust.   The Data Science Venn Diagram BD is the primary input of AI models. Data Science is an inter-disciplinary field comprising overlaps among math and statistics, computer science, domain knowledge, and expertise. As I wrote in a previous blog post, human teams that successfully adapt to the evolving landscape will persevere. Those that don’t are likely to render themselves obsolete. Exhibit 1 illustrates the overlapping functions. Looking at the Venn Diagram through the lens of job functions within an investment management firm: AI professionals cover math and statistics; technology professionals tackle computer science; and investment professionals bring a depth of knowledge, experience, and expertise to the team — with the help of data professionals. Exhibit 1. Table 1 deals solely with BD features. Clearly, professionals with skills in one area cannot be expected to deal with this level of complexity. Table 1. BD and Five Vs Volume, veracity, and value are challenging due to nagging uncertainty about completeness and accuracy of data, as well as the validity of garnered insights. To unleash the potential of BD and AI, investment professionals must understand how these concepts operate together in practice. Only then can BD and AI drive efficiency, productivity, and competitive advantage. Enter DG and DM. They are critical for managing data protection and secured data privacy, which are areas of significant regulatory focus. That includes post global financial crisis regulatory reform, such as the Basel Committee on Banking Supervision’s standard 239(BCBS239) and the European Union’s Solvency II Directive. More recent regulatory actions include the European Central Bank’s Data Quality Dashboard, the California Consumer Privacy Act, and the EU’s General Data Protection Regulation (GDPR), which compels the industry to better manage the privacy of individuals’ personal data. Future regulations are likely to give individuals increased ownership of their data. Firms should be working to define digital data rights and standards, particularly in how they will protect individual privacy. Data incorporates both the raw, unprocessed inputs as well as the resulting “content.” Content is the result of analysis — often on dashboards that enable story-telling. DG models can be built based on this foundation and DG practices will not necessarily be the same across every organization. Notably, DG frameworks have yet to address how to handle BD and AI models, which exist only ephemerally and change frequently. What Are the Key Components of Data Governance? Alignment and Commitment: Alignment on data strategy across the enterprise, and management commitment to it is critical. Guidance from a multi-stakeholder committee within an organization is desired.From an internal control and governance perspective, a minimum level of transparency, explainability, interpretability, auditability, traceability, and repeatability need to be ensured for a committee to be able to analyze the data, as well as the models used, and approve deployment. This function should be separate from the well-documented data research and model development process. Security: Data security is the practice of defining, labeling, and approving data by their levels of risk and reward, and then granting secure access rights to appropriate parties concerned. In other words, putting security measures in place and protecting data from unauthorized access and data corruption. Keeping a balance between user accessibility and security is key. Transparency: Every policy and procedure a firm adopts must be transparent and auditable. Transparency means enabling data analysts, portfolio managers, and other stakeholders to understand the source of the data and how it is processed, stored, consumed, archived, and deleted. Compliance: Ensuring that controls are in place to comply with corporate policies and procedures as well as regulatory and legislative requirements is not enough. Ongoing monitoring is necessary. Policies should include identifying attributes of sensitive information, protecting privacy via anonymization and tokenization of data where possible, and fulfilling requirements of information retention. Stewardship: An assigned team of data stewards should be established to monitor and control how business users tap into data. Leading by example, these stewards will ensure data quality, security, transparency, and compliance. What Are the Key Elements of Data Management? Preparation: This is the process of cleaning and transforming raw data to allow for data completeness and accuracy. This critical first step sometimes gets missed in the rush for analysis and reporting, and organizations find themselves making garbage decisions with garbage data. Creating a data model that is “built to evolve constantly” is far much better than creating a data model that is “built to last long as it is.” The data model should meet today’s needs and adapt to future change.

Are Your Data Governance and Management Practices Keeping Pace with the AI Boom? Read More »

The Alternative Investment Gender Gap: Marketing to Female Clients

Why do men allocate twice as much of their assets to alternative investments as women do? That’s one of the questions I asked 52 successful investors around the world for my “Women & Alts: A Global Perspective” white paper, which was released today. Some of the answers may surprise you. In this blog post, I identify women’s favorite alternative investments, the marketing strategies that do not resonate with women, and those that do.   I share insights from some of the 26 women and 26 men I interviewed in the global finance industry across 31 cities and 25 countries this summer. I asked each of them about their approaches to investing, and we discussed the current holdings in their portfolios. Why does the gender gap demand attention? Because alternative investments are important for any investor’s portfolio. Big money institutional investors have known this for years and male retail investors seem to be moving this way. Female retail investors, however, have been lagging. Global alternative assets under management will increase to US$24.5 trillion by 2028, up from an estimated US$16.3 trillion in 2023, Preqin’s Future of Alternatives 2028 report predicts. The defining characteristic of alternative assets is their relative lack of correlation with standard asset classes such as traditional equities and bonds. Adding alts to a portfolio improves overall diversification, reduces risk, and should lead to higher long-term returns. Nobody agrees on the definition of alternative investments, there are many kinds of alts, and the categories are expanding over time. Through my research this summer, I identified the top 10 alternative assets that resonate with women and list them, in no particular order. Women’s Top 10 Private equity Art Private credit/debt Gold Non-primary residence real estate Startups Angel investments Wine Collectables Infrastructure assets Do women want alts? The answer is a resounding Yes. Women need and deserve equal access to the world’s fastest-growing asset class. I deliberately selected male and female interviewees with diverse backgrounds and from a wide variety of senior roles: academics, corporate directors, founders, senior executives, institutional salespeople, traders, portfolio managers, economists, professional investors, and management consultants. This research was commissioned by Kensington Capital Partners and follows my 2024 Rich Thinking® research paper, “What’s in your investment portfolio?” I summarize the key findings from that research in my March Enterprising Investor blog post. Marketing to Women: What’s not Working Financial institutions around the world are rapidly realizing that women represent a lucrative business opportunity, and they are today’s largest, fastest growing, and most under-served new target market. Over the past few years, initiatives around women and wealth have proliferated — from bank-owned sites and standalone private platforms to educational in-person forums and communities for women. That said, much of the associated messaging is out of date, condescending, or just plain wrong. Saying that women lack confidence or that women are risk-averse is seriously lazy and inaccurate messaging. Here are some quotes and snippets from the white paper as to what’s not working. Alts are opaque. Caroline Miller, Independent Corporate Director, Montreal, Canada: “Whether we are talking about private credit or private equity, for women this is one big bucket that is perceived to be conceptually more opaque and logistically less liquid, thus requiring a deeper dive. For clarity, women’s need for greater explanations of alternative investment products is down to the industry’s marketing shortcomings, not women’s inability to comprehend them.” Miller points out that, even though a globally diversified portfolio requires a comprehensive cross-asset strategy, “people play the fiddle they know.” The farther you get from plain vanilla public market securities, the wider the information chasm. Outside of their core equity and fixed income holdings, women tend to allocate some capital to REITs for a steady income stream or maybe buy gold. “But what else would they invest in if they understood the full array of alternatives?” she asks. “Women have fiduciary responsibility for significant financial wealth. They want and need to know more.” The network effect is lacking for women. Diana Biggs, Partner, 1kx, Zug, Switzerland: “The world of private equity and alternative investments can feel daunting if you don’t have power. Lots of deals come via social circles, and you need to be invited in. The men who typically have access to invite people need to open the door, and the women also need to be interested in taking the opportunity to learn. We can onboard each other. Critically, I tell women not to be turned off…keep trying.” Biggs thinks men involved in alternative investments are not necessarily behaving with ill intention. They are very busy and probably don’t notice you, she advises. “When I go to funds conferences or trader chat gatherings, there are 20 men and maybe one to two other women in the room. It can be hard to get into the conversation. It would be nice for this huge majority of men to recognize what exactly is missing and help figure out how to bring women in.” Macho-themed sales and marketing falls short. Blair duQuesnay, Lead Advisor, Ritholtz Wealth Management, New Orleans, US: “The culture of the investment industry in the United States is still very male-centric. The dominant focus is on ‘us versus them’, ‘you either win or you lose’, and ‘eat what you kill.’ This attitude continues to be a turnoff to all women — just as I wrote about five years ago in my New York Times opinion piece,“ Consider Firing Your Male Broker.” Marketing in the financial services industry mirrors the culture of investing: macho, duQuesnay points out. “Investors have an expectation that as they accumulate more wealth, there have ‘better’ investments available to them. The attitude about alternative investments is, ‘Now that you have $X million net worth, you will have access to private opportunities with guaranteed higher returns.’ In reality, just because investors have $5 million, they don’t necessarily need to start investing differently. What about the person behind the money? Who is this woman? What is she trying to accomplish? For what purpose?” DuQuesnay

The Alternative Investment Gender Gap: Marketing to Female Clients Read More »